Abstract
Background/Aim: The development of colon cancer is influenced by the tumour immune microenvironment, in which specific immune cell subsets may be useful predictors for patient’s clinical outcome and devising treatment strategies.
Materials and Methods: The distribution of tumour-infiltrating immune cell subpopulations of three cohorts of The Cancer Genome Atlas (n=225), GSE39582 (n=493), and GSE17536 (n=137) datasets were analysed on the basis of single cell RNA sequencing data via the Cibersortx software. A prognostic model was constructed via a penalised Cox regression model with least absolute shrinkage and selection operator (LASSO) penalty according to the one standard error rule.
Results: Conventional type 2 dendritic cells were correlated with a good prognosis, whereas NLRP3-expressing macrophages, C1QC-expressing tumour-associated macrophages, and GALTB-expressing B cells were correlated with a poor prognosis. We constructed a prognostic model based on prognosis related cell subsets including nine specific immune cell subsets. By using the LASSO method, we found that the model had a superior prediction ability in all three cohorts of patients.
Conclusion: Multiple immune cell subpopulations in the tumour microenvironment are associated with the prognosis of colon cancer. The established prognostic model has important clinical value in predicting the clinical outcome of patients with colon cancer and in treatment decision.
Keywords: Colon cancer, immune infiltrating cells, microenvironment scores, single-cell RNA sequencing, Cibersortx, least absolute shrinkage and selection operator
Colon cancer is one of the most common aggressive tumours worldwide (1). Current treatment methods, including surgery, chemotherapy, radiotherapy, or their combination have significantly improved patient survival rate (2). In addition, the application of biomarkers enables effective screening and helps identify patients with a high risk of relapse and resistance to therapy, which in turn makes individualised treatment plans and follow-up strategies possible. In particular, treatment modalities involving immune checkpoint inhibitors have improved the survival of patients with malignant tumours (3). However, in patients with colon cancer, the therapeutic efficacy of immune checkpoint inhibitors is poor, except for those with deficient mismatch repair (dMMR) associated with a high degree of microsatellite instability (4).
The immune tumour microenvironment (TME) is now considered as a potential target for immunotherapy (5). The TME includes tumour cells, stromal cells such as fibroblasts, endothelial cells, and immune cells, and non-cellular components of extracellular matrix such as collagen, fibronectin, hyaluronan, and laminin. The interaction of tumours with cellular and non-cellular components of the TME results in the generation of a complex network that can be used by tumour cells to ensure favourable conditions for their proliferation, dissemination, and resistance to therapy (6). In colon cancer, CD8-positive T cells, tertiary lymphoid structures, regulatory T cells, and macrophages have shown strong correlation with prognosis (7). Recently, Zhang et al. (8) performed systematic evaluation of the subgroup composition among B cells, T cells, and myeloid cells in the colon cancer TME via single cell RNA sequencing (scRNA-seq) and revealed that critical cellular interactions regulated tumour immunity, thus, indicating the importance of the analysis of the TME. These results also emphasize the complexity of the TME and the need to precisely identify immune cell subgroups and determine their interrelationship to reveal their role in the prognosis of colon cancer.
The Cibersort analytical tool can be used to calculate the relative content of 22 specific immune cell subtypes in the TME based on machine learning algorithms (9). Based on this approach, several studies have established prognostic models for various types of cancer (10-14). Cibersortx, an upgraded version of Cibersort, could be applied to establish multi-gene signatures of cell subpopulations based on scRNA-seq data and be used to analyse the relative content of these subpopulations (15). We believe that in colon cancer, a prognostic model based on a more detailed subpopulation structure can help discover specific immune cell subsets in the TME, further identify new biomarkers and explore novel treatment modalities.
In the present study, we aimed to use the Cibersortx software to establish gene signatures for myeloid and T- and B-cell lineages in colon cancer on the basis of the scRNA-seq dataset GSE146771 (8) and to calculate the proportions of each immune cell subpopulation in public data cohorts. This led to construction of a prognostic model for subsequent verification and analysis.
Materials and Methods
Study cohorts. The scRNA-seq dataset GSE146771 generated via the 10×genomics platform was downloaded from the Gene Expression Omnibus (GEO) website. The data on the cells from peripheral blood and adjacent tissues were excluded and only those on tumour tissues of 10 patients were used. The expression profiles of a total of 10,694 cells were analysed, including 5 B-cell, 3 innate lymphoid cell, 13 myeloid cell, and 17 T-cell subgroups. The transcripts per million (TPM) values were used for subsequent analyses.
The data on RNA-seq, exome sequencing (VarScan2 variant aggregation and masking), and clinicopathological characteristics, including sex, age, TNM staging, and follow-up information on colon cancer patients were downloaded from The Cancer Genome Atlas (TCGA). After exclusion of patients with American Joint Committee on Cancer (AJCC) stage IV, with incomplete clinical pathological information, and with a follow-up period less than one month, a total of 225 patients were analysed.
The microchip gene expression datasets GSE39582 and GSE17536 were downloaded from the GEO website. Similarly, patients with AJCC stage IV, with incomplete clinicopathological information and with a follow-up period less than one month were excluded. This allowed the analysis of 493 patients from GSE39582 and 137 from GSE17536, all of the patients received surgical treatment. All gene expression data were normalised and converted into the log 2 format. Clinicopathological data, including age, sex, TNM staging, dMMR status, BRAF, KRAS, and TP53 mutation status, and follow-up information were also analysed. The study was approved by the Ethical Committee of The First Medical Center of PLA General Hospital.
Construction of an scRNA-seq signature matrix. To identify cell type-specific gene expression signatures, an scRNA-seq matrix was constructed with the Cibersortx software (15). We first segmented the GSE146771 data in accordance with immune cell types: B cells, myeloid and innate lymphoid cells, and CD4-positive and CD8-positive T cells. The data were uploaded following Cibersortx protocol. The ‘create signature matrix’ module was then used to obtain the gene signature matrix of the immune cell types with the following settings: the minimum expression level set to 0, number of replicates to 5, sampling to 0.75, kappa to 999, q-value to 0.01, and number of barcode genes to 300-500.
Estimation of cell proportions using Cibersortx. We continued to upload the data from TCGA, GSE39582, and GSE17536, and estimated the proportions of each immune cell subgroup based on the gene signature matrix of the major cell groups mentioned in the previous section. The parameters were set as default, and batch calibration was performed with the b-mode. In the three datasets, the ‘impute cell fractions’ module was applied to determine the proportions of 5 B-cell, 3 innate lymphoid cell, 13 myeloid cell, 10 CD4-positive T-cell, and 7 CD8-positive T-cell subgroups.
Establishment and verification of the prognostic model. The GSE39582 dataset was used as a training cohort to construct the prognostic model. In the training cohort, we determined the optimal cut-off value of the above-mentioned proportion of immune cell subpopulations with the X-tile software (Yale University, New Haven, CT, USA) (16). The proportions of the subpopulations above or below the cut-off value were considered to be high or low, respectively. We then used all estimated cell subpopulation parameters as predictors in a penalised Cox regression model with the least absolute shrinkage and selection operator (LASSO) penalty on the basis of the one standard error (SE) rule to obtain the combination of cell subpopulations with the greatest impact on cancer prognosis. The coefficients corresponding to the selected parameters were extracted from the LASSO model and used to build a prognostic model for the microenvironment score (MES):
MES=Σ (LASSO coefficient of cell type i×status of cell type i)
The best MES cut-off value was determined with the X-tile software, and the samples were divided into high- and low-MES groups. The differences in prognosis between the two groups were compared, and the prognostic model was validated with TCGA and GSE17536 cohorts.
Gene set enrichment analysis (GSEA) and comparison of mutant genes and immune gene scores. To compare the differences in genetic signatures between the low- and high-MES groups, GSEA was performed via the GSEA Java software and the c2.cp.kegg.v7.4.symbols database. The maftools R package was used to analyse the differences between the mutation spectra of the two groups to determine potential cancer driver genes. Immunity-associated gene scores were also compared between the two groups, including IFN-γ-related genes (IDO1, CXCL10, CXCL9, HLA-DRA, STAT1, IFNG) (17), expanded immune signature (CD3D, IDO1, CIITA, CD3E, CCL5, GZMK, CD2, HLA-DRA, CXCL3, IL2RG, NKG7, HLA-E, CXCR6, LAG3, TAGAP, CXCL10, STAT1, GZMB) (17), cytolytic activity (CYT) score (GZMA, PRF1) (18), T cell-inflamed signature (IRF1, CD8A, CCL2, CCL3, CCL4, CXCL9, CXCL10, ICOS, GZMK, HLA-DMA, HLA-DMB, HLA-DOA, HLA-DOB) (19), and immune checkpoint index (CD274, IDO2, PDCD1LG2, CTLA4, IDO1, ADORA2A, LAG3, PDCD1, TIGIT, HAVCR2, VISTA, VTCN1) (20). These gene signatures were chosen due to their relevance to anti-tumour immunity, which may indicate potential immunotherapeutic benefits (21,22).
Statistical analyses. Statistical analyses were performed with Statistical Package for the Social Sciences (SPSS 25.0, SPSS Inc., Chicago, IL, USA) and the R software. Comparisons between the groups were performed by analysis of variance (ANOVA) or non-parametric tests. Survival was evaluated by the Kaplan-Meier method, and the difference in survival between the groups was analysed by the log-rank test. The Cox risk ratio model was used for univariate and multivariate analyses to identify independent prognostic factors. The time-dependent curve was used to analyse the predictive ability of the MES model. All statistical tests were two-sided, and statistical significance was set at p<0.05.
Results
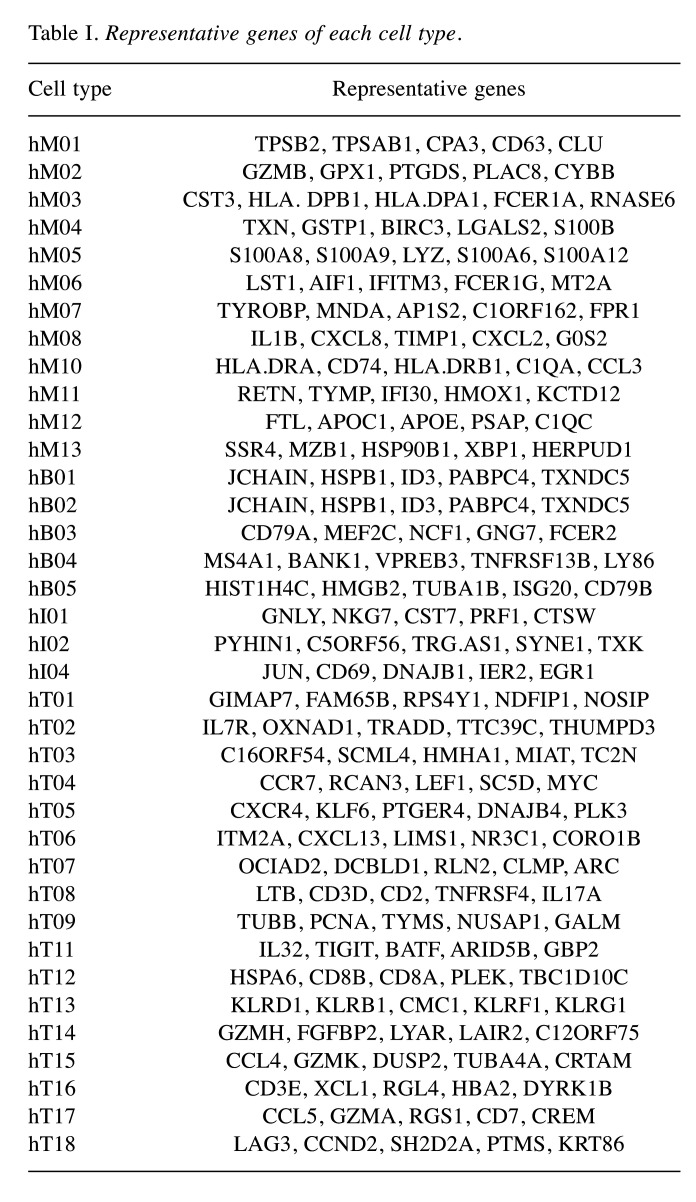
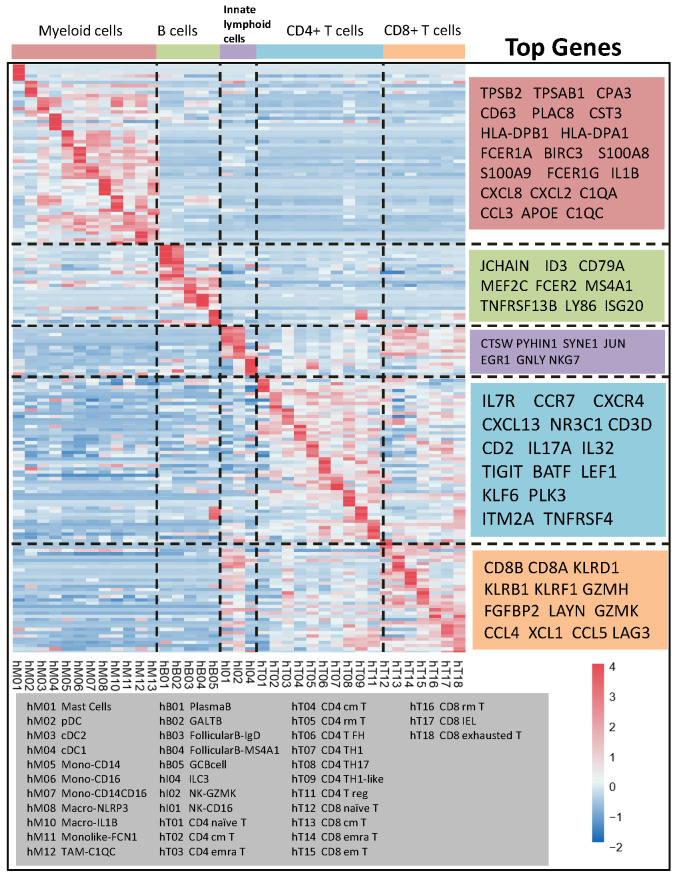
Establishment of a representative gene matrix for cell subpopulations. By running the ‘create signature matrix’ module of Cibersortx, we obtained the gene signature matrix of immune cell subgroups. The top 5 representative genes in each subgroup are shown in Table I. In terms of the myeloid lineage, the genes were TPSB1, TPSAB1, CD63, HLA-DPB1, and C1QC. The detectable myeloid cell subpopulations in the TME were mast cells (hM01), plasmacytoid dendritic cells (DCs) (hM02), classic DCs 2 and 1 (hM03 and hM04, respectively), CD14-expressing monocytes (hM05), CD16- and CD14/CD16-expressing monocytes (hM06 and hM07, respectively), NLRP3- and IL-1B-expressing macrophages (hM08 and hM10, respectively), monocyte-derived FCN1-expressing macrophages (hM11), and C1QC-expressing tumour-associated macrophages (hM12). Representative B-cell genes included JCHAIN, ID3, CD79A, and MS4A1. The B-cell population consisted of IgG-producing plasma B cells (hB01), IgA-producing GALT B cells (hB02), IgD-producing follicular B cells (hB03), MS4A1-expressing follicular B cells (hB04), and GC B cells (hB05). The T-cell population was comprised of naïve T cells (hT01 and hT12), central memory T cells (hT04 and hT13), resident memory T cells (hT05 and hT16), Th1 cells (hT07 and hT09), and Th17 cells (hT08). The subgroups and representative genes are shown in Figure 1.
Table I. Representative genes of each cell type.
Figure 1. Gene expression heatmap of signature matrix based on the cluster of GSE146771.
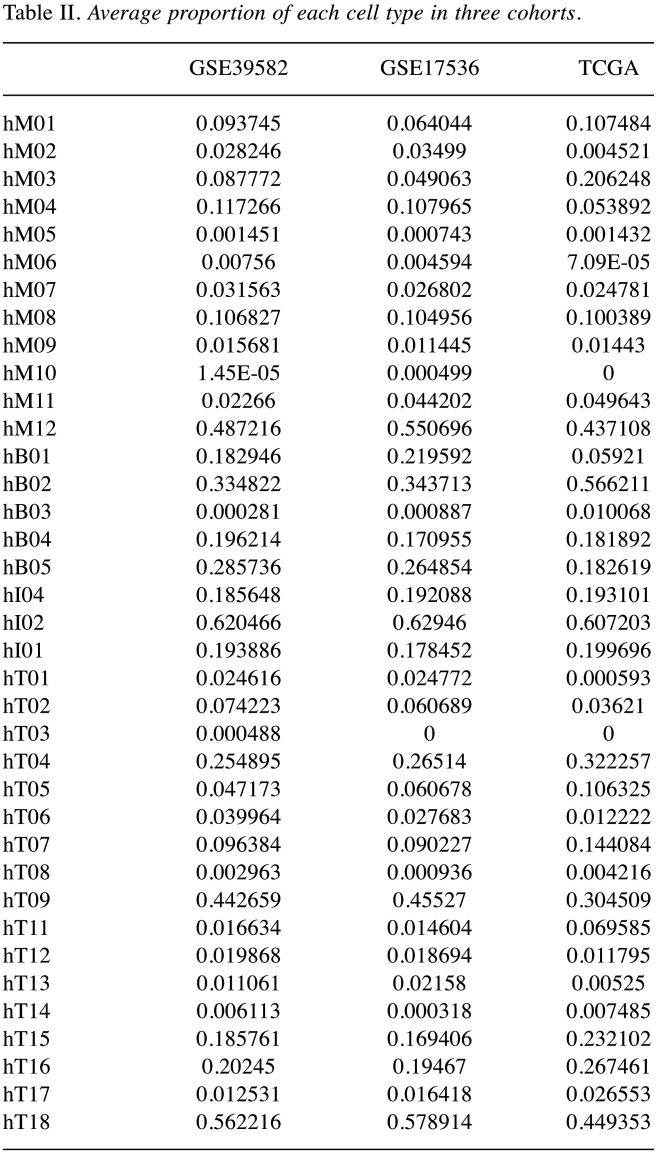
Estimation of the proportions of cell subpopulations. The proportions of cell subpopulations in each sample of the three cohorts were determined, and the average values were calculated for each cohort (Figure 2A). Among myeloid cells, the highest proportion was observed for hM12 in all cohorts: 48.7% in GSE39582, 55.1% in GSE17536, and 43.7% in TCGA, followed by hM04 proportion in GSE39582 and GSE17536 (11.7% and 10.8%, respectively) and hM03 proportion in TCGA (20.6%). The largest subpopulation among B cells was hB02 (33.5%, 34.4%, and 56.6% in GSE39582, GSE1753, and TCGA, respectively) and among innate lymphoid cells, it was hI02 (62.0%, 62.9%, and 60.7% in GSE39582, GSE1753, and TCGA, respectively). Among CD4- and CD8-positive T cells, hT09 and hT1 had the highest proportions; in GSE39582, GSE1753, and TCGA, they were 44.3% and 56.2%, 45.5% and 57.9%, and 30.5% and 44.9% respectively. Overall, the three cohorts had similar distributions of immune cell subpopulations (the details are presented in Table II).
Figure 2. Construction of prognostic model based on the estimation of the proportion of cell subpopulations. A. Summary of the proportion of each cluster in GSE17536, GSE39582, and TCGA cohorts. B. Tenfold cross-validation for the tuning parameter selection in the LASSO model. C. LASSO coefficient landscapes of the fractions of the 38 cell types. D. Coefficients of selected cell types used for construction of the prognostic model.
Table II. Average proportion of each cell type in three cohorts.
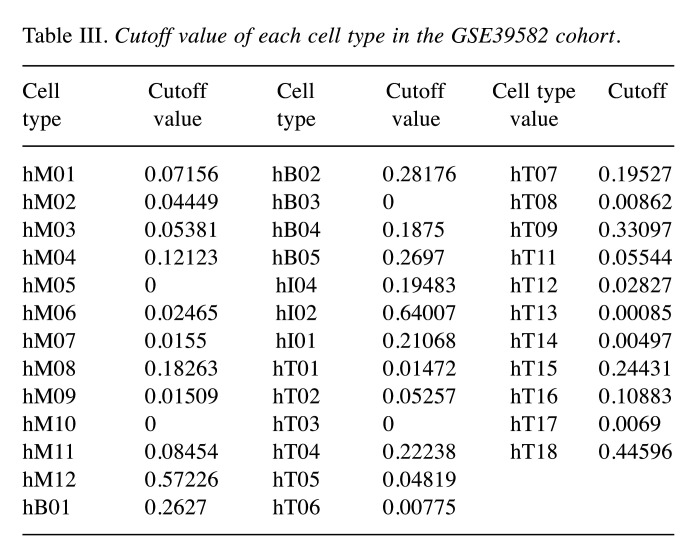
Establishment and verification of the MES model. GSE39582 was used to establish the prognostic model and the cut-off values of each cell subgroup determined with X-tile are presented in Table III. To build the model, 9 cell subpopulations, namely hM03, hM08, hM12, hB02, hI04, hT02, hT05, hT15, and hT18 (Figure 2B and C), were selected as the best parameters via the LASSO algorithm. The model was as follows:
Table III. Cutoff value of each cell type in the GSE39582 cohort.
MES=–0.11910×status of hM03+0.32104×status of hM08+0.04489×status of hM12+0.21291×status of hB02+0.15438×status of hI04-0.00358×status of hT02+0.02527×status of hT05+0.22393×status of hT15-0.02227×status of hT18
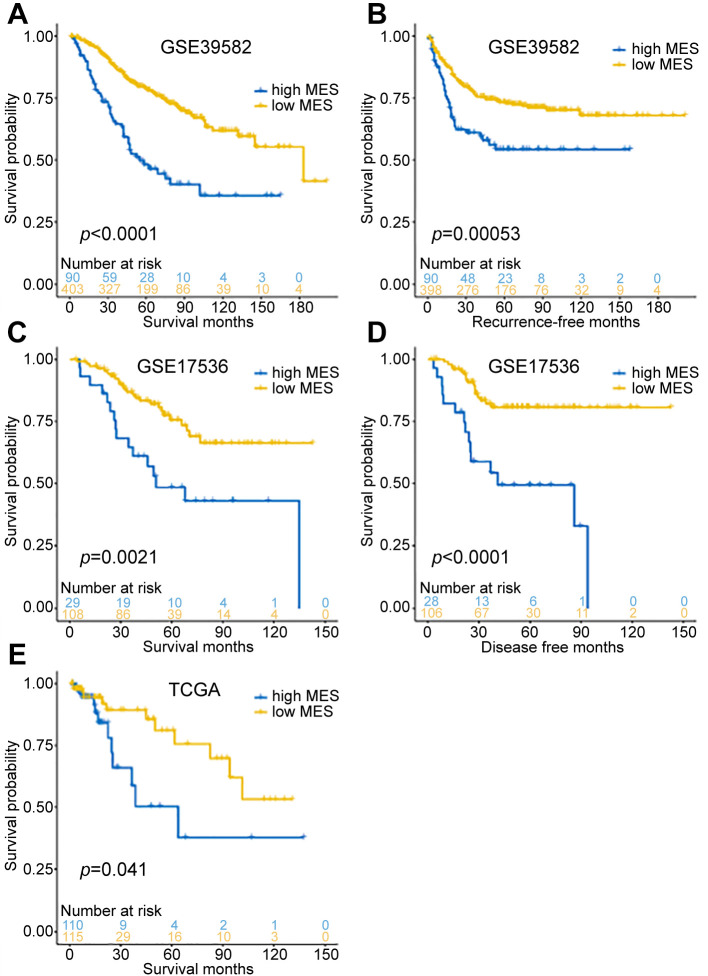
Then, we determined the MES cut-off value with X-tile and divided the samples into high- and low-MES groups. In the training cohort (GSE39582), overall survival and recurrence-free survival were significantly better in the low-MES group than those in the high-MES group (log-rank test p<0.001, Figure 3A and B), and similar results were obtained in the verification cohort (GSE17536; log-rank test p<0.05, Figure 3C and D). In TCGA validation cohort, overall survival was also significantly better in the low-MES group than that in the high-MES group; however, recurrence events were recorded only on 9 patients in this cohort, which precluded analysis of recurrence-free survival. Overall, these results showed that MES was significantly related to the patient prognosis in each cohort.
Figure 3. Survival analysis in GSE17536, GSE39582, and TCGA cohorts. A. The overall survival curve of the GSE39582 cohort (p<0.0001). B. The recurrence-free survival curve of the GSE39582 cohort (p=0.00053). C. The overall survival curve of the GSE17536 cohort (p=0.0021). D. The disease-free survival curve of the GSE17536 cohort (p<0.0001). E. The overall survival curve of the TCGA cohort (p=0.041).
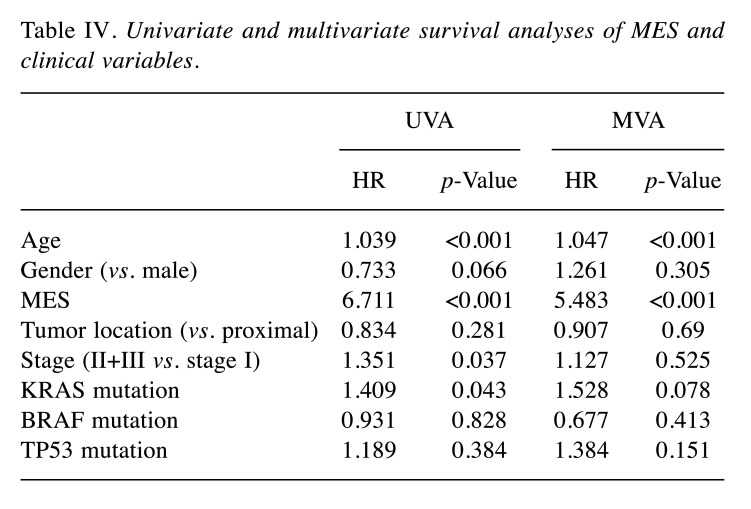
Correlation between the MES and clinicopathological characteristics. Next, we compared the differences in clinicopathological characteristics between low- and high-MES groups in the GSE39582 cohort. T4, positive lymph node metastasis, dMMR, and BRAF mutations were associated with a higher MES (Figure 4A, all p<0.05). The results of univariate and multivariate Cox regression analyses revealed that the MES was an independent prognostic factor (Table IV). A comparison of the abilities between the MES and TNM staging to predict 5-year survival showed that the area under the curve (AUC) was significantly larger for the MES than that for the TNM staging: 0.663 vs. 0.552 (p=0.015, Figure 4B and C). The AUC of the MES was 0.618, higher than that of the TNM staging, indicating that the MES was a better prognostic marker than the TNM staging.
Figure 4. The relationship between MES and clinicopathological characteristics. A. MES values in different clinical subgroups. B. Comparison of the prognostic performance of MES (AUC=0.663), MES group (AUC=0.618), and TNM stage (AUC=0.552) using the timedependent ROC of the 5-year overall survival. C. Comparison of the all-time prognostic performance of MES and TNM stage (p=0.015).
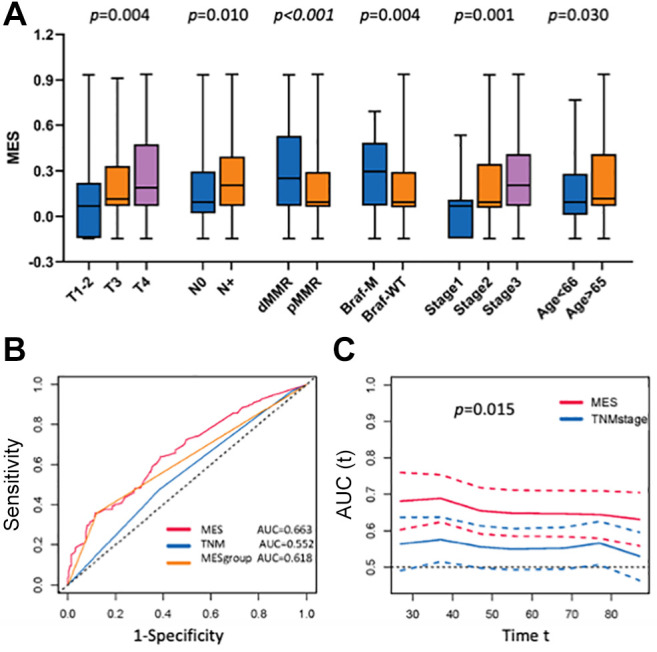
Table IV. Univariate and multivariate survival analyses of MES and clinical variables.
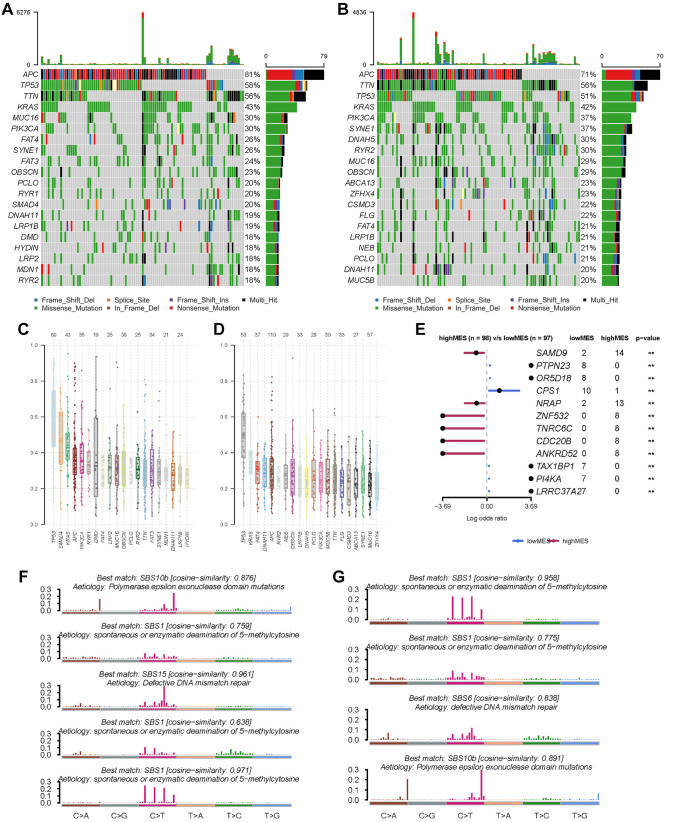
Comparison of mutation frequency between the low- and high-MES groups. Analysis of the mutation rates indicated that APC, TP53, and KRAS were the most frequent mutations in both the low- and high-MES groups of the TCGA cohort (Figure 5A and B), and the similarity between the groups was confirmed by the results of variant allele frequencies (Figure 5C and D). Further comparison revealed that there was an increased mutation rate in SAMD9, NRAP, ZNF532, and CDC20B genes of the high-MES group, as well as in PTPN23, CPS1, and PI4KA genes of the low-MES group and the differences between the two groups were significant (Figure 5E). As these genes might potentially affect the immune TME, in-depth mechanistic research is required. Mutation signature analysis also indicated that in the low-MES group, the cosine similarity with the spontaneous or enzymatic deamination of 5-methylcytosine was 0.971 and that with dMMR was 0.961 (Figure 5F), whereas in the high-MES group, the cosine similarity with the spontaneous or enzymatic deamination of 5-methylcytosine was 0.958 and that with polymerase epsilon exonuclease domain mutation was 0.891 (Figure 5G).
Figure 5. Somatic mutation characteristics of the two MES subgroups in the TCGA cohort. A. Top most frequently mutated genes of the low MES subgroup. B. Top most frequently mutated genes of the high-MES subgroup. C. Variant allele frequencies of the low-MES subgroup. D. Variant allele frequencies of the high-MES subgroup. E. Significantly different (p<0.01) mutated genes between the low- and high-MES subgroups. F. The mutational signature of the low MES subgroup. G. The mutational signature of the high-MES subgroup.
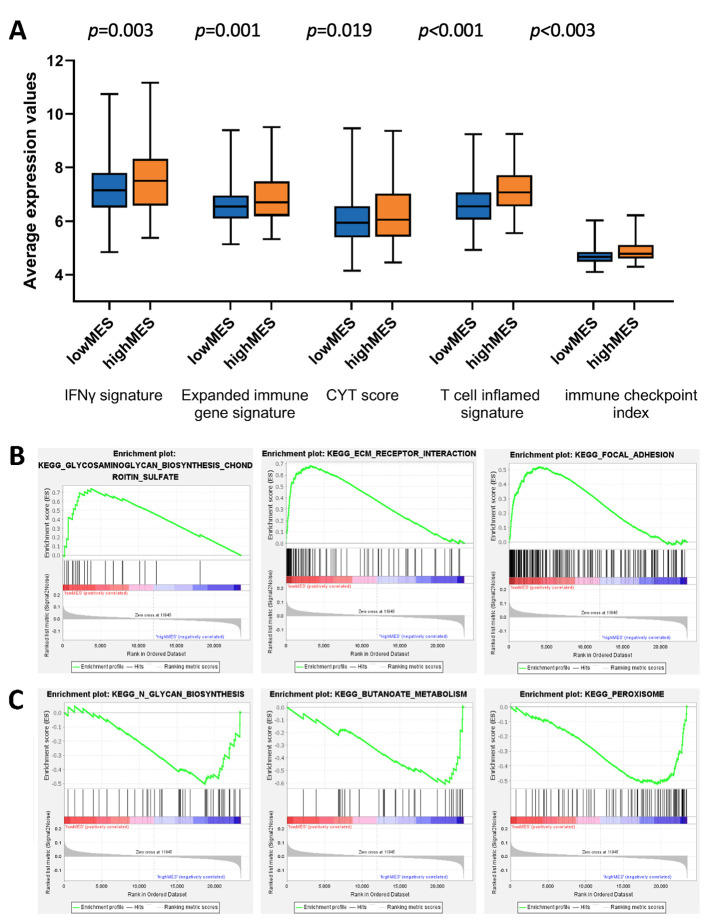
Comparison of the functional gene expression profiles between the two MES groups. Calculation of the immune-related gene scores in each sample indicated that the high-MES group had increased expression of the genes in the IFN-γ signature, expanded immune gene signature, CYT and T cell-inflamed signature scores, and immune checkpoint index (Figure 6A, all p<0.05). These results suggested that patients with a higher MES might have stronger anti-tumour immune reactivity and a better therapeutic response to immune checkpoint inhibitors. The GSEA results revealed the enrichment of extracellular matrix-receptor interactions and focal adhesion pathways in the low-MES group (Figure 6B) and that of butanoate metabolism and peroxisome pathways in the high-MES group (Figure 6C).
Figure 6. Comparison of the biological functional differences between the high- and low-MES groups. A. different values of the IFNγ signature (p=0.003), expanded immune gene signature (p=0.001), CYT score (p=0.019), T cell inflamed signature (p<0.001), and immune checkpoint index (p<0.001) among the MES subgroups. B. The top Kyoto Encyclopedia of Genes and Genomes (KEGG) pathways enriched in the low-MES subgroup based on GSEA. C. The top KEGG pathways enriched in high-MES subgroup based on GSEA.
Discussion
The development of the scRNA-seq technology enables analysis of TME components at a high resolution (23,24). In colon cancer, a variety of cell subpopulations that sometimes exhibit opposite biological and immunological functions have been identified, thus, revealing the complexity of the TME (8,24,25). For example, in colon cancer, activated macrophages promote metastasis (26), whereas CD8-positive T cells inhibit disease progression (27). The regulatory role of DCs in colon cancer development has also been established (28). It is suggested that various cancer types may differ in the proportions of immune cell subpopulations in the TME (24). Furthermore, even in patients with the same cancer type, tumours show heterogeneity in TME composition, accounting for individual differences in cancer initiation and progression and thus, could be used in personalised medicine to predict treatment response and disease outcome.
In this study, we employed high-resolution scRNA-seq technology to analyse, for the first time, the distribution of immune cell subgroups in the TME of colon cancer and their association with the biological characteristics of the tumour. The results indicated that the increase in the DC2 (hM03) subpopulation of myeloid cells was associated with a better patient prognosis. A previous study has shown that the DC2 subgroup, which is highly heterogeneous among different cancer types, plays a key role in carcinogenesis through antigen presentation and is important for the anti-tumour immunity in colon cancer (29). On the contrary, the high proportions of two types of macrophages (hM08 and hM12) were associated with a poor prognosis, which may be related to their role in intestinal homeostasis and cancer-promoting effects (30). In addition, we found that the B-cell subgroup hB02 and the innate lymphoid cell subgroup hI04 were both associated with a poor prognosis; however, the underlying mechanism remains unknown (31) and requires further exploration. Among T cells, the prognosis-related subpopulations included CD4-positive resident and central memory cells (hT02 and hT05) and CD8-positive effector memory (hT15) and exhaustion (hT18) cells. These T-cell subpopulations may be directly related to the anti-tumour immune response and may provide important clues for examining the sensitivity of patients to immunotherapy.
Our prognostic model based on the TME immune cell profile (MES) showed a good predictive ability, revealing that a high MES often suggested a poor clinical outcome. At the same time, a high MES was also correlated with a high score for immunity-related genes as well as with the dMMR status, which indicated a good prognosis. However, this study suggested that tumours with the dMMR status were heterogeneous and were also found in patients with a poor prognosis, who however may respond to immunotherapy. We believe that patients undergoing radical surgery should also be screened so that specific patients can be identified and benefit from adjuvant immunotherapy.
In conclusion, the present study on large samples revealed the distribution of immune cell subpopulations in the TME of colon cancer. The identified differences in the TME composition and cancer prognosis between patients with a low and high MES should be beneficial to the development of a new strategy for multimodal individualised treatment of combined immunotherapy. The scRNA-seq technology employed in this study may be helpful in future research on specific immune cell subgroups, identification of new prognostic biomarkers, and exploration of new combined immunotherapy modalities; therefore, it is of vital importance for improving disease outcome.
Conflicts of Interest
The Authors declare that they have no competing interests in relation to this study.
Authors’ Contributions
Dr. LE had full access to all data in this study and take responsibility for the integrity of the data and the accuracy of the data analysis. Concept and design: LY, and LX. Acquisition, analysis, or interpretation of data: All Authors. Drafting of the manuscript: LY, XQ and GX. Critical revision of the manuscript for important intellectual content: LY and LE. Statistical analysis: LY, LX and XQ. Obtained funding: LE. Administrative, technical, or material support: LY, and LX. Supervision: LY and LE.
References
- 1.Siegel RL, Miller KD, Jemal A. Cancer statistics, 2019. CA Cancer J Clin. 2019;69(1):7–34. doi: 10.3322/caac.21551. [DOI] [PubMed] [Google Scholar]
- 2.Brenner H, Kloor M, Pox CP. Colorectal cancer. Lancet. 2014;383(9927):1490–1502. doi: 10.1016/S0140-6736(13)61649-9. [DOI] [PubMed] [Google Scholar]
- 3.Ganesh K, Stadler ZK, Cercek A, Mendelsohn RB, Shia J, Segal NH, Diaz LA Jr. Immunotherapy in colorectal cancer: rationale, challenges and potential. Nat Rev Gastroenterol Hepatol. 2019;16(6):361–375. doi: 10.1038/s41575-019-0126-x. [DOI] [PMC free article] [PubMed] [Google Scholar]
- 4.Chalabi M, Fanchi LF, Dijkstra KK, Van den Berg JG, Aalbers AG, Sikorska K, Lopez-Yurda M, Grootscholten C, Beets GL, Snaebjornsson P, Maas M, Mertz M, Veninga V, Bounova G, Broeks A, Beets-Tan RG, de Wijkerslooth TR, van Lent AU, Marsman HA, Nuijten E, Kok NF, Kuiper M, Verbeek WH, Kok M, Van Leerdam ME, Schumacher TN, Voest EE, Haanen JB. Neoadjuvant immunotherapy leads to pathological responses in MMR-proficient and MMR-deficient early-stage colon cancers. Nat Med. 2020;26(4):566–576. doi: 10.1038/s41591-020-0805-8. [DOI] [PubMed] [Google Scholar]
- 5.Koi M, Carethers JM. The colorectal cancer immune microenvironment and approach to immunotherapies. Future Oncol. 2017;13(18):1633–1647. doi: 10.2217/fon-2017-0145. [DOI] [PMC free article] [PubMed] [Google Scholar]
- 6.Wu T, Dai Y. Tumor microenvironment and therapeutic response. Cancer Lett. 2017;387:61–68. doi: 10.1016/j.canlet.2016.01.043. [DOI] [PubMed] [Google Scholar]
- 7.Fridman WH, Zitvogel L, Sautès-Fridman C, Kroemer G. The immune contexture in cancer prognosis and treatment. Nat Rev Clin Oncol. 2017;14(12):717–734. doi: 10.1038/nrclinonc.2017.101. [DOI] [PubMed] [Google Scholar]
- 8.Zhang L, Li Z, Skrzypczynska KM, Fang Q, Zhang W, O’Brien SA, He Y, Wang L, Zhang Q, Kim A, Gao R, Orf J, Wang T, Sawant D, Kang J, Bhatt D, Lu D, Li CM, Rapaport AS, Perez K, Ye Y, Wang S, Hu X, Ren X, Ouyang W, Shen Z, Egen JG, Zhang Z, Yu X. Single-cell analyses inform mechanisms of myeloid-targeted therapies in colon cancer. Cell. 2020;181(2):442–459.e29. doi: 10.1016/j.cell.2020.03.048. [DOI] [PubMed] [Google Scholar]
- 9.Newman AM, Liu CL, Green MR, Gentles AJ, Feng W, Xu Y, Hoang CD, Diehn M, Alizadeh AA. Robust enumeration of cell subsets from tissue expression profiles. Nat Methods. 2015;12(5):453–457. doi: 10.1038/nmeth.3337. [DOI] [PMC free article] [PubMed] [Google Scholar]
- 10.Fu Y, Sun S, Bi J, Kong C, Yin L. Construction and analysis of a ceRNA network and patterns of immune infiltration in bladder cancer. Transl Androl Urol. 2021;10(5):1939–1955. doi: 10.21037/tau-20-1250. [DOI] [PMC free article] [PubMed] [Google Scholar]
- 11.Li T, Pang X, Wang J, Wang S, Guo Y, He N, Xing P, Li J. Exploration of the tumor-suppressive immune microenvironment by integrated analysis in EGFR-mutant lung adenocarcinoma. Front Oncol. 2021;11:591922. doi: 10.3389/fonc.2021.591922. [DOI] [PMC free article] [PubMed] [Google Scholar]
- 12.Pan Q, Cheng Y, Cheng D. Identification of CD8+ T cell-related genes: correlations with immune phenotypes and outcomes of liver cancer. J Immunol Res. 2021;2021:9960905. doi: 10.1155/2021/9960905. [DOI] [PMC free article] [PubMed] [Google Scholar]
- 13.Pan X, Jin X, Wang J, Hu Q, Dai B. Placenta inflammation is closely associated with gestational diabetes mellitus. Am J Transl Res. 2021;13(5):4068–4079. [PMC free article] [PubMed] [Google Scholar]
- 14.Qin R, Peng W, Wang X, Li C, Xi Y, Zhong Z, Sun C. Identification of genes related to immune infiltration in the tumor microenvironment of cutaneous melanoma. Front Oncol. 2021;11:615963. doi: 10.3389/fonc.2021.615963. [DOI] [PMC free article] [PubMed] [Google Scholar]
- 15.Newman AM, Steen CB, Liu CL, Gentles AJ, Chaudhuri AA, Scherer F, Khodadoust MS, Esfahani MS, Luca BA, Steiner D, Diehn M, Alizadeh AA. Determining cell type abundance and expression from bulk tissues with digital cytometry. Nat Biotechnol. 2019;37(7):773–782. doi: 10.1038/s41587-019-0114-2. [DOI] [PMC free article] [PubMed] [Google Scholar]
- 16.Camp RL, Dolled-Filhart M, Rimm DL. X-tile: a new bio-informatics tool for biomarker assessment and outcome-based cut-point optimization. Clin Cancer Res. 2004;10(21):7252–7259. doi: 10.1158/1078-0432.CCR-04-0713. [DOI] [PubMed] [Google Scholar]
- 17.Ayers M, Lunceford J, Nebozhyn M, Murphy E, Loboda A, Kaufman DR, Albright A, Cheng JD, Kang SP, Shankaran V, Piha-Paul SA, Yearley J, Seiwert TY, Ribas A, McClanahan TK. IFN-γ-related mRNA profile predicts clinical response to PD-1 blockade. J Clin Invest. 2017;127(8):2930–2940. doi: 10.1172/JCI91190. [DOI] [PMC free article] [PubMed] [Google Scholar]
- 18.Rooney MS, Shukla SA, Wu CJ, Getz G, Hacohen N. Molecular and genetic properties of tumors associated with local immune cytolytic activity. Cell. 2015;160(1-2):48–61. doi: 10.1016/j.cell.2014.12.033. [DOI] [PMC free article] [PubMed] [Google Scholar]
- 19.Spranger S, Bao R, Gajewski TF. Melanoma-intrinsic β-catenin signalling prevents anti-tumour immunity. Nature. 2015;523(7559):231–235. doi: 10.1038/nature14404. [DOI] [PubMed] [Google Scholar]
- 20.Balli D, Rech AJ, Stanger BZ, Vonderheide RH. Immune cytolytic activity stratifies molecular subsets of human pancreatic cancer. Clin Cancer Res. 2017;23(12):3129–3138. doi: 10.1158/1078-0432.CCR-16-2128. [DOI] [PubMed] [Google Scholar]
- 21.Narayanan S, Kawaguchi T, Yan L, Peng X, Qi Q, Takabe K. Cytolytic activity score to assess anticancer immunity in colorectal cancer. Ann Surg Oncol. 2018;25(8):2323–2331. doi: 10.1245/s10434-018-6506-6. [DOI] [PMC free article] [PubMed] [Google Scholar]
- 22.Wu X, Gao X, Xing X, Wen X, Li Z, Ji J. The T-Cell-inflammation status can predict outcomes of adjuvant chemotherapy in patients with gastric cancer. Ann Surg Oncol. 2021;28(3):1407–1416. doi: 10.1245/s10434-020-09005-4. [DOI] [PubMed] [Google Scholar]
- 23.Hartmann FJ, Mrdjen D, McCaffrey E, Glass DR, Greenwald NF, Bharadwaj A, Khair Z, Verberk SGS, Baranski A, Baskar R, Graf W, Van Valen D, Van den Bossche J, Angelo M, Bendall SC. Single-cell metabolic profiling of human cytotoxic T cells. Nat Biotechnol. 2021;39(2):186–197. doi: 10.1038/s41587-020-0651-8. [DOI] [PMC free article] [PubMed] [Google Scholar]
- 24.Cheng S, Li Z, Gao R, Xing B, Gao Y, Yang Y, Qin S, Zhang L, Ouyang H, Du P, Jiang L, Zhang B, Yang Y, Wang X, Ren X, Bei JX, Hu X, Bu Z, Ji J, Zhang Z. A pan-cancer single-cell transcriptional atlas of tumor infiltrating myeloid cells. Cell. 2021;184(3):792–809.e23. doi: 10.1016/j.cell.2021.01.010. [DOI] [PubMed] [Google Scholar]
- 25.Zhang L, Yu X, Zheng L, Zhang Y, Li Y, Fang Q, Gao R, Kang B, Zhang Q, Huang JY, Konno H, Guo X, Ye Y, Gao S, Wang S, Hu X, Ren X, Shen Z, Ouyang W, Zhang Z. Lineage tracking reveals dynamic relationships of T cells in colorectal cancer. Nature. 2018;564(7735):268–272. doi: 10.1038/s41586-018-0694-x. [DOI] [PubMed] [Google Scholar]
- 26.Brown CC, Gudjonson H, Pritykin Y, Deep D, Lavallée VP, Mendoza A, Fromme R, Mazutis L, Ariyan C, Leslie C, Pe’er D, Rudensky AY. Transcriptional basis of mouse and human dendritic cell heterogeneity. Cell. 2019;179(4):846–863.e24. doi: 10.1016/j.cell.2019.09.035. [DOI] [PMC free article] [PubMed] [Google Scholar]
- 27.Zaki MH, Lamkanfi M, Kanneganti TD. The Nlrp3 inflammasome: contributions to intestinal homeostasis. Trends Immunol. 2011;32(4):171–179. doi: 10.1016/j.it.2011.02.002. [DOI] [PMC free article] [PubMed] [Google Scholar]
- 28.Klose CS, Artis D. Innate lymphoid cells as regulators of immunity, inflammation and tissue homeostasis. Nat Immunol. 2016;17(7):765–774. doi: 10.1038/ni.3489. [DOI] [PubMed] [Google Scholar]
- 29.Brown CC, Gudjonson H, Pritykin Y, Deep D, Lavallee VP, Mendoza A, Fromme R, Mazutis L, Ariyan C, Leslie C, Pe'er D, Rudensky AY. Transcriptional basis of mouse and human dendritic cell heterogeneity. Cell. 2019;179(4):846–863 e824. doi: 10.1016/j.cell.2019.09.035. [DOI] [PMC free article] [PubMed] [Google Scholar]
- 30.Zaki MH, Lamkanfi M, Kanneganti TD. The nlrp3 inflammasome: Contributions to intestinal homeostasis. Trends Immunol. 2011;32(4):171–179. doi: 10.1016/j.it.2011.02.002. [DOI] [PMC free article] [PubMed] [Google Scholar]
- 31.Klose CS, Artis D. Innate lymphoid cells as regulators of immunity, inflammation and tissue homeostasis. Nat Immunol. 2016;17(7):765–774. doi: 10.1038/ni.3489. [DOI] [PubMed] [Google Scholar]


