Liu et al. demonstrate the regulation of ILC2 by Ang II–AT1 signaling during the allergen challenge. Bone marrow chimera, deletion or pharmacological inhibition of AT1a, and ILC2 transfer into NCG mice collectively indicate that targeting lung RAS alleviates airway inflammation.
Abstract
Group 2 innate lymphoid cells (ILC2s) have emerged as critical mediators in driving allergic airway inflammation. Here, we identified angiotensin (Ang) II as a positive regulator of ILC2s. ILC2s expressed higher levels of the Ang II receptor AT1a, and colocalized with lung epithelial cells expressing angiotensinogen. Administration of Ang II significantly enhanced ILC2 responses both in vivo and in vitro, which were almost completely abrogated in AT1a-deficient mice. Deletion of AT1a or pharmacological inhibition of the Ang II–AT1 axis resulted in a remarkable remission of airway inflammation. The regulation of ILC2s by Ang II was cell intrinsic and dependent on interleukin (IL)-33, and was associated with marked changes in transcriptional profiling and up-regulation of ERK1/2 phosphorylation. Furthermore, higher levels of plasma Ang II correlated positively with the abundance of circulating ILC2s as well as disease severity in asthmatic patients. These observations reveal a critical role for Ang II in regulating ILC2 responses and airway inflammation.
Introduction
Allergic asthma is caused by repeated allergen exposure and is one of the most common chronic inflammatory diseases (Lambrecht and Hammad, 2015). Airway hyper-responsiveness and airway remodeling are the major pathologies of this disease. Type 2 T helper (Th2) cell–mediated B cell production of IgE and recruitment of mast cells and eosinophils are considered to be the dominant mechanisms of allergic asthma (Walker and McKenzie, 2018).
Emerging evidence has demonstrated the importance of group 2 innate lymphoid cells (ILC2s) in both initiating and amplifying allergic airway inflammation (Klose and Artis, 2016). Upon allergen challenge and helminth infection, lung epithelial cells secrete certain alarmins, such as IL-33, IL-25, and thymic stromal lymphopoietin, which activate ILC2s residing in the lungs and trigger their secretion of the type 2 cytokines IL-5 and IL-13 (Hardman et al., 2013; Oboki et al., 2010; von Moltke et al., 2016). These cascades cause recruitment of eosinophils, goblet cell hyperplasia, and activation of Th2, finally leading to allergic airway inflammation (Oliphant et al., 2014). ILC2s are therefore considered to be one of the major drivers of type 2 allergic inflammation. In contrast with the counterpart of Th2 cells in adaptive immunity, ILC2s do not express antigen-specific receptors; their activation is immediate and does not involve antigen presentation.
The mechanistic regulation of ILC2 has been extensively studied. ILC2s express receptors, including those for certain cytokines, lipid mediators, neurotransmitters, hormones, and nutrients, which renders them highly responsive to a variety of stimulators from the tissue microenvironment in a context-dependent manner (Cardoso et al., 2017; Chu et al., 2020; Klose et al., 2017; Nussbaum et al., 2013; Moriyama et al., 2018; von Moltke et al., 2016; Wallrapp et al., 2017). ILC2s also express receptors and ligands that mediate cell–cell interaction (Halim et al., 2018; Rigas et al., 2017). Upon receiving tissue-derived stimulation via particular receptors, ILC2s can be rapidly either activated or suppressed, thereby shifting tissue homeostasis or triggering inflammation. Lung epithelial cell–derived soluble factors play an important role in regulating ILC2 responses during allergic airway inflammation (Hardman et al., 2013; Yasuda et al., 2012; Schneider et al., 2018; von Moltke et al., 2016). However, the molecular mechanisms underlying the regulation of ILC2s by lung epithelium–derived peptides are only partially understood.
Angiotensin (Ang) II, an effector hormone in the renin–Ang system (RAS), plays a critical role in the maintenance of blood pressure and electrolyte balance (Kumar et al., 2007; Stegbauer et al., 2009). Therapeutic blocking of Ang II and its receptors is a cornerstone in the treatment of hypertension (Christiansen and Zuraw, 2019). Ang II exerts its functions via binding to Ang II receptors, type 1 (AT1) and type 2 (AT2), eliciting a variety of intracellular signaling cascades (Cortez-Retamozo et al., 2013; Shepherd et al., 2018). In addition to systematic production of Ang II, local production of Ang II has been described in a variety of tissues, which contributes to inflammatory responses and tissue homeostasis such as pulmonary arterial hypertension, autoimmune encephalomyelitis, and tumor metastasis (de Man et al., 2012; Shen et al., 2020; Stegbauer et al., 2009). A single-cell sequencing study showed that airway epithelial cells express detectable levels of angiotensinogen (AGT) and Ang-converting enzyme (ACE), the enzymes essential for the production of Ang II, at steady-state (Plasschaert et al., 2018). Modulation of RAS activity affected the severity of airway inflammation, although conflicting results were obtained from different groups (Imai et al., 2005; Ohwada et al., 2007; Tan et al., 2018). Previous cohort studies have shown that patients with asthma displayed a higher incidence of hypertension than nonasthmatic individuals. Meanwhile, patients with hypertension suffer from more severe asthma (Christiansen et al., 2016; Christiansen and Zuraw, 2019; Ferguson et al., 2014). Those studies prompted us to explore the potential role of Ang II in ILC2-driven airway inflammation.
In this study, it was found that Ang II synthesis was clearly induced in lung epithelial cells upon allergen challenge. ILC2s expressed the Ang II receptor AT1a. We demonstrate that Ang II promoted ILC2 responses in a cell-intrinsic and IL-33–dependent manner. Deletion of AT1a or pharmacological inhibition of the Ang II–AT1 axis markedly alleviated allergic airway inflammation. Asthmatic patients displayed higher levels of Ang II in their circulation than healthy individuals, which was positively correlated with ILC2 proportions. These observations provide novel insights into the mechanism of ILC2 regulation during airway inflammation.
Results
Enhanced RAS activity in lung epithelial cells upon allergen exposure
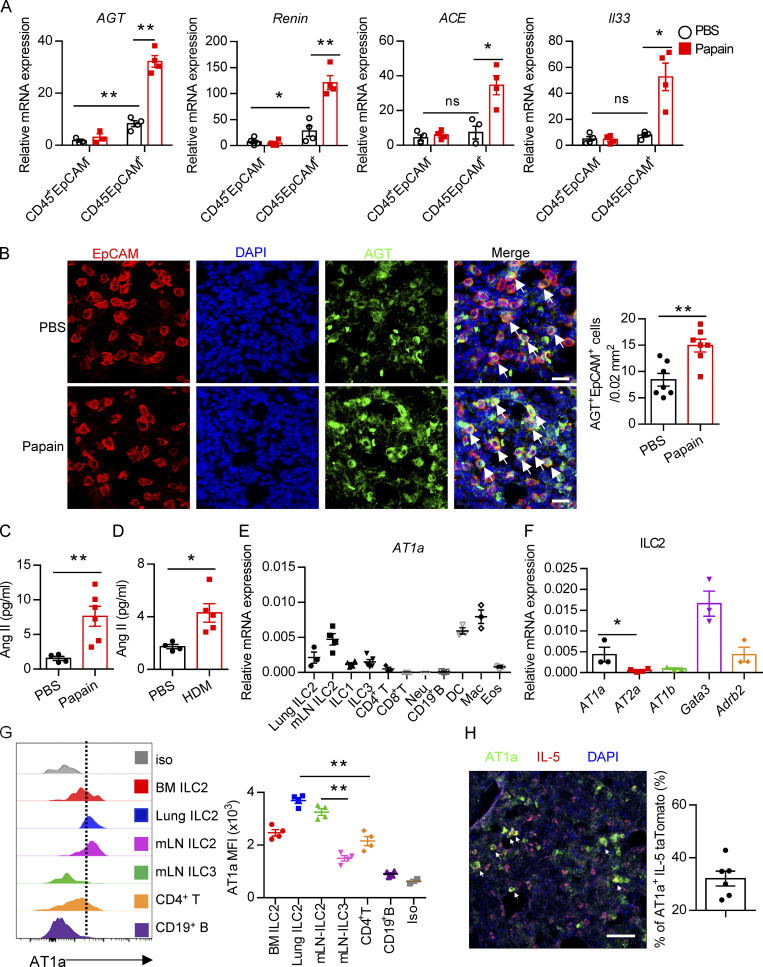
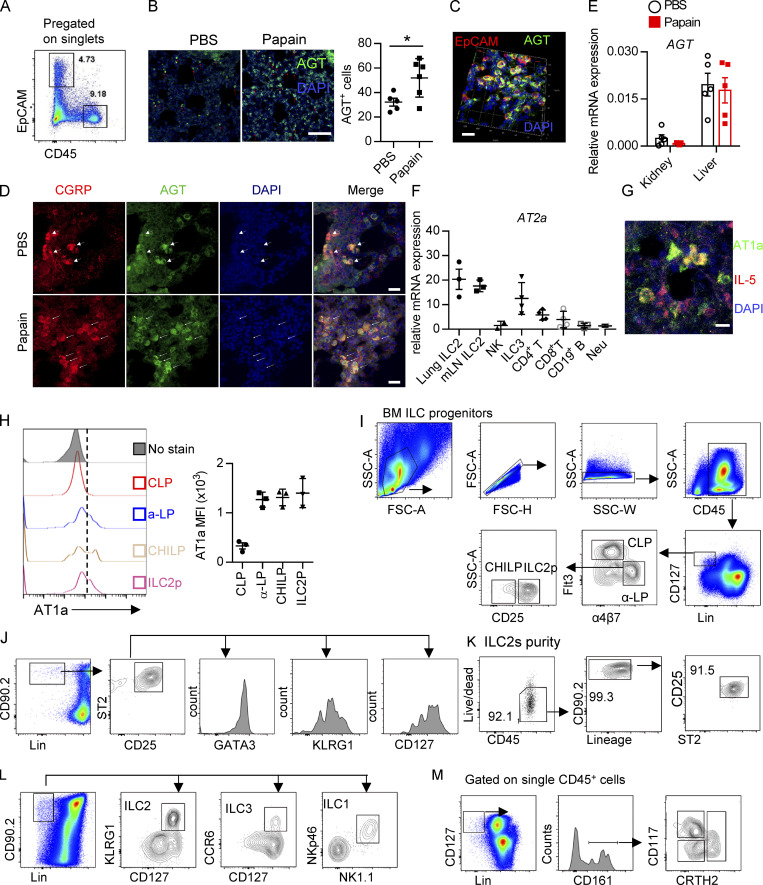
To explore the potential role of Ang II in ILC2 responses, the protease papain was used to induce allergic inflammation (Halim et al., 2018; Lambrecht and Hammad, 2015; Oboki et al., 2010). The expression of key components in the RAS system, including AGT, renin, and ACE, was evaluated in lungs. The results showed that these enzymes were highly expressed in lung epithelial cells (CD45−EpCAM+) as compared with hematopoietic cells (CD45+EpCAM−) under both steady-state (PBS groups) and allergic inflammation (papain groups; Fig. 1 A and Fig. S1 A). Moreover, significant up-regulation of RAS components was observed in lung epithelium upon papain challenge; this was also observed with Il33 (Fig. 1 A). Immunofluorescence (IF) staining revealed an elevation of AGT-positive cells in lungs after allergen challenge (Fig. S1 B). Importantly, we observed a clear colocalization of AGT with epithelial cell adhesion molecule (EpCAM) in lungs, which was significantly increased after papain administration (Fig. 1 B and Fig. S1 C). Pulmonary neuroendocrine cells represent specialized and rare lung epithelial cells and were reported to amplify allergic asthma via regulating ILC2 responses (Branchfield et al., 2016; Sui et al., 2018). Pulmonary neuroendocrine cells (calca-encoding calcitonin gene-related peptide [CGRP]–positive cells) displayed elevated AGT expression under the papain condition as compared with steady-state (Fig. S1 D). No noticeable changes were observed in AGT expression in kidney and liver tissues after papain challenge (Fig. S1 E), which indicated that enhanced RAS activation was specific to lungs in responses to airway inflammation. Furthermore, a significant elevation of Ang II levels in bronchoalveolar lavage fluid (BALF) was observed in asthmatic mice induced by papain or house dust mite (HDM; Fig. 1, C and D). These observations collectively indicated that allergen exposure significantly enhances RAS activity in lung epithelial cells.
Figure 1.
Evaluation of Ang II–AT1a signaling in epithelial cells and ILC2s from lung. (A and B) Naive mice were i.n. administered with papain (20 µg/mouse/d) or PBS for 5 d and sacrificed on day 6. (A) mRNA expression of AGT, Renin, and ACE was measured in lymphocytes (CD45+EpCAM−) and epithelial cells (CD45−EpCAM+) from lungs. Il33 was used as a positive control. (B) IF staining of AGT in the tracheal epithelium from naive mice after papain or PBS challenge (n = 3 or 4). Representative images are shown, with statistical data from three independent experiments. Red, EpCAM; green, AGT; blue, DAPI; scale bar, 20 µm. (C and D) The levels of Ang II in the BALF after papain (C) or HDM (D) challenge; PBS was used as a vehicle control. PBS, n = 4; Papain, n = 6; HDM, n = 5. (E) AT1a expression was measured by qRT-PCR. Mac, macrophages; Neu, neutrophils; DC, dendritic cells; Eos, eosinophils; n = 3 or 4. (F) Expression of distinct Ang II receptors in ILC2s from lung. (G) Flow-cytometric analyses of AT1a expression in distinct ILC subsets; n = 4. (H) IF staining of AT1a in lungs from IL-5–tdTomato–reporter mice under steady-state; tdTomato-positive cells indicate ILC2s; scale bar, 50 µm; n = 3. All data are from two or three independent experiments in all graphical panels; mean ± SEMs are shown in all graphical panels. Two-way ANOVA (A) or the unpaired t test (B–G) was used. *, P < 0.05; **, P < 0.01. BM, bone marrow; iso, isotype; MFI, mean fluorescence intensity.
Figure S1.
Expression of Ang II receptors and gating strategies of distinct cells. (A) Gating strategies of lung EpCAM+ cells and CD45+ immune cells. (B) AGT expression in the homeostasis and papain challenge representative images are from three independent experiments. Scale bars, 100 µm; n = 3/group. (C) Representative three-dimensional images of EpCAM and AGT captured by LSM780. (D) IF staining of AGT, CGRP, and DAPI in lung tissues from naive mice after papain or PBS challenge. Representative images are shown: red, CGRP; green, AGT; blue, DAPI; scale bar, 20 µm. Representative images are two repeated independent experiments; n = 3/group. (E) The AGT mRNA expression in the tissue of liver and kidney tissues during the steady and papain challenge (n = 5). (F) AT2a expression in different immune cells. (G) Representative images of AT1a- and IL-5–positive cells; scale bars, 20 µm. (H) The mean fluorescence intensity (MFI) of AT1a in the bone marrow (BM) precursors CLP, α-lymphoid progenitor (α-LP), common helper-like ILC progenitor (CHILP), and ILC2 precursor. (I–M) The gating strategies of flow cytometry are shown, including bone marrow ILC progenitors (I), lung ILC2s (J), purity test of lung ILC2 (K), mLN ILC subsets (L), including ILC1s, ILC2s, ILC3s, and human peripheral blood ILC1s, ILC2s, and ILCp (M). FSC, forward scatter area; Neu, neutrophil; SSC, side scatter.
ILC2s express the Ang II receptor AT1a
To directly investigate the potential role of Ang II in ILC2s, the expression of Ang II receptors was evaluated in ILC2s and other types of immune cells. The gating strategies of ILC2s, other ILC subsets, and ILC2 progenitors are shown in Fig. S1, I–M, as described previously (Lei et al., 2018; Walker et al., 2015; Yu et al., 2014). Results showed that the expression of Agtr1a (AT1a) in ILC2s, from either lungs or mesenteric LNs (mLNs), was remarkably higher than those in ILC1s, ILC3s, T and B lymphocytes, eosinophils, or neutrophils (Fig. 1 E). The transcript level of AT1a in ILC2 was comparable with dendritic cells (DCs) and macrophages (Fig. 1 E; Cortez-Retamozo et al., 2013). In addition, ILC2s expressed a significantly higher level of AT1a than of AT2a or AT1b; Gata3 and Adrb2 were used as positive controls (Fig. 1 F and Fig. S1 F; Mjösberg et al., 2012; Moriyama et al., 2018). The expression of AT1a in ILC2s was confirmed by flow cytometry (Fig. 1 G). Approximately 30% of IL-5 tdTomato-positive ILC2s expressed AT1a in the lung under steady-state (Fig. 1 H and Fig. S1 G). Distinct ILC2 progenitors, including common lymphoid progenitors (CLPs), α-lymphoid progenitors, common helper-like ILC progenitors, and ILC2 precursors, also expressed detectable levels of AT1a (Fig. S1 H). These observations indicate the possibility that ILC2s are modulated by Ang II–AT1a signaling in the lung.
Ang II enhances ILC2 responses both in vitro and in vivo
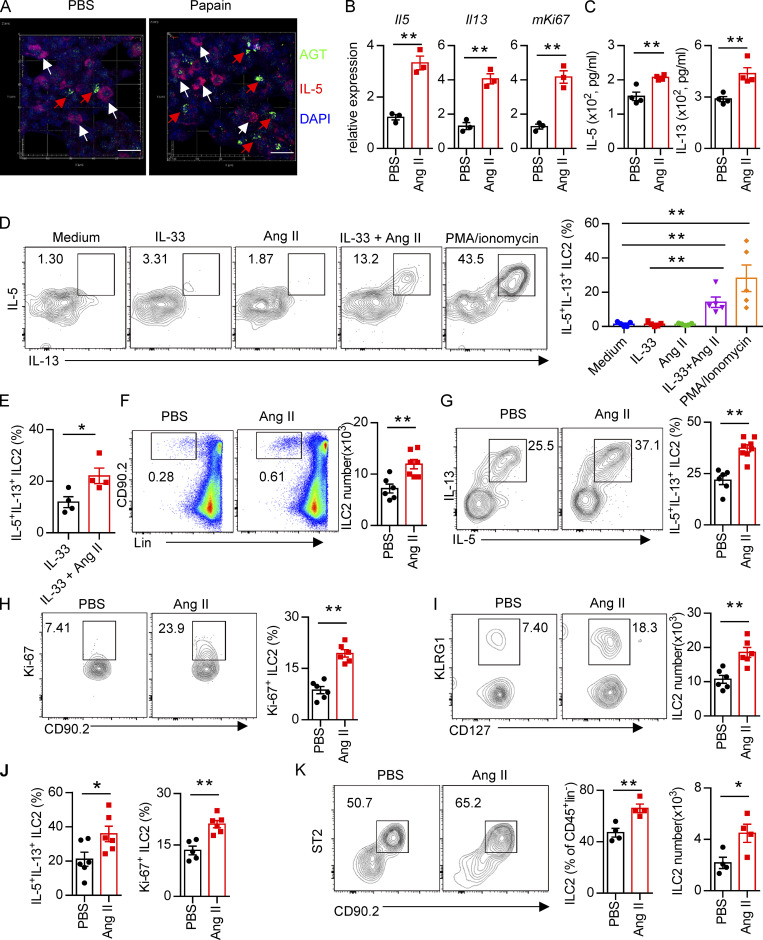
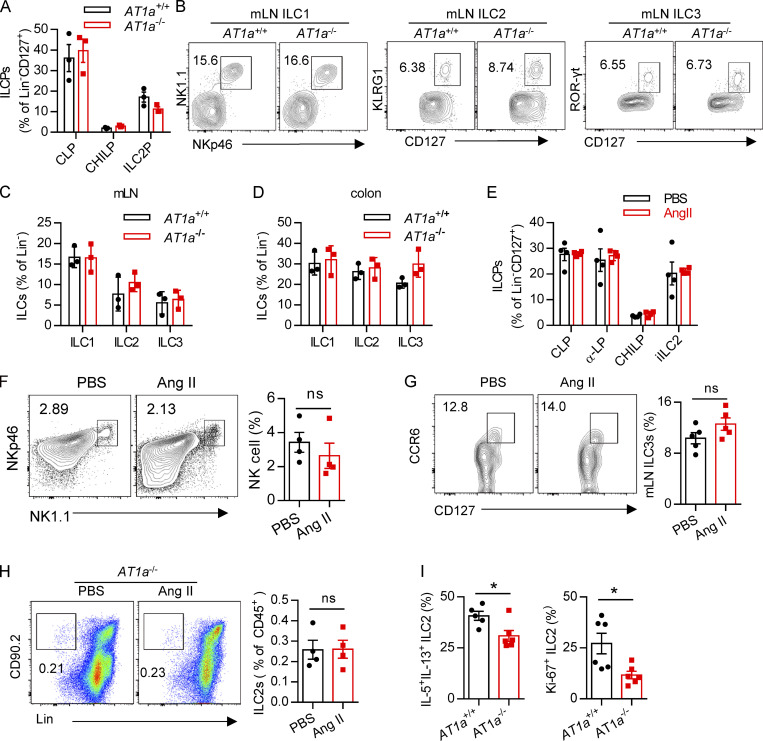
To determine whether there is a physical interaction between AGT+ epithelial cells and ILC2s in lungs, we imaged lungs from PBS- or papain-challenged IL-5 reporter mice in which ILC2s are represented by tdTomato expression (Dahlgren et al., 2019; Nussbaum et al., 2013; Sui et al., 2018). IF staining showed that IL-5+ ILC2s were in close proximity to AGT+ epithelial cells in lungs under both steady-state and allergen challenge conditions (Fig. 2 A). These observations indicated that Ang II–AT1a signaling may mediate the crosstalk between lung epithelium and ILC2 in a paracrine manner. The abundance of ILC2s and their progenitors was next determined by flow cytometry in Agtr1a-deficient (AT1a−/−) mice and WT (AT1a+/+) littermates. Results indicated that AT1a+/+ and AT1a−/− mice displayed comparable levels of ILC2 progenitors in bone marrow (Fig. S2 A). Additionally, no obvious differences were observed in the proportions of ILC2s in lungs (Fig. S4 J and Fig. 5 B), or of ILC1s, ILC2s, and ILC3s in the mLN and colon (Fig. S2, B–D). These results indicate that AT1a deficiency does not affect the development or homeostasis of ILCs under steady-state.
Figure 2.
Administration of Ang II systematically enhances ILC2 responses. (A) Images of lung tissue from IL-5–tdTomato (red) reporter mice stained for AGT (green) and DAPI (blue). White arrows show IL-5+ ILC2s, and red arrows show AGT+ cells; scale bar, 20 µm. Images are from three independent experiments. n = 4/group. (B) Purified lung ILC2s from naive mice were stimulated with Ang II or PBS for 6 h. mRNA expression of Il5, Il13, and Mki67 was determined by qRT-PCR. n = 3/group, and data are repeated from two independent experiments. (C) Lung ILC2s were cultured with Ang II or PBS in the presence of IL-2, IL-7, and IL-33 cytokines for 3 d. The amounts of IL-5 and IL-13 in supernatants were measured by ELISA. N = 4/group, and data are from two independent experiments. (D) mLN lymphocytes were cultured with the indicated treatments for 6 h, and the intracellular cytokines IL-5 and IL-13 from ILC2s were determined by flow cytometry. IL-33: 100 ng/ml; Ang II: 0.5 µM; PMA: 50 ng/ml; ionomycin: 1 µg/ml. n = 3/group, and data are from two independent experiments. (E) Lung ILC2s were stimulated with IL-33 alone or IL-33 plus Ang II for 6 h, and the production of intracellular cytokines was evaluated by flow cytometry. n = 4, and data are from two independent experiments. (F–K) Naive mice were injected i.p. with Ang II (30 µg/mouse, daily) or PBS and sacrificed on day 6. (F–H) Flow-cytometric analysis of ILC2s (CD45+Lin−CD90+) (F), effector cytokines (G), and proliferation (H) from lungs. (I and J) Absolute cell counts of ILC2s (I) and effector cytokines and cell proliferation (J) in mLNs from naive mice treated with Ang II or PBS. (K) Abundance of ILC2s in visceral adipose tissue from naive mice treated with Ang II or PBS. (F–K) Data are from three independent experiments; n = 3 or 4/group. In all graphs, mean ± SEM is shown. Unpaired t test was used. *, P < 0.05; **, P < 0.01. Lin, lineage.
Figure S2.
Immune response of AT1a-deficient mice or Ang II treatment. Related to Fig. 2. (A) Bone marrow ILC progenitors in AT1a−/− and WT (AT1a+/+) littermate controls under steady-state. (B) Representative flow plots of mLN ILC1s, ILC2s, and ILC3s in AT1a−/− and AT1a+/+ controls. (C and D) Abundance of mLN (C) and colon (D) ILC1s, ILC2s, and ILC3s in AT1a−/− and AT1a+/+ controls. Data are from two independent experiments; n = 3/group. (E–G) WT mice were i.p. administered Ang II or PBS daily for 5 d. 24 h later, flow cytometry was used to analyze bone marrow, lung, and mLN. (E) Abundance of ILC progenitors in bone marrow was determined after Ang II and PBS treatment. (F and G) Spleen NK cells and mLN ILC3s were measured by flow cytometry. (H) AT1a−/− mice were i.p. injected with Ang II daily for 5 consecutive days. Lung ILC2s were analyzed by flow cytometry. (I) Intracellular cytokine production of IL-5 and IL-13 by ILC2s and ILC2 proliferation were determined by flow cytometry in AT1a−/− and AT1a+/+ mice after treatment with Ang II for 5 consecutive days. Representative data are from two or three repeated independent experiments; n = 4 or 5/group. Graphical data show mean ± SEM by two-way ANOVA (A and C–E) and unpaired t test (F–I). *, P < 0.05. Lin, lineage; ROR, retinoic acid–related orphan receptor.
Figure S4.
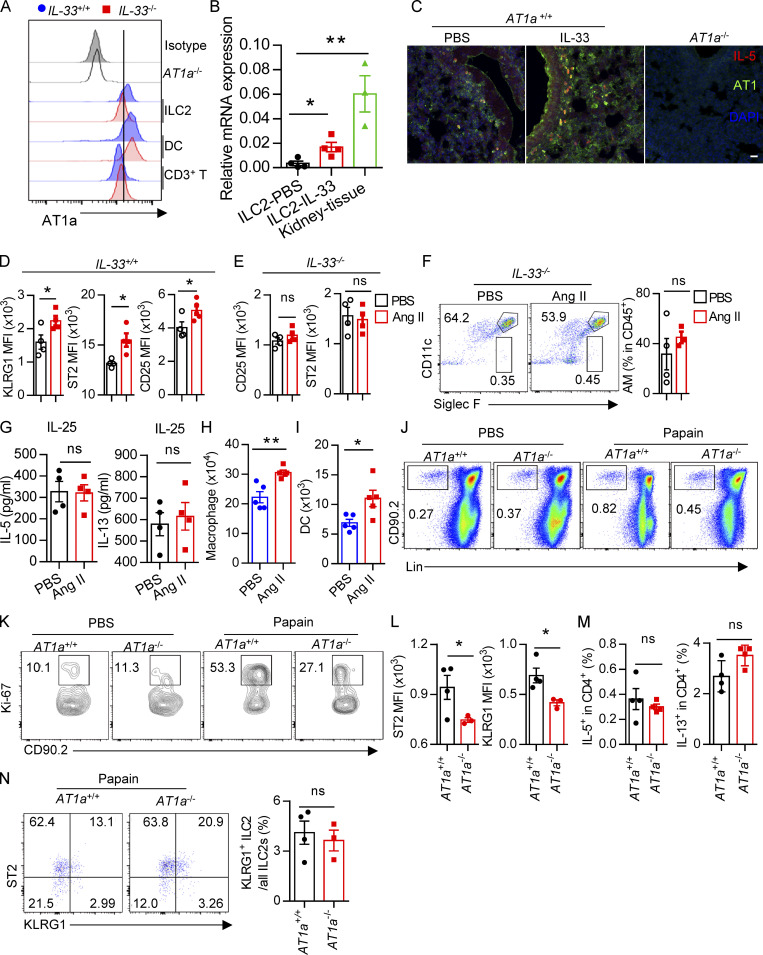
The effect of Ang II on ILC2 is dependent on IL-33, and AT1 deficiency attenuates papain-induced inflammation. (A) The mean fluorescence intensities (MFIs) of AT1a were determined by flow cytometry in IL-33−/− and their littermate controls. Data are from two independent experiments; n = 4/group. (B) AT1a mRNA relative expression was analyzed by qRT-PCR in indicated cells or kidney tissue (n = 4). (C) IF staining of AT1a, DAPI in lung tissues from IL-5–tdTomato mice after PBS or IL-33 challenge. Representative images are shown from three independent experiments. Red, IL-5 tdTomato; green, AT1a; blue, DAPI; scale bar, 20 µm; n = 3/group. Lung tissue from AT1a−/− mice was the negative control. (D–F) IL-33+/+ and IL-33−/− mice were i.n. administered Ang II or PBS daily for 5 d. (D) MFI of KLRG1, ST2, and CD25 was analyzed by flow cytometry in IL-33+/+ mice. (E) MFI of CD25 and ST2 were analyzed by flow cytometry in IL-33−/− mice. (F) Alveolar macrophages (AMs) were determined by flow cytometry. (G) IL-5 and IL-13 concentrations were determined by ELISA after IL-25 and IL-25 plus Ang II treatment in the presence of IL-2 and IL-7 for 3 d. (H and I) Naive mice were i.n. challenged with Ang II and PBS for 5 consecutive days. Flow-cytometric analysis of the proportions and absolute numbers of macrophages (H) and DCs (I) in lungs. (J–N) PBS and papain were i.n. administered daily for 5 consecutive days in AT1a+/+ and AT1a−/− mice and data were analyzed 24 h after the last administration. (J) Flow cytometry plots of ILC2s from lung tissue. (K) Flow plots of lung ILC2 proliferation. (L) MFI of ST2 and KLRG1 on ILC2s. (M) CD4-derived IL-5 and IL-13 were analyzed by flow cytometry in AT1a+/+ and AT1a−/− mice after papain challenge. (N) Ratio of natural and inflammatory ILC2s in AT1a+/+ and AT1a+/+ mice lung tissue after papain challenge. (D–I) Two repeated independent experiments, and J–N are repeated three times. Numbers denote percentage of cells in each gate. Data show mean ± SEM by unpaired t test. *, P < 0.05, **, P < 0.01. Lin, lineage.
Figure 5.
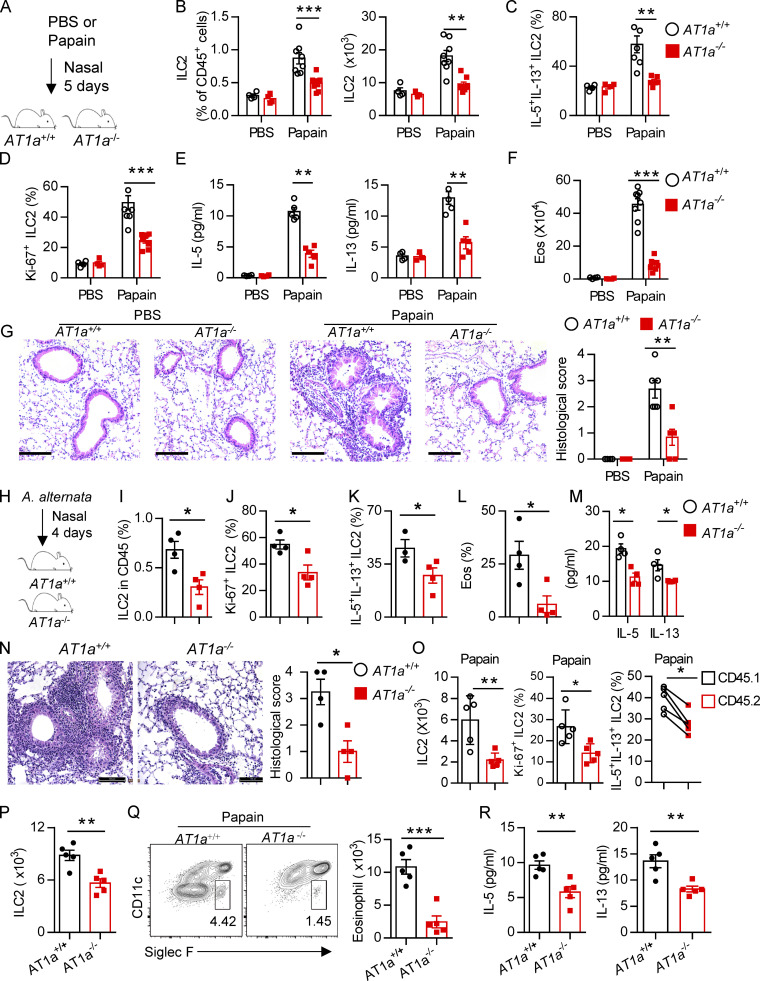
AT1a deficiency attenuates ILC2-induced lung inflammation. (A–G) AT1a+/+ and AT1a−/− mice were i.n. administered papain or PBS daily for 5 d. (A) Experimental procedure. (B–D) Proportions (B), cytokine production (C), and proliferation (D) of ILC2s in lungs were determined by flow cytometry. (E) Concentrations of IL-5 and IL-13 in BALF. (F) Abundance and absolute numbers of eosinophils (Eos) in BALF. (G) H&E staining of lung sections (scale bar, 100 µm). Inflammation was quantitated from all mice analyzed. (H–N) A. alternata was i.n. administered to AT1a+/+ and AT1a−/− mice daily for 4 d. Experimental procedure (H). Percentages of lung ILC2s (I), proliferation of lung ILC2s (J), and abundance of IL-5+IL-13+ ILC2s in lung (K) and of eosinophils in BALF (L) were determined by flow cytometry. (M) Amounts of type 2 cytokines in BALF. (N) H&E staining of lung sections (scale bar, 100 µm). (O) Bone marrow cells from AT1a−/−mice (CD45.2) and AT1a+/+ mice (CD45.1) were mixed at a 1:1 ratio and then transferred into recipient mice. After 4-5 wk reconstitution, the recipients were i.n. challenged with papain for 5 consecutive days. The absolute cell counts, cell proliferation, and effector cytokine production of lung ILC2s from AT1a−/− donors and AT1a+/+ donors are shown. (P–R) Equal number of lung ILC2s (2 × 10⁴) from AT1a−/− and AT1a+/+ littermates were adoptively transferred into immunodeficient NCG mice, followed by i.n. challenge of papain for 5 d. (P) Absolute number of donor-derived ILC2s. (Q) Flow cytometry plots and counts of eosinophils. (R) Concentration of IL-5 and IL-13 in NCG BALF (n = 5). Data are representative of two experiments with similar results (A–G) or from one experiment; n = 4 or 5/group (H–R). Graphical data show mean ± SEM by two-way ANOVA (B–G and M) and unpaired t test (I–R). *, P < 0.05; **, P < 0.01; ***, P < 0.001.
We next investigated whether Ang II–AT1a signaling is dispensable for ILC2 function. First, lung ILC2s from naive mice were cultured in the presence of Ang II in vitro. The transcripts of the effector cytokines Il5, Il13, and Mki67 in ILC2s were profoundly increased by Ang II stimulation (Fig. 2 B). The Ang II–enhanced type 2 cytokine production was further confirmed by ELISA (Fig. 2 C). Combination Ang II with IL-33 significantly enhanced the production of type 2 cytokines after 6-h stimulation of lymphocytes from the mLN (Fig. 2 D). Similar results were obtained when purified lung ILC2s were stimulated by Ang II (Fig. 2 E). Next, Ang II was administered to naive mice by i.p. injection, as a result of which the proportion of ILC2s in the lung was elevated approximately twofold (Fig. 2 F). The production of effector cytokines and proliferation by lung ILC2s was enhanced by Ang II (Fig. 2, G and H). Similar results were observed in ILC2s from the mLN (Fig. 2, I and J) and white adipose tissue (Fig. 2 K). The abundance of ILC2 precursors in bone marrow, however, was not affected (Fig. S2 E). The proportions of spleen NK cells and mLN CCR6+ ILC3s were comparable (Fig. S2, F and G). The effect of Ang II on ILC2s was abrogated in AT1a−/− mice (Fig. S2 H). IL-5 and IL-13 production from lung ILC2s, and ILC2 proliferation, were significantly lower in AT1a−/− mice than in AT1a+/+ controls after Ang II administration (Fig. S2 I). These observations collectively suggested that Ang II enhances ILC2 responses.
Regulation of ILC2s by Ang II is cell intrinsic
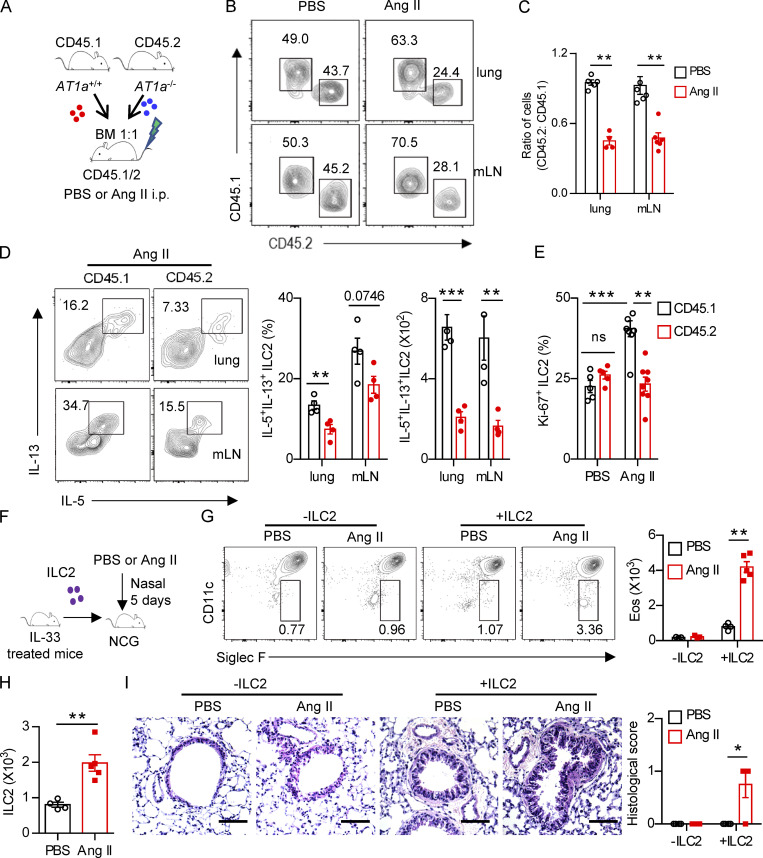
To explore whether the effect of Ang II on ILC2s is cell intrinsic, mixed bone marrow chimeras were performed. Bone marrow cells from AT1a−/− mice (CD45.2) and AT1a+/+ mice (CD45.1) were mixed at a 1:1 ratio and then transferred into recipient mice (CD45.1/CD45.2; Fig. 3 A). Results showed that the ratio of CD45.1+/CD45.2+ cells was ∼1:1 in the peripheral blood of recipients 5 wk later (Fig. S3 A), indicating a comparable bone marrow reconstitution between AT1a−/− and AT1a+/+ donor mice. The proportion of ILC2s derived from AT1a−/− donors was significantly lower than that from AT1a+/+ donors after Ang II challenge in both the lung and the mLN (Fig. 3 B). No differences were observed between PBS groups (Fig. 3 B). Consistent with this, the production of effector cytokines IL-5 and IL-13 by ILC2s, as well as cell proliferation, was compromised in ILC2s derived from AT1a−/− donors as compared with AT1a+/+ donors after Ang II administration (Fig. 3, C–E). In sharp contrast, cytokine production by Th2 cells was not affected (Fig. S3 B). In addition, the reconstitution of CD19+ B lymphocytes, CD3+ T cells, and myeloid cells was comparable (Fig. S3, C and D).
Figure 3.
Regulation of ILC2 by Ang II is cell intrinsic. (A–E) Mixed bone marrow (BM) chimeras were established by transplantation of BM cells from AT1a+/+(CD45.1) and AT1a−/−(CD45.2) mice at 1:1 into irradiated recipient mice (CD45.1/45.2); the recipients were i.p. injected with Ang II or PBS after 6 wk reconstitution. (A) The experimental strategy of mixed BM chimeras. (B and C) The ratio of ILC2s derived from AT1a−/− and AT1a+/+ donor mice (CD45.2: CD45.1) in the lung or mLN. (D) Effector cytokine production of ILC2s derived from donor mice (pregated on CD45.1+ or CD45.2+ cells). ILC2s from lung or mLN were analyzed by flow cytometry after stimulation with PMA, BFA, and ionomycin for 4 h. (E) Proliferation of ILC2s derived from donor mice (pregated on CD45.1+ or CD45.2+ cells). (F–I) Adoptive transfer of ILC2s into NCG mice. Lung ILC2s (2 × 10⁴) from naive mice were injected intravenously into NCG recipients, followed by i.n. administrated with Ang II or PBS for 5 d. NCG mice without ILC2s transfer were used as controls. (F) The experimental strategy of ILC2 transfer. (G) Abundance of eosinophils in BALF of recipients. (H) Absolute counts of lung ILC2s from recipients upon ILC2 transfer and Ang II injection. (I) H&E staining of lung tissues of recipients (scale bar, 100 µm). In all graphs, mean ± SEM is shown. Data are from two independent experiments; n = 4 or 5/group. Two-way ANOVA (C–E, G, and I) or unpaired t test (H) was used. *, P < 0.05; **, P < 0.01; ***, P < 0.001. Eos, eosinophil.
Figure S3.
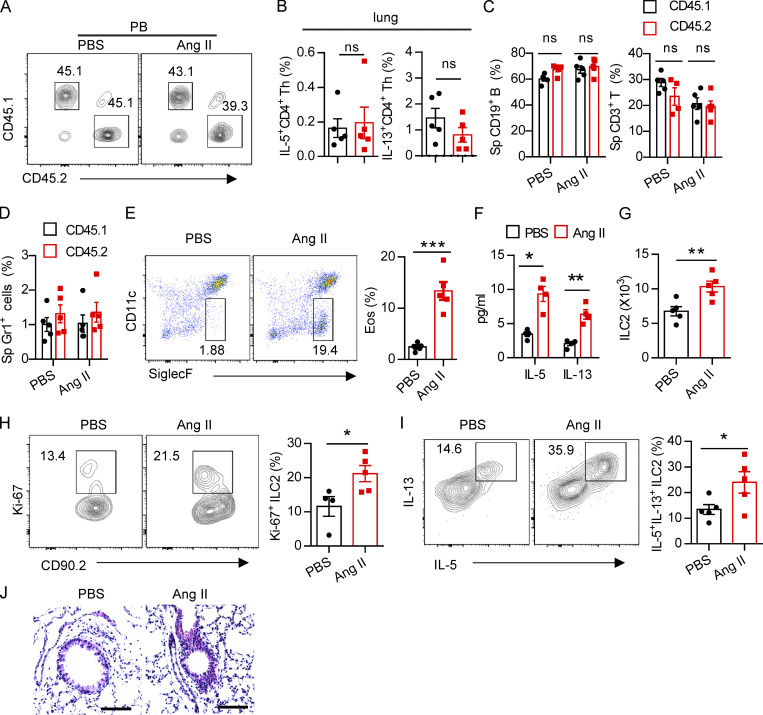
Regulation of ILC2s by Ang II is T cell independent. (A) Ratio of peripheral blood immune cells from CD45.1 (AT1a+/+) and CD45.2 (AT1a−/−) mice was determined by flow cytometry after bone marrow reconstruction for 5 wk in recipient mice. (B) Percentages of donor lung CD4-derived type 2 cytokines in recipient mice. (C and D) Abundance of spleen CD19+ B, CD3+ T (C), and Gr1+ cells (D) from CD45.1 (AT1a+/+) and CD45.2 (AT1a−/−) mice upon Ang II or PBS administration is shown. (E–J) PBS or Ang II was i.n. administered daily for 5 consecutive days in Rag1−/− mice. (E) Flow cytometry of CD45+SiglecF+CD11c− eosinophils in BALF. (F) Concentration of IL-5 and IL-13 in BALF. (G) The absolute number of lung ILC2s, (H) the proliferation of lung ILC2s, and (I) cytokine production of lung ILC2s upon Ang II treatment. (J) Lung sections of control and Ang II–treated mice were stained with H&E. Data are two repeated independent experiments. (A–D) n = 5/group. (E–J) n = 4 or 5 /group. Scale bar, 100 μm. Graphical data show mean ± SEM by two-way ANOVA (B–D and F) and unpaired t test (E and G–I). *, P < 0.05; **, P < 0.01; ***, P < 0.001. Eos, eosinophil, Sp, spleen.
To exclude the potential effect of adaptive lymphocytes (Gurram and Zhu, 2019), Rag-1−/− mice were i.n. challenged with Ang II for 5 d. We found that Ang II promoted the infiltration of eosinophils and the elevation of type 2 effector cytokines in BALF (Fig. S3, E and F). The absolute cell numbers of ILC2s in the lung (Fig. S3 G), their proliferation (Fig. S3 H), and the production of effector cytokines (Fig. S3 I) were correspondingly elevated by Ang II. Histological staining confirmed that airway inflammation was slightly aggravated by Ang II (Fig. S3 J). These results indicate that the effect of Ang II on ILC2 is independent of T and B lymphocytes.
For further confirmation, adoptive transfer of ILC2s into NCG (immunodeficient nonobese diabetic–Prkdcem26Cd22Il-2rgem26Cd22/Nju) mice, which lack T cells, B cells, NK cells, and ILCs, was performed. To obtain sufficient numbers of ILC2s, naive mice were treated with IL-33 to expand ILC2s in vivo. ILC2s (2 × 10⁴) from the lung were adoptively transferred into NCG mice (Lei et al., 2018), followed by i.n. challenge with Ang II (Fig. 3 F). Ang II induced a substantial infiltration of eosinophils when compared with PBS after ILC2 transfer (Fig. 3 G). The numbers of ILC2s were increased approximately twofold by Ang II administration (Fig. 3 H). Ang II–induced ILC2 activation was further evidenced by airway inflammation (Fig. 3 I). These results demonstrated that the effect of Ang II on ILC2 is in a cell-intrinsic manner.
Regulation of ILC2 function by Ang II is dependent on IL-33
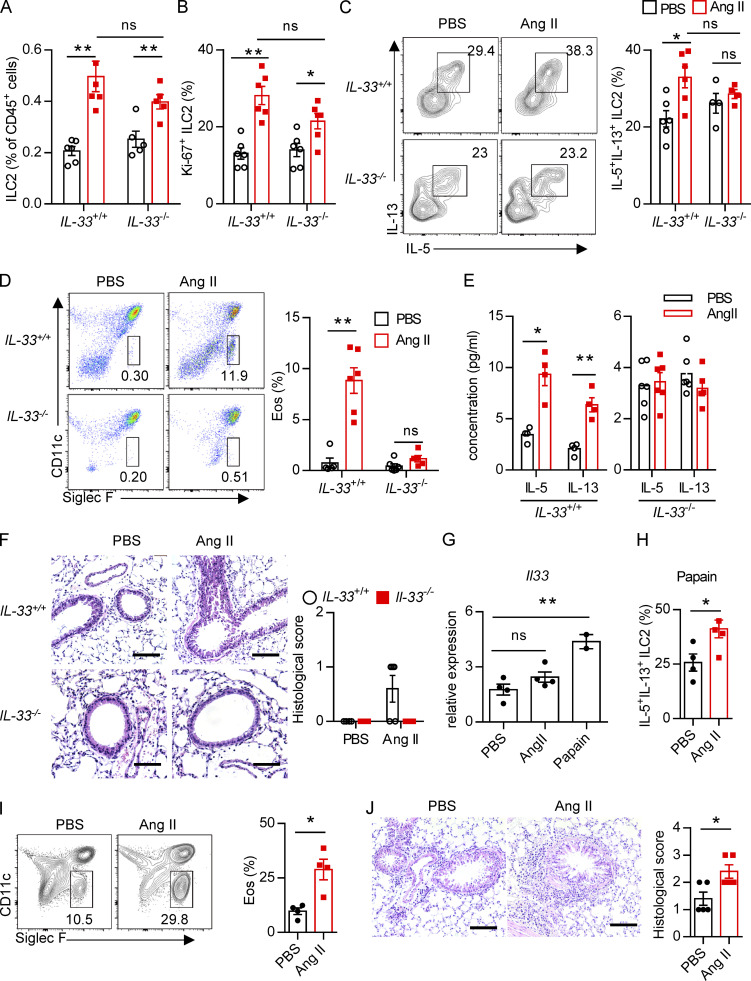
Upon allergen exposure, lung epithelial cells release alarmins including IL-33, IL-25, and thymic stromal lymphopoietin, resulting in the activation of tissue-resident ILC2s in the lung. IL-33 is known to play a dominant role in this process (Dahlgren et al., 2019; Hardman et al., 2013; Oboki et al., 2010). The potential effect of IL-33 on AT1a expression on ILC2s was investigated. Flow-cytometric analysis showed that the expression of AT1a on ILC2s, not DCs or T lymphocytes, was significantly lower in IL-33−/− mice as compared with IL-33+/+ controls (Fig. S4 A). Consistently, IL-33 stimulation clearly up-regulated AT1a expression on ILC2s (Fig. S4, B and C). These data suggest that IL-33 induced AT1a expression on ILC2s. We next asked whether the effect of Ang II on ILC2s is dependent on IL-33. IL-33+/+ and IL-33−/− mice were i.n. administered Ang II or PBS for 5 d. Results showed that Ang II induced a significant elevation of lung ILC2s and enhanced their proliferation (Fig. 4, A and B). However, intracellular cytokine production by lung ILC2s was significantly enhanced by Ang II in IL-33+/+ mice, but was unperturbed in IL-33−/− mice (Fig. 4 C). Activation markers for ILC2s, including KLRG1, ST2, and CD25, were induced by Ang II in IL-33+/+ mice, but not in IL-33−/− mice (Fig. S4, D and E). This abrogated ILC2 activation led to less infiltration by eosinophils and macrophages (Fig. 4 D and Fig. S4 F), as well as decreased type 2 cytokines (Fig. 4 E) in BALF from IL-33−/− mice after Ang II challenge. The airway inflammation was further confirmed by H&E staining and histological scoring (Fig. 4 F). Importantly, Ang II did not affect the expression Il33 in lung epithelial cells (Fig. 4 G). As expected, Ang II enhanced ILC2 responses in the lung (Fig. 4 H), which resulted in aggravated inflammation after papain challenge (Fig. 4, I and J). However, combination of Ang II and IL-25 did not further induce the cytokine production by ILC2s in vitro (Fig. S4 G). These results indicate that the enhanced ILC2 function by Ang II is dependent on IL-33.
Figure 4.
The effect of Ang II on ILC2s is dependent on IL-33. (A–F) IL-33+/+ and IL-33−/− mice were i.n. administered Ang II or PBS daily for 5 d. Proportions of lung ILC2s in CD45+ cells (A), ILC2 proliferation (B), and cytokine production of lung ILC2s (C) were determined by flow cytometry. (D) Percentages of eosinophils in BALF. (E) Concentration of type 2 cytokines in BALF. (F) H&E staining of lung tissues and quantitated histological scoring. (G) Expression of Il33 in lung epithelial cells after Ang II or papain challenge. (H–J) Naive mice were i.p. injected with PBS or Ang II (40 µg/d/mouse) after papain (10 µg/d/mouse) challenge. (H) Intracellular cytokine production by lung ILC2s. (I) Percentages of eosinophils. (J) H&E staining of lung sections and quantitated histological scoring (scale bar, 100 µm). All data are from two or three independent experiments. n = 4 or 5/group. Graphical data show mean ± SE, by two-way ANOVA (B–F) and unpaired t test (I–K). *, P < 0.05; **, P < 0.01. Eos, eosinophil.
Distinct types of immune cells contribute to type 2 airway inflammation, and Ang II displayed broad immunoregulatory effects on immune cells (Benigni et al., 2010). In addition to the enhanced ILC2 responses, it was found that i.n. administration of Ang II also caused the elevation of DCs and macrophages in lung compartments (Fig. S4, H and I). The complicated role of Ang II in airway inflammation remains to be fully understood.
AT1a deficiency attenuates ILC2-induced airway inflammation
We next investigated whether Ang II–AT1a signaling affects the severity of ILC2-induced allergic airway inflammation. AT1a+/+ and AT1a−/− mice were challenged with papain to induce allergic airway inflammation (Fig. 5 A). Papain induced a potent activation of lung ILC2s in AT1a+/+ mice, including a higher abundance of ILC2s in the lung (Fig. 5 B and Fig. S4 J), as well as enhanced production of type 2 effector cytokines (Fig. 5 C) and increased ILC2 proliferation (Fig. 5 D and Fig. S4 K). However, these changes were almost completely abrogated in AT1a−/− mice (Fig. 5, B–D; and Fig. S4, J and K). In addition, the surface markers ST2 and KLRG1 in lung ILC2s were moderately down-regulated in AT1a−/− mice compared with AT1a+/+ mice after papain exposure (Fig. S4 L). In contrast with the changes in ILC2 responses, CD4-derived cytokines displayed no noticeable differences (Fig. S4 M). As consequences of the diminished ILC2 responses, the amounts of IL-13 and IL-5 proteins in BALF (Fig. 5 E), and the infiltration by eosinophils in BALF (Fig. 5 F), were dramatically reduced in papain-challenged AT1a−/− mice relative to AT1a+/+ controls. Notably, the proportion of inflammatory ILC2s was comparable between AT1a+/+ and AT1a−/− mice (Fig. S4 N). H&E staining confirmed the alleviation of lung inflammation in AT1a−/− mice, as indicated by the lower infiltration of immune cells into the perivascular and peribronchial spaces (Fig. 5 G).
Additionally, i.n. administration of a fungal allergen extract of Alternaria alternata was used to induce airway inflammation (Fig. 5 H). In agreement with the papain model, AT1a−/− mice displayed significantly impaired ILC2 responses (Fig. 5 I–K) and a resultant remission of airway inflammation (Fig. 5, L–N) when compared with AT1a+/+ littermate controls. Taken together, these results suggest that AT1a mediates the effects of Ang II on ILC2-induced allergic airway inflammation.
Furthermore, we performed papain challenge after mixed bone marrow chimeras. Similar results were observed under inflammatory conditions (Fig. 5 O). Next, adoptive transfer of ILC2s from AT1a−/− mice (CD45.2) and AT1a+/+ mice (CD45.1) into NCG mice was performed, followed by papain administration. Results showed that ILC2s from AT1a−/− donor mice displayed impaired capability to induce airway inflammation as compared with AT1a+/+ littermate controls (Fig. 5, P–R). These data further indicated that the effect of Ang II–AT1 signaling on ILC2s is cell intrinsic under inflammatory conditions.
Inhibition of Ang II alleviates allergic lung inflammation
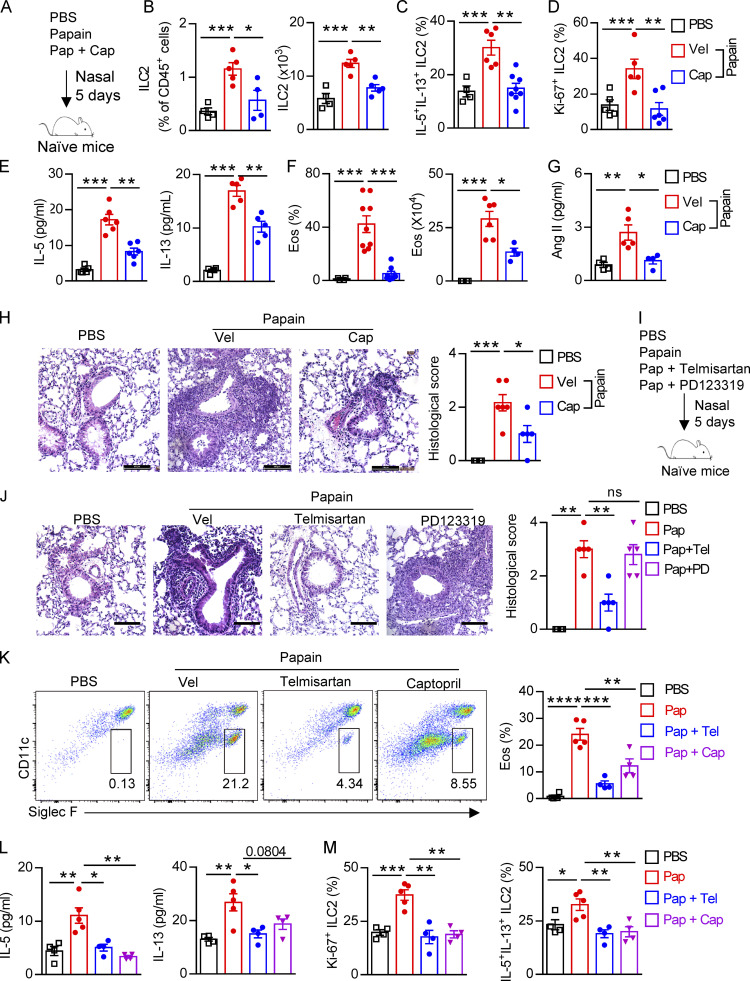
Considering the broad application of RAS targeting therapy in clinical situations such as hypertension and other cardiovascular disorders, we next sought to investigate whether inhibiting Ang II–AT1a signaling affects ILC2-driven airway inflammation. Captopril, an inhibitor of ACE, was used to block the synthesis of Ang II in the papain model (Benigni et al., 2010; Fig. 6 A). Captopril significantly impaired ILC2 responses in lung ILC2s after papain administration (Fig. 6, B–D). The impaired ILC2 responses in the presence of captopril led to a remission of airway inflammation, as represented by the reduced levels of type 2 cytokines in BALF (Fig. 6 E), and lower infiltration of eosinophils in BALF (Fig. 6 F). The alleviation of airway inflammation by captopril was further evidenced by histological staining (Fig. 6 H). Moreover, the papain-induced elevation of Ang II in the lung was decreased after coadministration of captopril (Fig. 6 G).
Figure 6.
Inhibition of Ang II synthesis ameliorates allergic inflammation. (A–H) Naive mice were i.n. challenged with papain (Pap, 20 µg/d), followed by daily i.p. injection with captopril (Cap, 10 mg/kg) or vehicle solution for 5 d; PBS was used as control. (A) Experimental strategy. (B–D) Abundance and absolute numbers (B), cytokine production (C), and proliferation (D) of ILC2s in lung were determined by flow cytometry. (E) Concentration of IL-5 and IL-13 in BALF. (F) Abundance and counts of eosinophils (Eos). (G) Concentration of Ang II in BALF. (H) H&E staining and quantitated histological scoring (scale bar, 100 µm). (I and J) Naive mice were i.p. injected with telmisartan (Tel; 10 mg/kg), PD123319 (PD; 10 mg/kg), or PBS after papain administration. (I) Experimental strategy. (J) Representative H&E staining of lung sections (scale bar, 100 µm). (K–M) Naive mice i.n. administered telmisartan and captopril after papain challenge 1 h. (K) Flow plots and abundances of eosinophils. (L) IL-5 and IL-13 concentration in BALF. (M) Proliferation and cytokine production of ILC2s. All data are representative of two independent experiments; n = 4 or 5/group. Graphical data show mean ± SEM; unpaired t test. *, P < 0.05; **, P < 0.01; ***, P < 0.001; ****, P < 0.0001. Vel, vehicle.
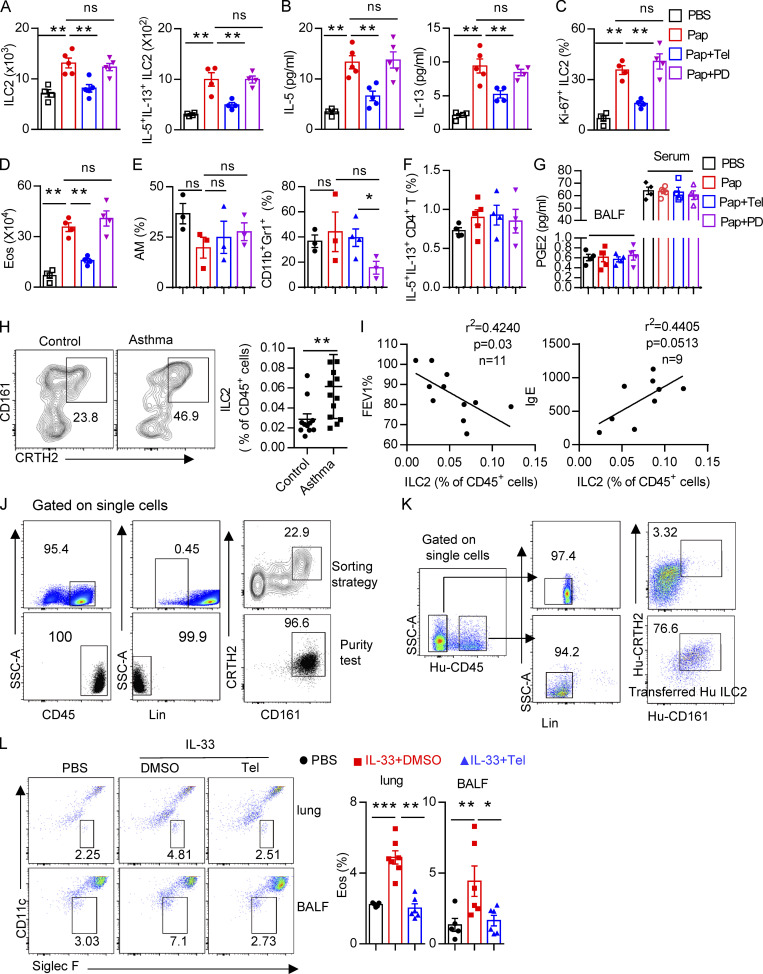
Next, naive mice were treated i.p. with the AT1a inhibitor telmisartan to block the biological function of Ang II (Abdel-Fattah et al., 2015; Benigni et al., 2010). PD123319, a specific inhibitor of the AT2 receptor (Izu et al., 2009), was used in parallel (Fig. 6 I). We found that ILC2 responses in the lung were dramatically diminished by administration of telmisartan, but not PD123319 (Fig. S5, A–C). The decreased infiltration of eosinophils (Fig. S5 D), and macrophages and myeloid cells (Fig. S5 E) in BALF, as well as the results of histological scoring (Fig. 6 J), further indicated the alleviation of lung inflammation by telmisartan. However, PD123319 had no noticeable effects on airway inflammation (Fig. S5, A–E), which was consistent with a previous report (Abdel-Fattah et al., 2015). These results indicate that pharmaceutical inhibition of Ang II–AT1 signaling shows therapeutic value in treating airway inflammation.
Figure S5.
Blocking RAS alleviates papain induced lung inflammation. (A–G) WT mice were i.p. injected with vehicle, telmisartan (Tel), or PD123319 (PD), and then challenged i.n. with papain (Pap) daily for 5 d. 1 d later, lung ILC2s and ILC2-derived IL-5 and IL-13 were analyzed by flow cytometry (A), and BALF IL-5 and IL-13 concentrations were measured by ELISA (B). (C) Ki67+ ILC2s were determined by flow cytometry. (D) Absolute numbers of eosinophils in BALF were analyzed by flow cytometry. (E) Percentage of alveolar macrophages (AMs) and neutrophils in BALF under the indicated conditions. (F) Proportions of CD4+ T cell–derived IL-5 and IL-13 are shown. (G) The PGE2 concentration in lung BALF and serum in indicated conditions. (H) Representative flow cytometry of peripheral blood ILC2s in healthy control and asthmatic children. (I) Clinical association between ILC2s percentages and FEV1% (left) and IgE level (right) in asthmatic children. (J) Sorting strategies and purity test of human ILC2s before adoptive transfer into NCG recipient mice. (K) Representative flow plots of anti-Hu-CD45+ cells and anti-Hu-CD45− cells in the recipient NCG mice. (L) Representative flow plots of eosinophils in BALF and lung tissues of humanized mice. Data are repeated two or three independent times; n = 4/group. Data show mean ± SEM by unpaired t test. *, P < 0.05; **, P < 0.01; ***, P < 0.001. Eos, eosinophils; SSC-A, side scatter area.
To further confirm whether blocking lung local RAS activation inhibits papain-induced allergic inflammation, naive mice i.n. administrated with telmisartan and captopril could during papain challenge. Telmisartan and captopril both inhibit papain-induced ILC2 responses (Fig. 6, K–M). No effects were observed in the function of CD4+ T cells (Fig. S5 F). To exclude the potential off-target effects of telmisartan and captopril on prostaglandin production, known modulators of ILC2 function (Konya and Mjösberg, 2016), no differences of PGE2 were observed among different groups (Fig. S5 G). These data suggest that pharmaceutical blocking local RAS causes the alleviation of airway inflammation.
Mechanism underlying the effect of Ang II on ILC2s
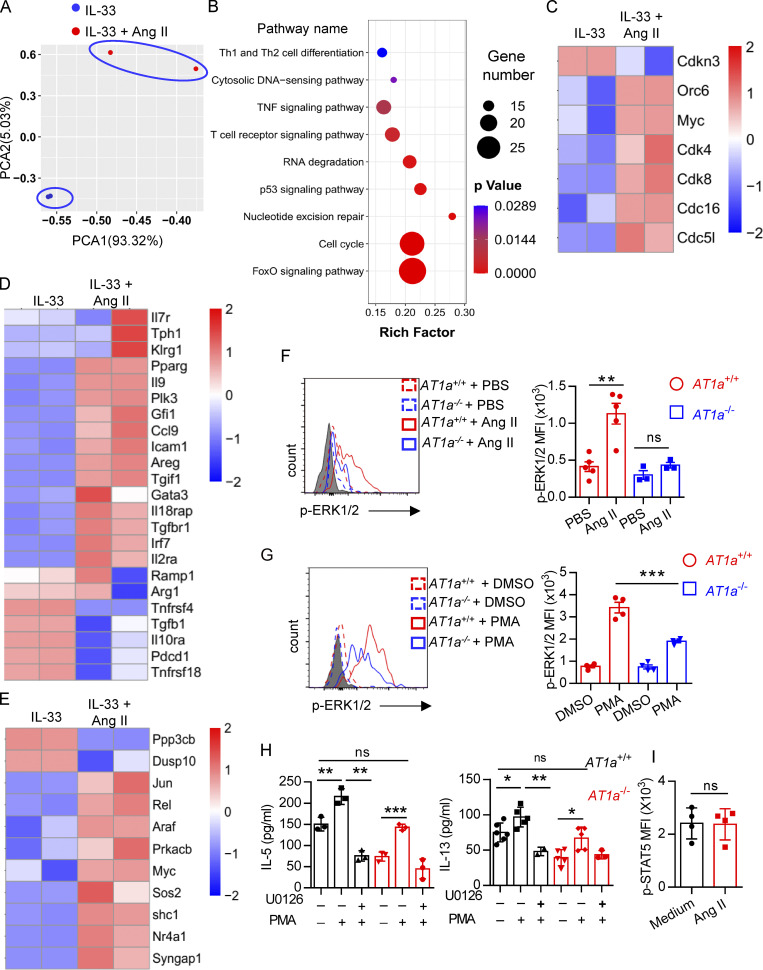
To explore the mechanism underlying the regulation of ILC2s by Ang II, lung ILC2s were sorted and cultured in medium containing IL-33 in the presence or absence of Ang II for 6 h, and then transcriptional profiling was evaluated by SMART-seq2 (Picelli et al., 2013). This showed that the transcripts of ILC2s treated with IL-33 alone and IL-33 plus Ang II clustered separately (Fig. 7 A). Gene ontology and Kyoto Encyclopedia of Genes and Genomes enrichment analysis indicated that Ang II up-regulated cellular processes related to cell cycle (Fig. 7 B). The expression of cell cycle–positive regulators, including Cdk4, Cdk8, Cdc51, Cdc16, Orc6, and Myc, was remarkably up-regulated by Ang II, whereas Cdkn3, a negative cell cycle regulator, was down-regulated (Fig. 7 C). This concurs with the higher proliferation of ILC2s in response to Ang II (Fig. 2 and Fig. 3). Notably, some known ILC2-positive regulators, such as Areg, Il9, Icam1, Pparg, Irf7, Gfi1, Ccl9, and Il2ra, were up-regulated by Ang II, whereas several negative regulators of ILC2, including Pdcd1, Tnfrsf4, Tnfrsf18, and Tgfb1, were down-regulated by Ang II (Fig. 7 D; He et al., 2019; Lei et al., 2018; Wallrapp et al., 2019; Xiao et al., 2021). Interestingly, genes enriched in Ras–ERK signaling (e.g., Araf, Rel, Prkacb, and Shc1) and MAPK signaling (Jun, Nr4a1, Araf, Myc, Ppp3cb, and Dusp10) also displayed clear changes in response to Ang II administration (Fig. 7 E).
Figure 7.
Changes in transcriptional profiling and up-regulation of ERK1/2 signaling are associated with the effect of Ang II on ILC2s. (A–E) Lung ILC2s were cultured with IL-33 or IL-33 plus Ang II for 6 h, and transcriptional profiling was evaluated by SMART-seq2. (A) Principal components analysis (PCA). (B) Kyoto Encyclopedia of Genes and Genomes analysis. (C) Heatmap of expression of selected genes related to the cell cycle. (D) Heatmap of known ILC2 regulators. (E) Heatmap of selected genes of Ras and MAPK signaling pathways. (F and G) Levels of Erk1/2 phosphorylation (p-ERK1/2) in lung ILC2s from AT1a+/+ and AT1a−/− mice were determined by flow cytometry after stimulation with Ang II or PBS (F), or PMA or DMSO (G), for 15 min. (H) Amounts of IL-5 and IL-13 in culture supernatants of ILC2s from AT1a+/+ and AT1a−/− mice were determined by ELISA, after treatment with PMA and/or U0126 for 72 h. (I) Mean fluorescence intensity (MFI) of p-STAT5 in lung ILC2s from AT1a+/+ and AT1a−/− mice after stimulation with PBS or Ang II for 15 min. Data are representative of two independent experiments. Graphical data show mean ± SEM; unpaired t test. *, P < 0.05; **, P < 0.01; ***, P < 0.001.
The binding of Ang II with AT1a induces a variety of intracellular signaling events, including phosphorylation of ERK1/2 (p-ERK1/2; Liao et al., 1997; Shenoy and Lefkowitz, 2005). Flow-cytometric analysis showed that p-ERK1/2 in ILC2s was clearly induced by Ang II in AT1a+/+ mice, which was completely abrogated in AT1a−/− mice (Fig. 7 F). Furthermore, the induced p-ERK1/2 elevation by PMA was clearly diminished in ILC2s from AT1a−/− mice as compared with AT1a+/+ mice (Fig. 7 G). Pretreatment with U0126, a specific p-ERK1/2 inhibitor, abolished PMA-induced ILC2 activation, as indicated by the production of effector cytokines IL-5 and IL-13 (Fig. 7 H). In contrast with the changes of p-ERK1/2, the phosphorylation of STAT5, an alternative signaling molecule downstream of the Ang II–AT1 axis, failed to induce any changes in response to Ang II (Fig. 7 I). Collectively, these results suggested that p-ERK1/2 signaling mediates the effect of Ang II on ILC2s.
Clinical relevance of Ang II–induced ILC2 responses
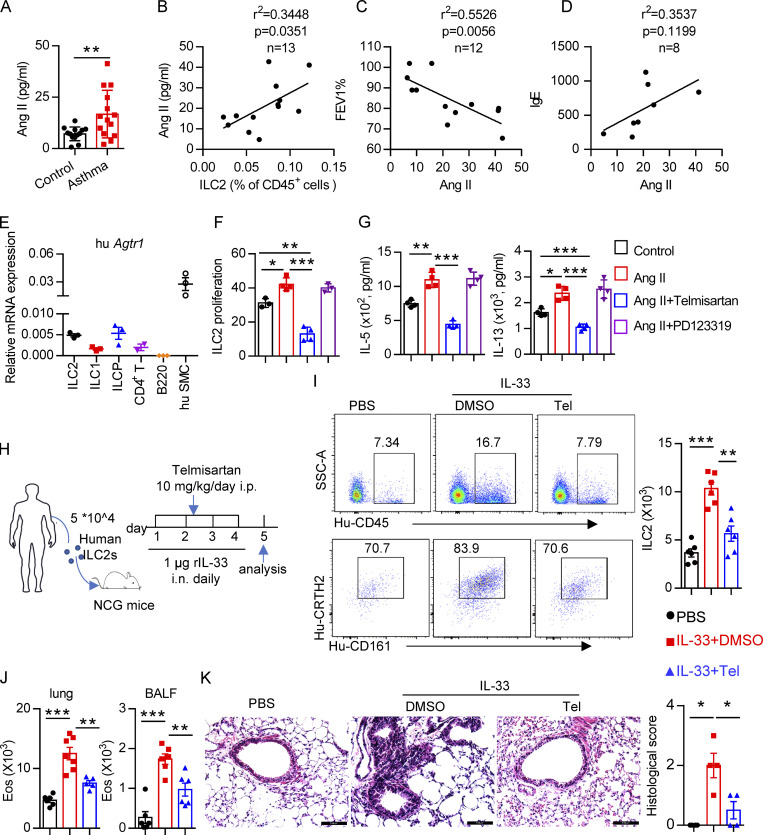
Based on the effects of the Ang II–AT1a axis on ILC2 responses and airway inflammation, we next evaluated its human relevance in asthmatic patients. As expected, asthmatic patients displayed higher levels of circulating ILC2s than healthy controls (Fig. S5 H). A similar change was observed for plasma Ang II (Fig. 8 A), which was consistent with a previous report (Ayada et al., 2015). Importantly, there was a significant positive correlation between plasma Ang II and ILC2 proportion in asthmatic patients (Fig. 8 B). The levels of plasma Ang II were associated with disease index FEV1% (forced expiratory volume in one second), as well as plasma IgE concentration, in asthmatic patients (Fig. 8, C and D). ILC2 abundance also correlated with FEV1% and IgE levels in asthmatic patients, as expected (Fig. S5 I). In agreement with the observations from mice, human ILC2s expressed a higher level of AT1a when compared with other types of immune cells. Human smooth muscle cells were used as positive control (Fig. 8 E); Ang II increased the proliferation of human ILC2s and enhanced their production of effector cytokines, whereas coadministration of telmisartan completely abrogated these effects (Fig. 8, F and G).
Figure 8.
Clinical relevance of Ang II in patients with asthma. (A) Plasma Ang II in healthy controls and asthmatic patients; control, n = 13; asthma, n = 14. (B–D) Correlation between Ang II concentration and the percentage of circulating ILC2s, n = 13 (B), FEV1%, n = 12 (C), and IgE, n = 8 (D), in asthmatic patients. (E) mRNA expression of AT1a in the indicated immune cells from PBMCs of healthy volunteers. n = 3/group, and data are repeated two times. (F and G) Purified human ILC2s were cultured in medium containing 20 ng/ml IL-2, IL-7, and IL-33 for 3 d, in the presence of the indicated treatments including Ang II, Ang II plus telmisartan, and Ang II plus PD123319. Proliferation of ILC2s was determined by CFSE staining (F) and amount of IL-5 and IL-13 in culture supernatants (G). Data are from two independent experiments; n = 4/group. (H–K) Human ILC2s (5 × 10⁴) were intravenously transferred into NCG mice, followed by i.n. challenge with rh-IL-33 (1 µg/d) or PBS. Recipient mice were i.p. administered telmisartan or DMSO for 4 consecutive days. Mice were sacrificed 24 h after the last challenge. (H) Experimental strategy. (I) Proportions and absolute numbers of human ILC2s in lung. (J) Absolute cell counts of eosinophils in lung and BALF of recipients. (K) H&E staining of lung sections and quantitated histological scoring (scale bar, 100 µm). (H–K) Data are representative of two independent experiments; n = 3 or 4/group. Graphical data show mean ± SEM; unpaired t test. *, P < 0.05; **, P < 0.01; ***, P < 0.001. Eos, eosinophil; hu SMC, human smooth muscle cell; SSC-A, side scatter area; Tel, telmisartan.
To further investigate the effect of Ang II–AT1 signaling on human ILC2s in vivo, humanized mice were used (Fig. 8 H). Purified human ILC2s (Fig. S5 J) were adoptively transferred into immunodeficient NCG mice, followed by treatment with recombinant human IL-33 to induce airway inflammation in the presence or absence of telmisartan (Helou et al., 2020; Maazi et al., 2015). The purity of human ILC2s before and after transfer is indicated in Fig. S5, J and K. As expected, IL-33 significantly increased ILC2 levels in the lung (Fig. 8 I). The infiltration of eosinophils in BALF, and the inflammation index of the lung, were aggravated by IL-33 administration (Fig. 8, J and K; and Fig. S5 L), while these effects were almost completely abrogated by coadministration with telmisartan (Fig. 8, J and K; and Fig. S5 L). Taken together, these observations indicate that targeting AT1a signaling should have therapeutic value in allergic inflammatory disease.
Discussion
In this study, we identified an important role for the RAS in the context of ILC2-mediated allergic inflammation. Allergen exposure induced the activation of RAS and Ang II production in lung epithelial cells, which enhanced the responses of tissue-resident ILC2s via AT1a receptor. Inhibition of the Ang II–AT1a axis clearly alleviated allergic airway inflammation. Changes in transcriptional profiling and up-regulation of ERK1/2 phosphorylation were associated with these observations. Clinically, the elevation of plasma Ang II in asthmatic patients is positively correlated with the severity of asthma. These observations reveal Ang II as a novel regulator of lung ILC2s.
Circulating RAS is critically important in the maintenance of blood pressure and of sodium and water balance. The existence of local RAS has been demonstrated in a variety of organs, such as heart, brain, kidney, pancreas, and reproductive and adipose tissues. The local RASs function independently and play an important role in tissue homeostasis and inflammation (Nataraj et al., 1999; Shepherd et al., 2018). Recent results from single-cell RNA sequencing have shown that pulmonary neuroendocrine cells and basal cells in lungs express AGT, indicating the possibility of Ang II production in lungs (Plasschaert et al., 2018). In the present study, IF staining supported the production of AGT in lung epithelial cells and pulmonary neuroendocrine cells, which is consistent with previous studies (Campbell and Habener, 1986; Li et al., 2007). Furthermore, the expression of AGT, renin, and ACE in lung epithelium clearly increased under papain-induced allergic inflammation relative to the steady-state, indicating that RAS components are enhanced during type 2 immunity. No induction of AGT in kidney and liver was observed under papain-induced airway inflammation, further supporting the existence of local RAS in lungs. These observations would benefit the therapy of allergic inflammation by targeting local RAS components.
In addition to its importance in the cardiovascular system, Ang II has been demonstrated to promote inflammation. Ang II could increase vascular permeability and endothelial dysfunction (Pupilli et al., 1999), and enhance the production of proinflammatory cytokines and the infiltration of distinct immune cells into tissues (Ruiz-Ortega et al., 2002). These broad immunoregulatory effects render Ang II and RAS candidate therapeutic targets in inflammatory disorders (Stegbauer et al., 2009). The potential role of RAS and Ang II in lung diseases has been proposed by different groups (Abdel-Fattah et al., 2015; Imai et al., 2005; Tan et al., 2018). In the current study, we demonstrated that Ang II is an endogenous regulator of ILC2 in lungs. Mixed bone marrow chimeras using AT1a+/+ and AT1a−/− bone marrow indicated that AT1a deficiency did not influence the homeostasis of distinct immune cells, including ILC subsets. However, the responses of lung ILC2s were clearly diminished in the absence of AT1a after Ang II challenge or papain administration. Adoptive transfer of ILC2s into NCG mice further supported the notion that the regulation of ILC2s by Ang II was cell intrinsic. Because of the impaired ILC2 responses, inhibition of the Ang II–AT1a axis through either genetic or pharmacological models remarkably relieved the severity of allergic airway inflammation, which is inconsistent with a previous study using the OVA model in AT1a−/− mice (Ohwada et al., 2007). The therapeutic effect of an AT1 blocker in airway inflammation was further evidenced using humanized mice. These results collectively demonstrated that targeting Ang II–AT1a displays therapeutic potential in asthma. Considering that distinct cell types in lungs also express Ang II receptors, such as macrophages, dendritic cells, vascular smooth muscle cells, endothelial cells, and so on, the complicated role of the Ang II–AT1a axis in airway inflammation remains to be fully understood.
IL-33 is secreted from lung epithelial cells upon allergen exposure and represents one of the major drivers of ILC2 activation in lungs (Hardman et al., 2013). It was found that there is synergy between Ang II and IL-33 in the regulation of ILC2 responses. Combination of IL-33 and Ang II enhanced the production of type 2 cytokines of ILC2s in vitro. Mice with IL-33 deficiency displayed impaired responsiveness of lung ILC2s to Ang II, which may be due to the down-regulation of AT1a on ILC2. Consistently, IL-33 challenge induced the expression of AT1a on ILC2s. On the other hand, mice with AT1a deficiency showed a lower level of ST2 on lung ILC2s. These observations indicate that a potential feedback axis may exist between Ang II/AT1a and IL-33/ST2 signaling in ILC2s, the detailed mechanism of which deserves to be explored.
Clinical observations have supported the existence of a bidirectional relationship between hypertension and asthma. Patients who suffer from asthma display a higher incidence of hypertension than those who do not. Meanwhile, patients with hypertension also experience an aggravated severity of asthma (Christiansen et al., 2016; Christiansen and Zuraw, 2019; Ferguson et al., 2014). While the detailed mechanism of this link between asthma and hypertension remains to be understood, our study offers an explanation for the bidirectional relationship between them.
Materials and methods
Mice
Agtr1a−/−(B6.129P2-Agtr1atm1Unc/J) (AT1a−/−) mice were provided by Dr. Wei Kong from Peking University (Beijing, China). IL-33−/− mice were provided by Dr. Fang Zheng from Hua Zhong University of Science and Technology (Wuhan, China). C57B/L6-Ly5.1 (CD45.1) mice were provided by Dr. Haikun Wang from Institut Pasteur of Shanghai, Chinese Academy of Sciences (Shanghai, China). Rag-1−/− (B6.129S7-Rag1tm-1Mom/JNju) and NCG (NOD-Prkdcem26Cd52Il2rgem26Cd22/Nju) mice were purchased from the Nanjing Biomedical Research Institute of Nanjing University. Red5 (Il5-tdtomato-cre) cytokine reporter mice were provided by Dr. Yong Yu from Tongji University (Shanghai). Mice were crossed on the C57BL/6J background and maintained in specific pathogen–free conditions. Gender-matched littermates aged 6–10 wk were used. Mouse experimental procedures were approved by the Institutional Animal Care and Use Committee of Sun Yat-sen University and Tianjin Medical University.
Mouse model of lung inflammation
To induce lung inflammation, mice were anesthetized by inhalation of 3% isoflurane, and then treated with 20 µg of papain (Sigma-Aldrich) or 100 µg of HDM daily for 5 d or A. alternata for 4 d. Mice were sacrificed after the last treatment for analysis. For IL-33–induced airway inflammation, recombinant mouse IL-33 (400 ng/mouse; BioLegend) or PBS was i.n. administered daily for 3 d. Mice were sacrificed on day 4 for analysis. Ang II (30 µg) or sterile PBS was i.n. or i.p. administered daily for 5 d. WT and AT1a−/− mice were sacrificed on day 6 for analysis.
Bone marrow transplantation
Recipient CD45.1/2 mice were cross-bred with CD45.1 and CD45.2 mice. CD45.1/2 mice were irradiated with 11 Gy from an x-ray irradiator in two doses of 5.5 Gy over 220 s and, after a 4-h break, 5.5 Gy over 180 s. For mixed bone marrow chimeras, CD45.1/2 mice were reconstructed with a 1:1 mixture (total 107 cells) of CD45.1:AT1a+/+ and CD45.2:AT1a−/− mice by tail vein transfer. Antibiotic (neomycin, 1 mg/ml) was delivered in drinking water for 2 wk after bone marrow transplantation. At 4–5 wk after the reconstitution of the AT1a+/+ and AT1a−/− bone marrow, the chimeric mice were i.p. administered Ang II (30 µg/mouse) or PBS daily and sacrificed on day 6 for analysis. For papain administration, the reconstructed chimeric mice were i.n. administered papain (20 µg/mouse) daily and sacrificed on day 6 for analysis.
Cell isolation
Lymphocytes from BALF were collected by flushing fluid from the lung twice with 1 ml PBS through the trachea. The fluid was centrifuged at 700 g for 5 min, the sedimented cells were analyzed by flow cytometry, and the supernatant was stored at −80°C for determination of the cytokine concentration.
To isolate lung lymphocytes, the lung was cut in pieces and digested for 1 h with 3 ml of 0.5 mg/ml collagenase type I in RPMI-1640 medium with 10% FBS (Biological Industries) and 1% penicillin-streptomycin (Gibco) at 37°C at 220 rpm on a rotator. The digested cells were filtered through a 70-µm strainer, and then leukocytes were enriched by 40%/80% Percoll (GE Healthcare) gradient centrifugation. Spleen and mLN single-cell suspension was directly obtained by mechanical grinding disruption on a 70-µm cell strainer.
ELISA
Concentrations of the cytokines IL-5 and IL-13 were measured using mouse ELISA kits (eBioscience) according to the manufacturer’s instructions. The concentration of Ang II in BALF and asthmatic patients’ plasma was quantified using an Angiotensin II EIA Kit (Sigma-Aldrich) according to the manufacturer’s instructions. Concentrations of PGE2 in mouse BALF and serum were measured by the Mouse PGE2 ELISA kit (JYM0603 Mo).
Flow-cytometric analysis and sorting
After saturating Fc receptors with CD16/32-blocking antibody (BioLegend), single-cell suspensions were incubated at 4°C with conjugated antibodies in PBS containing 1% BSA. Dead cells were excluded using the LIVE/DEAD Fixable Far-Red Dead Cell Stain Kit (Thermo Fisher Scientific). For ILC subset staining, lineage was defined as CD3, CD4, CD5, CD8a, Gr1, B220, NK1.1, CD11b, CD11c, Ter119, and TCR-αβ. For cell surface staining, CD45, CD3, CD4, CD8, B220, CD11c, CD11b, MHC II, Siglec F, F4/80, CD19, CD45.1, CD45.2, CD127, CD90, CD25, KLRG1, ST2, NK1.1, NKp46, CCR6, C-Kit, α4β7, and Flt3 were used. For cytokine protein analysis ex vivo, single-cell suspensions were stimulated with PMA (50 ng/ml), ionomycin (1 µg/ml), and 1× brefeldin A (BFA) before intracellular staining. After surface antigen staining, cells were fixed using an intracellular fixation/permeabilization kit (eBioscience). For transcription factor and Ki-67 staining, single-cell suspensions were stained with antibodies to surface antigens, fixed, and permeabilized according to the manufacturer’s instructions (Foxp3/Transcription Factor Staining Buffer Set; eBioscience). Cell populations were defined as follows: CLPs: CD45+lin−CD127+Flt3+α4β7−; common helper innate lymphoid progenitor: CD45+lin−CD127+Flt3−α4β7+CD25−; ILC2 precursor: CD45+lin−CD127+Flt3−α4β7+CD25+; mLN ILC1s: CD45+lin−CD127+NK1.1+NKp46+; mLN ILC3s: CD45+lin−CD127+RORγt+(orCCR6+)KLRG1−; mLN and colon ILC2s: CD45+lin−CD127+CD90+KLRG1+; lung ILC2s: CD45+lin−CD90+CD25+ST2+, unless stated otherwise; epithelial cells: CD45−CD326+; DCs, macrophages, and eosinophils: CD45+CD11c−SiglecF+, CD4, CD8, CD19, and spleen NK (CD3−NK1.1+). All flow cytometry experiments were performed using the LSRFortessa flow cytometer (BD Bioscience) and FACSAria III (BD Bioscience) cell sorter. All flow data were analyzed with FlowJoVX (FlowJo). Purity of sorted cells was ≥95%. The reagents used are listed in Table S3.
Adoptive transfer of lung ILC2s into NCG mice
For adoptive transfer, lung ILC2s (CD45+lineage−CD90+ST2+ population) were sorted from IL-33 challenge mice, and then 2 × 10⁴ purified ILC2s were intravenously injected into NCG mice. NCG mice were challenged daily with Ang II (i.n.) for 5 consecutive days to induce lung inflammation. Mice were sacrificed and analyzed 24 h after the last challenge. For papain administration, the NCG recipient mice after adoptive transferred ILC2s were i.n. administered papain (20 µg/mouse) daily and sacrificed on day 6 for analysis.
Human subjects and humanized mouse model
The asthmatic children and healthy control samples were collected from the Guangzhou Women and Children’s Medical Center, Guangzhou, China, and written informed consent was provided by the participants. The clinical characteristics of healthy and asthmatic patients are listed in Table S1. This study was approved by the Guangzhou Women and Children’s Medical Center, Guangzhou, China. Human peripheral blood ILC2s were isolated from fresh peripheral blood as described previously. Briefly, fresh blood was diluted 1:4 in PBS and gently transferred to 50-ml tubes containing 15 ml Lymphoprep (STEMCELL Technologies). The samples were then centrifuged at 350 × g for 25 min at 18°C to enrich the peripheral blood mononuclear cells (PBMCs). For enrichment of lineage-negative cells, PBMCs were first stained with biotin-conjugated anti-CD2, anti-CD3, anti-CD10, anti-CD11b, anti-CD14, anti-CD16, anti-CD19, anti-CD56, anti-CD123, and anti-CD235a from the MagniSort Human Hematopoietic Lineage Depletion Kit (Thermo Fisher Scientific) following the manufacturer’s instructions. Next, the lineage-negative cells were stained with anti-human CD45, anti-human CD127, anti-human CD161, anti-human CRTH2, and Strep-APC at 4°C for 1 h. Human ILC2s were sorted with classical marker CD45+lin−CD127+CD161+CRTH2+, and the purity of sorted human ILC2s was ≥95%. Purified ILC2s were stimulated with 20 ng/ml rh-IL-33, IL-7, and IL-2 (PeproTech) for 3 d and then adoptively transferred into NCG mice by tail vein (5 × 10⁴ cells per mouse). The mice were then i.n. challenged with rH-IL-33 (1 µg/d) or PBS, and NCG mice were i.p. administered 10% DMSO and 10 mg/kg telmisartan daily for 4 consecutive days. 24 h later, the mice were sacrificed for analysis.
IF staining of lung
Briefly, mice were sacrificed and transcardially perfused with 40 ml of ice-cold PBS, and followed by 40 ml of 4% PFA in PBS. Lung tissues were placed in a 50-ml conical tube including 20 ml 4% PFA in PBS and incubated for 2 d. Tissues were then dehydrated using 30% sucrose in phosphate buffer (PB) solution for 24 h. Lung sections of 50 µm were sliced using a Leica CM1860. Samples were fixed, blocked, and permeabilized with PBS containing 0.25% Triton X-100 and 1% BSA at room temperature for 30 min, then stained. The following antibodies were used: rabbit anti-AGT (Abcam; clone: EPR20599), rat anti-EpCAM (Abcam; clone: G8.8), rabbit anti-Agtr1 (Abcam; ab18801; and Thermo Fisher Scientific; PA5-20812), rabbit anti-CGRP (produced by ChinaPeptides); they were followed by donkey anti-rabbit Alexa Fluor 647, donkey anti-rat Alexa Fluor 488, and DAPI. The primary antibody staining was at 37°C for 2 h followed by 4°C for 24 h. Secondary antibody staining was at room temperature for 1 h. Nuclei were stained with DAPI (Thermo Fisher Scientific). For localization of lung ILC2s with AGT-positive cells, lung sections of IL-5 reporter mice were stained with anti-AGT and DAPI. Images of representative tissue were captured by a LSM780 and LSM900 confocal microscope and analyzed by Zen software.
In vitro culture of ILC2s
Purified ILC2s were cocultured with the indicated reagents (telmisartan; Sigma-Aldrich; PD123319, MedChemExpress) in RPMI-1640 complete medium containing 10% FBS and 1% penicillin-streptomycin, in the presence of 20 ng/ml IL-2, IL-7, and IL-33, for 3 d. Human ILC2s were purified from fresh peripheral blood, and lung and mLN ILC2s were purified from WT and AT1a−/− mice. ILC2 proliferation and cytokine production were analyzed by FACS and ELISA.
For Ang II stimulation in vitro experiments, bulk mLN lymphocytes and purified mLN and lung ILC2s were incubated in complete RPMI-1640 (supplemented with 10% MSC FBS, and 1% streptomycin and penicillin) at 37°C and in 5% CO2. Lymphocytes or ILC2s were stimulated with human Ang II (1 µM unless stated otherwise; Sigma-Aldrich) for 4 h. For cytokine protein analysis in vitro (Fig. 2, B and C), ILC2s or lymphocytes were stimulated with 1× BFA under the indicated conditions (100 ng/ml IL-33, 1 µM Ang II, Ang II plus IL-33, or PMA plus ionomycin).
SMART-seq2
500 ILC2s from each condition were lysed in 5 µl 10× lysis buffer. Libraries were constructed by SMART-Seq2 with two replicates of each condition (Picelli et al., 2013). Briefly, the lysed RNA was denatured at 72°C for 3 min, and a PCR reaction was then performed in a mixture of 5× first strand buffer V2, Discover-sc template strand oligo V2, and Discover Reverse transcription (42°C for 90 min, 70°C for 15 min, and 4°C for hold). The former PCR products were mixed with Discover-sc whole transcriptome amplification PCR primers. 2× Discover PCR mix was proceeded with PCR a-20 cycles reaction for amplification cDNA. Purified and quantified PCR products were used for DNA library preparation and sequencing. A cDNA library constructed by technology from the pooled RNA was sequenced run with the Illumina Novaseq 6000 sequence platform. Sequenced reads were trimmed for adaptor sequence, masked for low-complexity or low-quality sequence, then mapped to Ensembl v101 Mus_musculus genome using HISAT 2.0 package with parameters -min_intron_length 20 -max_intron_length 500000. The mapped reads of each sample were assembled using StringTie. Then, all transcriptomes from samples were merged to reconstruct a comprehensive transcriptome using perl scripts. After the final transcriptome was generated, StringTie and edgeR were used to estimate the expression levels of all transcripts. StringTie was used to measure expression levels for mRNAs by calculating fragments per kilobase of exon model per million mapped fragments. The Gene Expression Omnibus accession no. for SMART-seq2 data is GSE190617.
RNA isolation and quantitative RT-PCR (qRT-PCR)
Total RNA from purified ILC2s was extracted with TRIzol reagent (Thermo Fisher Scientific), and cDNA was synthesized with a cDNA Reverse Transcription Kit (Takara Bio). qPCR was performed using the Power SYBR green PCR Mix (Takara Bio) on a CFX96/384 system (Bio-Rad). The primers used in this study are listed in Table S2. The genes’ relative expression was normalized to the expression of the gene encoding β-actin. The mRNA relative expressions of mouse AT1a and human AGTR1 were measured using the 2(−ΔCT) method. The mRNA relative expression of other genes were measured using the standard 2(−ΔΔCT) method.
H&E staining
Lungs were removed, fixed in 4% PFA, and embedded in paraffin for sectioning. H&E staining was performed for analysis of airway inflammation before microscopic analysis.
Statistical analysis
Correlation analysis was performed by the Spearman’s rank test. Data were analyzed by an unpaired two-tailed Student’s t test with GraphPad Prism 6.0. A P value of <0.05 was assessed as statistically significant.
Online supplemental material
Fig. S1 depicts expression of Ang II receptors and gating strategies of ILC2s. Fig. S2 shows the immune response of AT1a−/− mice and AT1a+/+ or Ang II treatment. Fig. S3 shows that regulation of ILC2s by Ang II is T cell independent. Fig. S4 shows that the effect of Ang II on ILC2s is dependent on IL-33, and AT1a deficiency attenuates papain-induced inflammation. Fig. S5 shows that blocking RAS alleviates papain-induced lung inflammation and clinical relevance. Table S1 contains the clinical characteristics of healthy and asthmatic children. Table S2 lists primers used in this study. Table S3 lists mouse strains, antibodies, software, and reagents used in this study.
Supplementary Material
shows the clinical characteristics of healthy children and asthmatic children.
shows PCR primers used in this study.
shows mouse strains, antibodies, reagents, and software used in this study.
Acknowledgments
We thank Dr. Yuxia Zhang from Guangzhou Women and Children’s Medical Center (Guangzhou, China) for helpful discussion about manuscript writing.
This work was supported by grants to J. Zhou: National Natural Science Foundation of China (81925018, 82130049, and 81771665), and Start-up Funding for High-Level Talents of Tianjin Medical University, Key Project of Tianjin Natural Science Foundation (20JCZDJC00670).
Author contributions: G. Liu designed and performed most experiments, analyzed the data, and wrote the manuscript. Y. Chen, Y. Wang, X. Deng, Q. Xiao, L. Zhang, H. Xu, X. Han, A. Lei, J. He, X. Li, Y. Cao, P. Zhou, and Q. Yang participated in the mouse experiments. C. He, P. Wu, W. Jiang, and M. Tan participated in the collection and analysis of clinical samples. C. Chen, L. Lu, and K. Deng provided advice and helpful suggestions about project design. J. Zhou and Z. Yao conceptualized, supervised, interpreted the experiments, and wrote the paper.
References
- Abdel-Fattah, M.M., Salama A.A., Shehata B.A., and Ismaiel I.E.. 2015. The potential effect of the angiotensin II receptor blocker telmisartan in regulating OVA-induced airway remodeling in experimental rats. Pharmacol. Rep. 67:943–951. 10.1016/j.pharep.2015.02.010 [DOI] [PubMed] [Google Scholar]
- Ayada, C., Toru U., Genc O., Sahin S., Bulut I., Arik O., and Acat M.. 2015. Evaluation of Serum Levels of Renin Angiotensin System Components in Asthmatic Patients. Erciyes Tıp Dergisi/Erciyes Medical Journal. 37:87–90. [Google Scholar]
- Benigni, A., Cassis P., and Remuzzi G.. 2010. Angiotensin II revisited: new roles in inflammation, immunology and aging. EMBO Mol. Med. 2:247–257. 10.1002/emmm.201000080 [DOI] [PMC free article] [PubMed] [Google Scholar]
- Branchfield, K., Nantie L., Verheyden J.M., Sui P., Wienhold M.D., and Sun X.. 2016. Pulmonary neuroendocrine cells function as airway sensors to control lung immune response. Science. 351:707–710. 10.1126/science.aad7969 [DOI] [PMC free article] [PubMed] [Google Scholar]
- Campbell, D.J., and Habener J.F.. 1986. Angiotensinogen gene is expressed and differentially regulated in multiple tissues of the rat. J. Clin. Invest. 78:31–39. 10.1172/JCI112566 [DOI] [PMC free article] [PubMed] [Google Scholar]
- Cardoso, V., Chesné J., Ribeiro H., García-Cassani B., Carvalho T., Bouchery T., Shah K., Barbosa-Morais N.L., Harris N., and Veiga-Fernandes H.. 2017. Neuronal regulation of type 2 innate lymphoid cells via neuromedin U. Nature. 549:277–281. 10.1038/nature23469 [DOI] [PMC free article] [PubMed] [Google Scholar]
- Christiansen, S.C., and Zuraw B.L.. 2019. Treatment of Hypertension in Patients with Asthma. N. Engl. J. Med. 381:1046–1057. 10.1056/NEJMra1800345 [DOI] [PubMed] [Google Scholar]
- Christiansen, S.C., Schatz M., Yang S.J., Ngor E., Chen W., and Zuraw B.L.. 2016. Hypertension and Asthma: A Comorbid Relationship. J. Allergy Clin. Immunol. Pract. 4:76–81. 10.1016/j.jaip.2015.07.009 [DOI] [PubMed] [Google Scholar]
- Chu, C., Artis D., and Chiu I.M.. 2020. Neuro-immune Interactions in the Tissues. Immunity. 52:464–474. 10.1016/j.immuni.2020.02.017 [DOI] [PMC free article] [PubMed] [Google Scholar]
- Cortez-Retamozo, V., Etzrodt M., Newton A., Ryan R., Pucci F., Sio S.W., Kuswanto W., Rauch P.J., Chudnovskiy A., Iwamoto Y., et al. 2013. Angiotensin II drives the production of tumor-promoting macrophages. Immunity. 38:296–308. 10.1016/j.immuni.2012.10.015 [DOI] [PMC free article] [PubMed] [Google Scholar]
- Dahlgren, M.W., Jones S.W., Cautivo K.M., Dubinin A., Ortiz-Carpena J.F., Farhat S., Yu K.S., Lee K., Wang C., Molofsky A.V., et al. 2019. Adventitial Stromal Cells Define Group 2 Innate Lymphoid Cell Tissue Niches. Immunity. 50:707–722.e6. 10.1016/j.immuni.2019.02.002 [DOI] [PMC free article] [PubMed] [Google Scholar]
- de Man, F.S., Tu L., Handoko M.L., Rain S., Ruiter G., François C., Schalij I., Dorfmüller P., Simonneau G., Fadel E., et al. 2012. Dysregulated renin-angiotensin-aldosterone system contributes to pulmonary arterial hypertension. Am. J. Respir. Crit. Care Med. 186:780–789. 10.1164/rccm.201203-0411OC [DOI] [PMC free article] [PubMed] [Google Scholar]
- Ferguson, S., Teodorescu M.C., Gangnon R.E., Peterson A.G., Consens F.B., Chervin R.D., and Teodorescu M.. 2014. Factors associated with systemic hypertension in asthma. Lung. 192:675–683. 10.1007/s00408-014-9600-y [DOI] [PMC free article] [PubMed] [Google Scholar]
- Gurram, R.K., and Zhu J.. 2019. Orchestration between ILC2s and Th2 cells in shaping type 2 immune responses. Cell. Mol. Immunol. 16:225–235. 10.1038/s41423-019-0210-8 [DOI] [PMC free article] [PubMed] [Google Scholar]
- Halim, T.Y.F., Rana B.M.J., Walker J.A., Kerscher B., Knolle M.D., Jolin H.E., Serrao E.M., Haim-Vilmovsky L., Teichmann S.A., Rodewald H.R., et al. 2018. Tissue-Restricted Adaptive Type 2 Immunity Is Orchestrated by Expression of the Costimulatory Molecule OX40L on Group 2 Innate Lymphoid Cells. Immunity. 48:1195–1207.e6. 10.1016/j.immuni.2018.05.003 [DOI] [PMC free article] [PubMed] [Google Scholar]
- Hardman, C.S., Panova V., and McKenzie A.N.. 2013. IL-33 citrine reporter mice reveal the temporal and spatial expression of IL-33 during allergic lung inflammation. Eur. J. Immunol. 43:488–498. 10.1002/eji.201242863 [DOI] [PMC free article] [PubMed] [Google Scholar]
- He, J., Yang Q., Xiao Q., Lei A., Li X., Zhou P., Liu T., Zhang L., Shi K., Yang Q., et al. 2019. IRF-7 Is a Critical Regulator of Type 2 Innate Lymphoid Cells in Allergic Airway Inflammation. Cell Rep. 29:2718–2730.e6. 10.1016/j.celrep.2019.10.077 [DOI] [PubMed] [Google Scholar]
- Helou, D.G., Shafiei-Jahani P., Lo R., Howard E., Hurrell B.P., Galle-Treger L., Painter J.D., Lewis G., Soroosh P., Sharpe A.H., and Akbari O.. 2020. PD-1 pathway regulates ILC2 metabolism and PD-1 agonist treatment ameliorates airway hyperreactivity. Nat. Commun. 11:3998. 10.1038/s41467-020-17813-1 [DOI] [PMC free article] [PubMed] [Google Scholar]
- Imai, Y., Kuba K., Rao S., Huan Y., Guo F., Guan B., Yang P., Sarao R., Wada T., Leong-Poi H., et al. 2005. Angiotensin-converting enzyme 2 protects from severe acute lung failure. Nature. 436:112–116. 10.1038/nature03712 [DOI] [PMC free article] [PubMed] [Google Scholar]
- Izu, Y., Mizoguchi F., Kawamata A., Hayata T., Nakamoto T., Nakashima K., Inagami T., Ezura Y., and Noda M.. 2009. Angiotensin II type 2 receptor blockade increases bone mass. J. Biol. Chem. 284:4857–4864. 10.1074/jbc.M807610200 [DOI] [PMC free article] [PubMed] [Google Scholar]
- Klose, C.S., and Artis D.. 2016. Innate lymphoid cells as regulators of immunity, inflammation and tissue homeostasis. Nat. Immunol. 17:765–774. 10.1038/ni.3489 [DOI] [PubMed] [Google Scholar]
- Klose, C.S.N., Mahlakõiv T., Moeller J.B., Rankin L.C., Flamar A.L., Kabata H., Monticelli L.A., Moriyama S., Putzel G.G., Rakhilin N., et al. 2017. The neuropeptide neuromedin U stimulates innate lymphoid cells and type 2 inflammation. Nature. 549:282–286. 10.1038/nature23676 [DOI] [PMC free article] [PubMed] [Google Scholar]
- Konya, V., and Mjösberg J.. 2016. Lipid mediators as regulators of human ILC2 function in allergic diseases. Immunol. Lett. 179:36–42. 10.1016/j.imlet.2016.07.006 [DOI] [PubMed] [Google Scholar]
- Kumar, R., Singh V.P., and Baker K.M.. 2007. The intracellular renin-angiotensin system: a new paradigm. Trends Endocrinol. Metab. 18:208–214. 10.1016/j.tem.2007.05.001 [DOI] [PubMed] [Google Scholar]
- Lambrecht, B.N., and Hammad H.. 2015. The immunology of asthma. Nat. Immunol. 16:45–56. 10.1038/ni.3049 [DOI] [PubMed] [Google Scholar]
- Lei, A.H., Xiao Q., Liu G.Y., Shi K., Yang Q., Li X., Liu Y.F., Wang H.K., Cai W.P., Guan Y.J., et al. 2018. ICAM-1 controls development and function of ILC2. J. Exp. Med. 215:2157–2174. 10.1084/jem.20172359 [DOI] [PMC free article] [PubMed] [Google Scholar]
- Li, X., Zhuang J., Rayford H., Zhang H., Shu R., and Uhal B.D.. 2007. Attenuation of bleomycin-induced pulmonary fibrosis by intratracheal administration of antisense oligonucleotides against angiotensinogen mRNA. Curr. Pharm. Des. 13:1257–1268. 10.2174/138161207780618867 [DOI] [PubMed] [Google Scholar]
- Liao, D.-F.B., Monia B., Dean N., and Berk B.C.. 1997. Protein kinase C-zeta mediates angiotensin II activation of ERK1/2 in vascular smooth muscle cells. J. Biol. Chem. 272:6146–6150. 10.1074/jbc.272.10.6146 [DOI] [PubMed] [Google Scholar]
- Maazi, H., Patel N., Sankaranarayanan I., Suzuki Y., Rigas D., Soroosh P., Freeman G.J., Sharpe A.H., and Akbari O.. 2015. ICOS:ICOS-ligand interaction is required for type 2 innate lymphoid cell function, homeostasis, and induction of airway hyperreactivity. Immunity. 42:538–551. 10.1016/j.immuni.2015.02.007 [DOI] [PMC free article] [PubMed] [Google Scholar]
- Mjösberg, J., Bernink J., Golebski K., Karrich J.J., Peters C.P., Blom B., te Velde A.A., Fokkens W.J., van Drunen C.M., and Spits H.. 2012. The transcription factor GATA3 is essential for the function of human type 2 innate lymphoid cells. Immunity. 37:649–659. 10.1016/j.immuni.2012.08.015 [DOI] [PubMed] [Google Scholar]
- Moriyama, S., Brestoff J.R., Flamar A.-L., Moeller J.B., Klose C.S.N., Rankin L.C., Yudanin N.A., Monticelli L.A., Putzel G.G., Rodewald H.-R., and Artis D.. 2018. β2-adrenergic receptor-mediated negative regulation of group 2 innate lymphoid cell responses. Science. 359:1056–1061. [DOI] [PubMed] [Google Scholar]
- Nataraj, C., Oliverio M.I., Mannon R.B., Mannon P.J., Audoly L.P., Amuchastegui C.S., Ruiz P., Smithies O., and Coffman T.M.. 1999. Angiotensin II regulates cellular immune responses through a calcineurin-dependent pathway. J. Clin. Invest. 104:1693–1701. 10.1172/JCI7451 [DOI] [PMC free article] [PubMed] [Google Scholar]
- Nussbaum, J.C., Van Dyken S.J., von Moltke J., Cheng L.E., Mohapatra A., Molofsky A.B., Thornton E.E., Krummel M.F., Chawla A., Liang H.E., and Locksley R.M.. 2013. Type 2 innate lymphoid cells control eosinophil homeostasis. Nature. 502:245–248. 10.1038/nature12526 [DOI] [PMC free article] [PubMed] [Google Scholar]
- Oboki, K., Ohno T., Kajiwara N., Arae K., Morita H., Ishii A., Nambu A., Abe T., Kiyonari H., Matsumoto K., et al. 2010. IL-33 is a crucial amplifier of innate rather than acquired immunity. Proc. Natl. Acad. Sci. USA. 107:18581–18586. 10.1073/pnas.1003059107 [DOI] [PMC free article] [PubMed] [Google Scholar]
- Ohwada, K., Watanabe K., Okuyama K., Ohkawara Y., Sugaya T., Takayanagi M., and Ohno I.. 2007. The involvement of type 1a angiotensin II receptors in the regulation of airway inflammation in a murine model of allergic asthma. Clin. Exp. Allergy. 37:1720–1727. 10.1111/j.1365-2222.2007.02815.x [DOI] [PubMed] [Google Scholar]
- Oliphant, C.J., Hwang Y.Y., Walker J.A., Salimi M., Wong S.H., Brewer J.M., Englezakis A., Barlow J.L., Hams E., Scanlon S.T., et al. 2014. MHCII-mediated dialog between group 2 innate lymphoid cells and CD4(+) T cells potentiates type 2 immunity and promotes parasitic helminth expulsion. Immunity. 41:283–295. 10.1016/j.immuni.2014.06.016 [DOI] [PMC free article] [PubMed] [Google Scholar]
- Picelli, S., Björklund A.K., Faridani O.R., Sagasser S., Winberg G., and Sandberg R.. 2013. Smart-seq2 for sensitive full-length transcriptome profiling in single cells. Nat. Methods. 10:1096–1098. 10.1038/nmeth.2639 [DOI] [PubMed] [Google Scholar]
- Plasschaert, L.W., Žilionis R., Choo-Wing R., Savova V., Knehr J., Roma G., Klein A.M., and Jaffe A.B.. 2018. A single-cell atlas of the airway epithelium reveals the CFTR-rich pulmonary ionocyte. Nature. 560:377–381. 10.1038/s41586-018-0394-6 [DOI] [PMC free article] [PubMed] [Google Scholar]
- Pupilli, C., Lasagni L., Romagnani P., Bellini F., Mannelli M., Misciglia N., Mavilia C., Vellei U., Villari D., and Serio M.. 1999. Angiotensin II stimulates the synthesis and secretion of vascular permeability factor/vascular endothelial growth factor in human mesangial cells. J. Am. Soc. Nephrol. 10:245–255. 10.1681/ASN.V102245 [DOI] [PubMed] [Google Scholar]
- Rigas, D., Lewis G., Aron J.L., Wang B., Banie H., Sankaranarayanan I., Galle-Treger L., Maazi H., Lo R., Freeman G.J., et al. 2017. Type 2 innate lymphoid cell suppression by regulatory T cells attenuates airway hyperreactivity and requires inducible T-cell costimulator-inducible T-cell costimulator ligand interaction. J. Allergy Clin. Immunol. 139:1468–1477.e2. 10.1016/j.jaci.2016.08.034 [DOI] [PMC free article] [PubMed] [Google Scholar]
- Ruiz-Ortega, M., Ruperez M., Lorenzo O., Esteban V., Blanco J., Mezzano S., and Egido J.. 2002. Angiotensin II regulates the synthesis of proinflammatory cytokines and chemokines in the kidney. Kidney Int. Suppl. 62(82, suppl):S12–S22. 10.1046/j.1523-1755.62.s82.4.x [DOI] [PubMed] [Google Scholar]
- Schneider, C., O’Leary C.E., von Moltke J., Liang H.E., Ang Q.Y., Turnbaugh P.J., Radhakrishnan S., Pellizzon M., Ma A., and Locksley R.M.. 2018. A Metabolite-Triggered Tuft Cell-ILC2 Circuit Drives Small Intestinal Remodeling. Cell. 174:271–284.e14. 10.1016/j.cell.2018.05.014 [DOI] [PMC free article] [PubMed] [Google Scholar]
- Shen, Y., Wang X., Lu J., Salfenmoser M., Wirsik N.M., Schleussner N., Imle A., Freire Valls A., Radhakrishnan P., Liang J., et al. 2020. Reduction of Liver Metastasis Stiffness Improves Response to Bevacizumab in Metastatic Colorectal Cancer. Cancer Cell. 37:800–817.e7. 10.1016/j.ccell.2020.05.005 [DOI] [PubMed] [Google Scholar]
- Shenoy, S.K., and Lefkowitz R.J.. 2005. Angiotensin II-stimulated signaling through G proteins and β-arrestin. Sci. STKE. 2005:cm14. 10.1126/stke.3112005cm14 [DOI] [PubMed] [Google Scholar]
- Shepherd, A.J., Mickle A.D., Golden J.P., Mack M.R., Halabi C.M., de Kloet A.D., Samineni V.K., Kim B.S., Krause E.G., Gereau R.W. IV, and Mohapatra D.P.. 2018. Macrophage angiotensin II type 2 receptor triggers neuropathic pain. Proc. Natl. Acad. Sci. USA. 115:E8057–E8066. 10.1073/pnas.1721815115 [DOI] [PMC free article] [PubMed] [Google Scholar]
- Stegbauer, J., Lee D.H., Seubert S., Ellrichmann G., Manzel A., Kvakan H., Muller D.N., Gaupp S., Rump L.C., Gold R., and Linker R.A.. 2009. Role of the renin-angiotensin system in autoimmune inflammation of the central nervous system. Proc. Natl. Acad. Sci. USA. 106:14942–14947. 10.1073/pnas.0903602106 [DOI] [PMC free article] [PubMed] [Google Scholar]
- Sui, P., Wiesner D.L., Xu J., Zhang Y., Lee J., Van Dyken S., Lashua A., Yu C., Klein B.S., Locksley R.M., et al. 2018. Pulmonary neuroendocrine cells amplify allergic asthma responses. Science. 360:eaan8546. 10.1126/science.aan8546 [DOI] [PMC free article] [PubMed] [Google Scholar]
- Tan, W.S.D., Liao W., Zhou S., Mei D., and Wong W.F.. 2018. Targeting the renin-angiotensin system as novel therapeutic strategy for pulmonary diseases. Curr. Opin. Pharmacol. 40:9–17. 10.1016/j.coph.2017.12.002 [DOI] [PubMed] [Google Scholar]
- von Moltke, J., Ji M., Liang H.E., and Locksley R.M.. 2016. Tuft-cell-derived IL-25 regulates an intestinal ILC2-epithelial response circuit. Nature. 529:221–225. 10.1038/nature16161 [DOI] [PMC free article] [PubMed] [Google Scholar]
- Walker, J.A., and McKenzie A.N.J.. 2018. TH2 cell development and function. Nat. Rev. Immunol. 18:121–133. 10.1038/nri.2017.118 [DOI] [PubMed] [Google Scholar]
- Walker, J.A., Oliphant C.J., Englezakis A., Yu Y., Clare S., Rodewald H.R., Belz G., Liu P., Fallon P.G., and McKenzie A.N.. 2015. Bcl11b is essential for group 2 innate lymphoid cell development. J. Exp. Med. 212:875–882. 10.1084/jem.20142224 [DOI] [PMC free article] [PubMed] [Google Scholar]
- Wallrapp, A., Riesenfeld S.J., Burkett P.R., Abdulnour R.E., Nyman J., Dionne D., Hofree M., Cuoco M.S., Rodman C., Farouq D., et al. 2017. The neuropeptide NMU amplifies ILC2-driven allergic lung inflammation. Nature. 549:351–356. 10.1038/nature24029 [DOI] [PMC free article] [PubMed] [Google Scholar]
- Wallrapp, A., Burkett P.R., Riesenfeld S.J., Kim S.J., Christian E., Abdulnour R.E., Thakore P.I., Schnell A., Lambden C., Herbst R.H., et al. 2019. Calcitonin Gene-Related Peptide Negatively Regulates Alarmin-Driven Type 2 Innate Lymphoid Cell Responses. Immunity. 51:709–723.e6. 10.1016/j.immuni.2019.09.005 [DOI] [PMC free article] [PubMed] [Google Scholar]
- Xiao, Q., He J., Lei A., Xu H., Zhang L., Zhou P., Jiang G., and Zhou J.. 2021. PPARγ enhances ILC2 function during allergic airway inflammation via transcription regulation of ST2. Mucosal Immunol. 14:468–478. [DOI] [PubMed] [Google Scholar]
- Yasuda, K., Muto T., Kawagoe T., Matsumoto M., Sasaki Y., Matsushita K., Taki Y., Futatsugi-Yumikura S., Tsutsui H., Ishii K.J., et al. 2012. Contribution of IL-33-activated type II innate lymphoid cells to pulmonary eosinophilia in intestinal nematode-infected mice. Proc. Natl. Acad. Sci. USA. 109:3451–3456. 10.1073/pnas.1201042109 [DOI] [PMC free article] [PubMed] [Google Scholar]
- Yu, X., Wang Y., Deng M., Li Y., Ruhn K.A., Zhang C.C., and Hooper L.V.. 2014. The basic leucine zipper transcription factor NFIL3 directs the development of a common innate lymphoid cell precursor. eLife. 3:e04406. 10.7554/eLife.04406 [DOI] [PMC free article] [PubMed] [Google Scholar]
Associated Data
This section collects any data citations, data availability statements, or supplementary materials included in this article.
Supplementary Materials
shows the clinical characteristics of healthy children and asthmatic children.
shows PCR primers used in this study.
shows mouse strains, antibodies, reagents, and software used in this study.


