Single-cell transcriptomic analysis shows that macrophages in mucosa and muscularis propria of human colon are very heterogeneous and that their functional properties are closely related to their anatomic position. The study indicates that distinct differentiation pathways are controlled by extensive interactions with tissue-resident cells.
Abstract
Macrophages are a heterogeneous population of cells involved in tissue homeostasis, inflammation, and cancer. Although macrophages are densely distributed throughout the human intestine, our understanding of how gut macrophages maintain tissue homeostasis is limited. Here we show that colonic lamina propria macrophages (LpMs) and muscularis macrophages (MMs) consist of monocyte-like cells that differentiate into multiple transcriptionally distinct subsets. LpMs comprise subsets with proinflammatory properties and subsets with high antigen-presenting and phagocytic capacity. The latter are strategically positioned close to the surface epithelium. Most MMs differentiate along two trajectories: one that upregulates genes associated with immune activation and angiogenesis, and one that upregulates genes associated with neuronal homeostasis. Importantly, MMs are located adjacent to neurons and vessels. Cell–cell interaction and gene network analysis indicated that survival, migration, transcriptional reprogramming, and niche-specific localization of LpMs and MMs are controlled by an extensive interaction with tissue-resident cells and a few key transcription factors.
Introduction
In recent years, it has been shown that tissue macrophages, residing in virtually all organs, are extremely heterogeneous. Originally, macrophages were described as professional phagocytes that were fundamental to our immune defense. However, it is now clear that macrophages have a broad range of both immune and nonimmune functions. Moreover, many macrophage functions are tissue-specific, such as electrical conduction in the heart (Hulsmans et al., 2017), synaptic pruning in the brain (Hong et al., 2016), alveolar surfactant clearance in the lung (Guilliams et al., 2013), and limb regeneration in salamanders (Godwin et al., 2013). These functions are thought to be controlled by tissue-specific gene modules regulated by specific transcription factors (TFs) imprinted by the microenvironment. Interestingly, tissue-resident macrophages (TRMs) can be reprogrammed when transferred to a new microenvironment (Lavin et al., 2014), indicating that mature TRMs retain their plasticity. In addition to the local microenvironment, macrophage functions also depend on their ontogeny (embryonic precursors or adult monocytes), intrinsic factors, and time spent in the tissue (Bleriot et al., 2020).
The gut is an organ composed of several compartments with unique functions. The mucosa is covered by a one-cell-thick epithelial layer that separates our body from the outside world. This compartment stretches the local immune system to its limits: it has to rapidly and efficiently eliminate pathogens and toxins and at the same time tolerate harmless molecules (e.g., food proteins) and the gut microbiota. Below the mucosa is a thin layer of tissue termed submucosa, which overlies a thick layer of smooth muscle, termed muscularis propria, consisting of a circular and longitudinal muscular layer. The muscular layers are responsible for segmental contractions and peristaltic movement of the intestinal tract. The gut has an extensive enteric nervous system with a plexus of ganglia cells in both the muscular layers (Auerbach’s plexus) and the submucosa (Meissner’s plexus).
Macrophages populate all layers of the gut wall, and studies in mice suggest that they have niche-specific functions that are essential to maintain tissue homeostasis (De Schepper et al., 2018). Under steady-state conditions, lamina propria macrophages (LpMs) constantly phagocytose apoptotic epithelial cells and are critical for gut microbiota composition (Arandjelovic and Ravichandran, 2015; Earley et al., 2018). Recently, LpMs in distal colon were shown to maintain epithelial integrity by limiting fungal product adsorption (Chikina et al., 2020). Muscularis propria macrophages (MMs) interact with both neurons and vessels, and loss of MMs leads to loss of enteric neurons, vascular leakage, impaired secretion, and reduced intestinal motility (De Schepper et al., 2018; Muller et al., 2014). Moreover, Matheis et al. (2020) showed that MMs protected against postinfectious neuron damage. At birth, the mouse gut is populated with embryonic-derived macrophages. However, the LpMs are rapidly (within weeks) replaced by bone marrow–derived circulating monocytes (Bain et al., 2014). Monocytes also emigrate to muscularis propria, but in this compartment embryonic-derived macrophages appear to be more persistent (De Schepper et al., 2018). However, all studies cited above were performed in mice, and translation of these results to understand human macrophage biology should be made with caution.
Gut macrophages may also be detrimental to the host. Aberrantly activated macrophages have been shown to play a key role in inflammatory bowel disease pathology (Martin et al., 2019; Smillie et al., 2019), and tumor-associated macrophages are often associated with worse prognosis (Katzenelenbogen et al., 2020; Zhang et al., 2020). Because of their heterogeneity and plasticity, there is currently great interest in the search for strategies to reprogram macrophages as a therapeutic tool to treat both inflammatory disorders and cancer (Jahchan et al., 2019). However, to target macrophages in human diseases, a deeper understanding of their heterogeneity and tissue-specific functions is necessary.
Our current knowledge about macrophages in the human gut is limited. Using bulk RNA sequencing (RNA-seq), we have shown that LpMs in the small intestine consist of several transcriptional states (Bujko et al., 2018), and by following their turnover kinetics in transplanted duodenum, we found that host circulating monocytes rapidly entered the graft and differentiated into TRMs that completely replaced donor LpMs, within months after transplantation. Here we extend these findings by performing a detailed characterization of both LpMs and MMs from adult human colon, applying single-cell RNA-seq (scRNA-seq) and multicolor immunostaining in situ. Spatiotemporal analysis shows that both compartments contain multiple coexisting TRM subsets with subtissular-specific functions. We furthermore identify a limited number of TFs that may control TRM diversity, and we reveal an extensive cross talk between TRM subsets and tissue-resident cells, including stromal cells, epithelial cells, neurons, and immune cell lineages. These cell–cell interactions are most likely responsible for the imprinting of tissue-specific macrophage identity.
Results
Macrophages in colonic mucosa and muscularis propria comprise transcriptional states associated with monocytes and TRMs
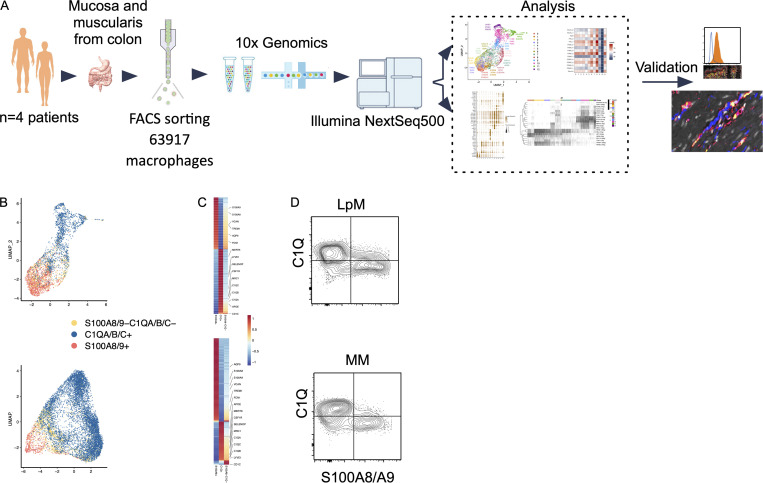
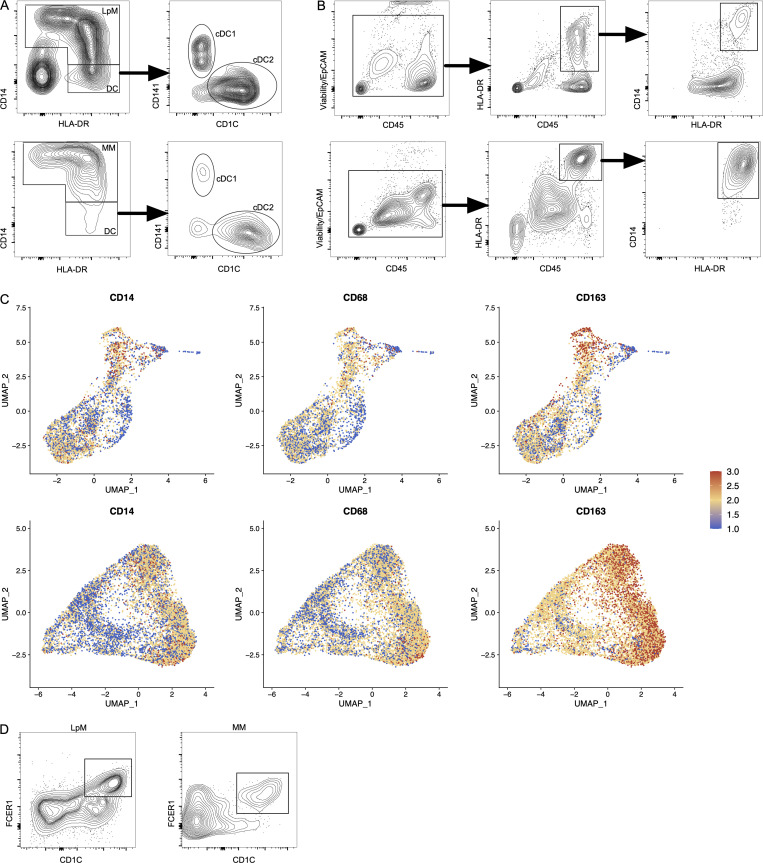
Samples from the large intestine were obtained from colorectal cancer resections (n = 4). Macroscopically and microscopically normal tissue ≥10 cm from the tumor tissue was used. Mucosa and muscularis propria were separated longitudinally, and pieces of tissue from each compartment were enzymatically digested to obtain single-cell preparations. Cells from mucosa and muscularis were analyzed separately (Fig. 1 A). Flow cytometric analysis revealed that CD45+CD3−CD19−HLA-DRint/+ cells separated into either CD14+ macrophages or CD14− classic dendritic cells (cDCs), including CD141+ cDC1 and CD1C+ cDC2 (Fig. S1 A), as previously shown in the small intestine (Bujko et al., 2018). Thus, tissue-derived macrophages were sorted as CD45+HLA-DR+CD14+ (Fig. S1 B) and processed on a 10X Genomics Chromium platform. A total of 63,970 cells with high-quality mRNA were analyzed. To present high-dimensional data in low dimension, we constructed Uniform Manifold Approximation and Projection (UMAP) plots of each compartment. We found that sorted CD14+ cells expressed the macrophage markers CD163 and CD68, further demonstrating that cells included in the analysis were all macrophages (Fig. S1 C).
Figure 1.
Schematic overview of scRNA-seq analysis and identification of monocyte-like and TRMs in colonic mucosa and muscularis propria. (A) Schematic overview of scRNA-seq analysis. (B) UMAP plots showing expression of S100A8/A9+ (red), C1QA/B/C+ (blue), and S100A8/A9−C1QA/B/C− (yellow). The color among compartments is determined by its higher expression level. (C) Heatmap of DEGs by S100A8/A9+, C1QA/B/C+, and S100A8/A9−C1QA/B/C− cells. Selected genes are indicated. Expression levels are visualized from low expression (blue) to high expression (red). (D) Flow cytometry plots showing intracellular staining for C1Q and S100A8/S100A9 (calprotectin) in CD45+HLA-DR+CD14+ cells from mucosa (top) and muscularis propia (bottom). Gates were set based on staining with irrelevant isotype-matched antibodies. Representative of more than four experiments.
Figure S1.
Characterization and flow cytometry sorting strategy for LpMs and MMs. (A) Flow cytometry plots of live-gated CD45+CD3−CD19− cells showing that HLA-DR+ cells are separated into CD14+ macrophages (LpMs, top left; MMs, bottom left) or CD14− DCs, where the latter comprise CD141+ cDC1 and CD1C+ cDC2. (B) Flow cytometry gating strategy to target CD14+ LpMs (top) and CD14+ MMs (bottom). (C) UMAP plots of selected macrophage-related genes in LpMs (top) and MMs (bottom). Expression levels are visualized from low (blue) to high (red) expression. (D) Flow cytometry plots showing CD14+CD1C+FCER1+ cells in mucosa (left) and muscularis propria (right). All flow cytometry plots are representative of more than four donors.
We have previously shown that the macrophage population in the small intestine contains several transcriptionally distinct subpopulations (Bujko et al., 2018), including “transient” monocyte-like macrophages expressing high levels of calprotectin (heterodimer of S100A8 and S100A9) and long-lived calprotectin-negative macrophages expressing a TRM phenotype (Bujko et al., 2018). To examine whether colonic LpMs and MMs contained similar phenotypes, we first assessed the expression of S100A8 and S100A9 and the complement component 1 chains (C1QA, C1QB, and C1QC); the latter were highly expressed on small intestinal TRMs (Bujko et al., 2018). UMAP visualization of both compartments showed that most LpMs and MMs expressed either S100A8/S100A9 or C1QA/C1QB/C1QC genes (Fig. 1 B). Further transcriptomic analysis of S100A8/S100A9+ macrophages showed a high number of differentially expressed genes (DEGs; e.g., FCN1, VCAN, AQP9, and TREM1) that are preferentially expressed in blood monocytes and small intestinal monocyte-like macrophages (Fig. 1 C). C1QA/C1QB/C1QC+ macrophages, on the other hand, expressed many genes associated with TRMs (e.g., MRC1, APOE, SELENOP, CSF1R, MERTK, and LYVE1; Fig. 1 C). Flow cytometry of dispersed tissue macrophages confirmed that LpMs and MMs consisted mainly of calprotectin+C1Q− and calprotectin−C1Q+ macrophages (Fig. 1 D). Together, these findings demonstrated that both LpMs and MMs contained monocyte-like macrophages and mature macrophages with a TRM phenotype.
Mucosal macrophages comprise transcriptionally distinct and niche-specific subsets
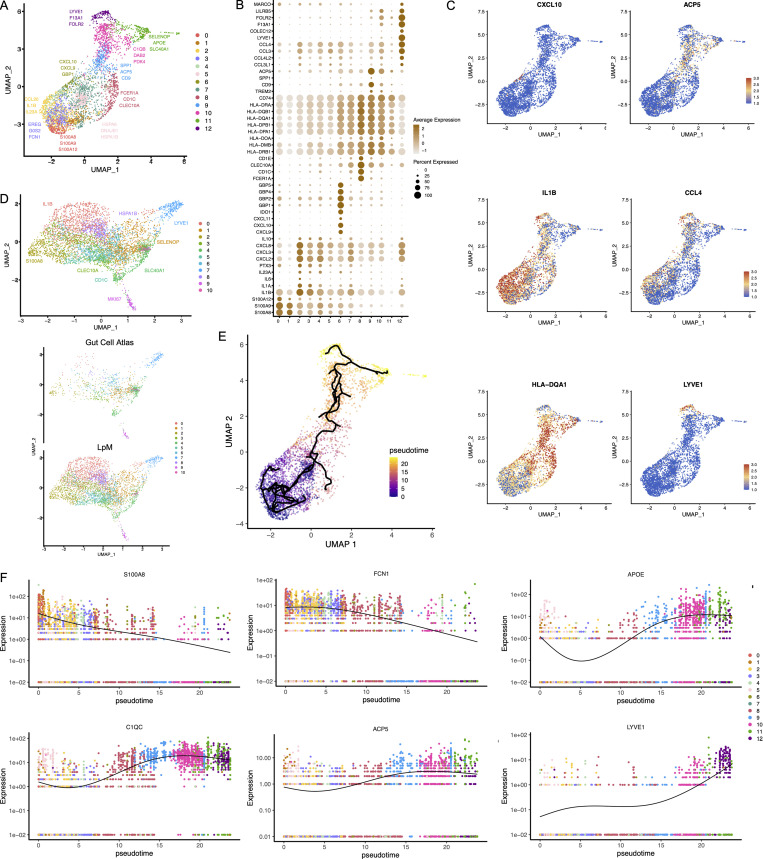
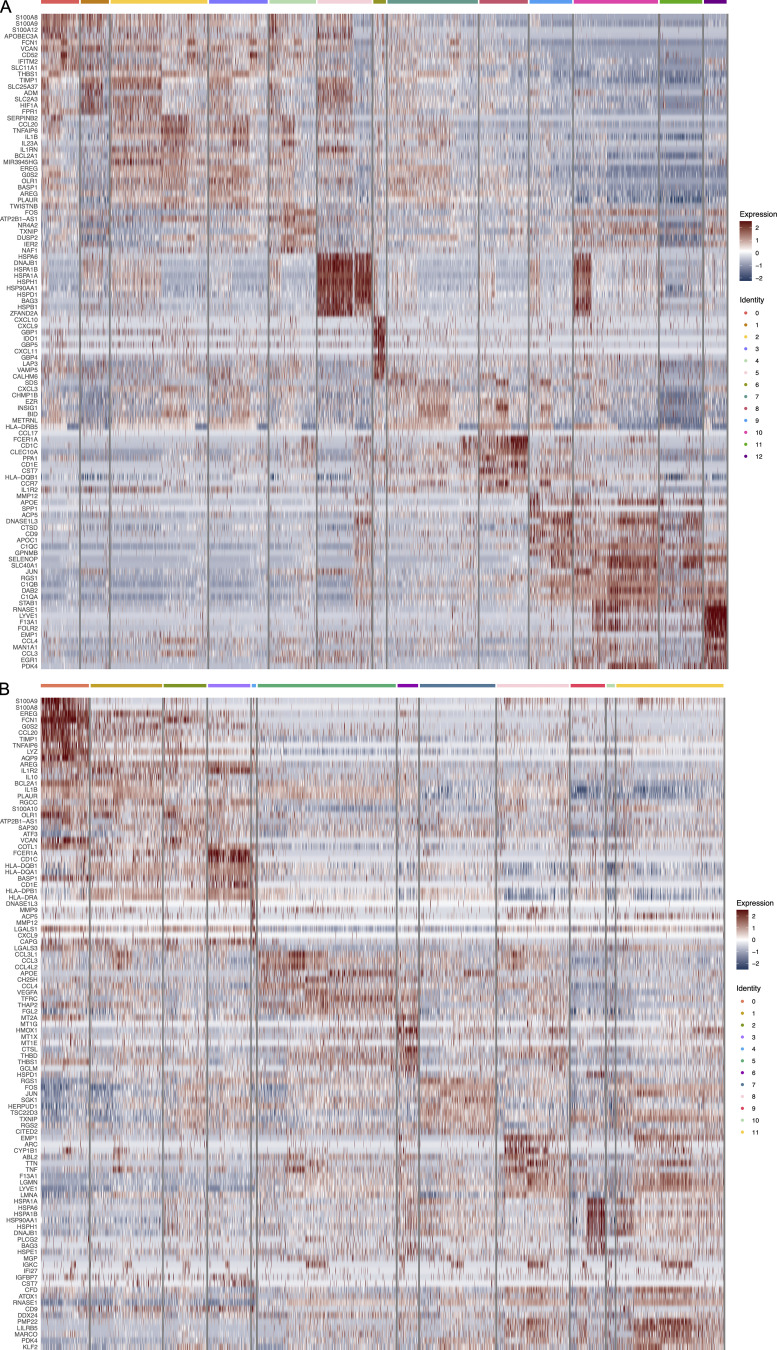
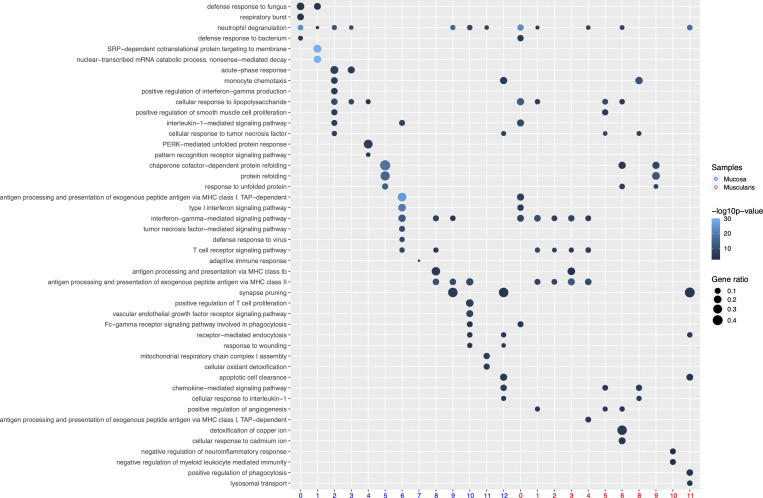
To characterize LpMs further, we performed clustering analysis using Seurat 3.0 (Stuart et al., 2019). Based on DEGs, 13 clusters were identified (Figs. 2 A and S2 A) that encompassed macrophages from all patients included in the study (Fig. S3 A). DEGs in clusters 0–4 (LpM0–LpM4) were reminiscent of small intestinal monocyte-like macrophages (Bujko et al., 2018), and enriched gene ontology (GO) terms were typical for innate immune responses such as responses to bacterium, fungus, and LPS (Fig. 3). LpM0 expressed the highest levels of S100A8, S100A9, and S100A12 (Fig. 2 B), indicating that this cluster constitutes the most recently elicited monocytes. LpM2 expressed high levels of many proinflammatory genes (e.g., IL-1B, IL-1A, IL-6, IL23A, CXCL2, CXCL3, and CXCL8) reminiscent of inflammatory macrophages found in inflammatory bowel disease lesions (Martin et al., 2019; Fig. 2, B and C). The immunoregulatory cytokine IL10 showed highest expression in LpM2–LpM4 (Fig. 2 B). LpM5 contained DEGs encoding many heat shock proteins (HSPs; Fig. S2 A), and top GO terms were related to unfolded protein responses (Fig. 3). Interestingly, LpM6 expressed many IFNγ-inducible genes virtually absent in the other clusters; (e.g., CXCL9, CXCL10, CXCL11, IDO1, GBP1, GBP2, GBP4, and GBP5; Fig. 2, B and C). The top GO terms were antigen processing and presentation of exogenous peptide antigen via MHC class I, and type I IFN-, IFNγ- and TNF-signaling pathway (Fig. 3). This phenotype has recently been reported to promote antitumor immunity in colorectal cancer of mice (Qu et al., 2020). Cluster 8 expressed low levels of both S100A8/S100A9 and C1Q genes (Fig. 1 B), but many DEGs were associated with DCs (e.g., FCER1A, CD1C, CLEC10A, and CD1E; Fig. 2 B). This cluster also expressed high levels of MHC class II genes (Fig. 2, B and C), and the top GO term was antigen processing and presentation of exogenous peptide antigen via MHC class II (Fig. 3). Flow cytometric analysis confirmed the presence of CD14+FCER1+CD1C+ cells in dispersed mucosa (Fig. S1 D). This phenotype is reminiscent of a recently identified DC population, termed DC3, which originates independently of both cDCs and monocytes (Cytlak et al., 2020; Bourdely et al., 2020; Dutertre et al., 2019).
Figure 2.
Cluster analysis, differential gene expression identification, and pseudotime trajectories for LpMs. (A) UMAP representation of 13 clusters (different colors) with annotated highly expressed gene identity within selected clusters. (B) Dot plot of average expression of selected genes. Expression levels are visualized from low (white) to high (brown) expression. The percentage of positive cells is indicated by circle size. (C) UMAP visualization of selected genes. Expression levels are visualized from low (blue) to high (red) expression. (D) UMAP of integrated analysis of LpMs and mucosal macrophages from the Gut Cell Atlas (Elmentaite et al., 2021). (E) Reconstructed developmental trajectory of LpMs showing pseudotime colored from blue to yellow. (F) Expression for some selected gene expression through pseudotime. Cell colors represents clusters.
Figure S2.
Heatmap of top 10 DEGs in clustered LpMs (A) and MMs (B).
Figure S3.
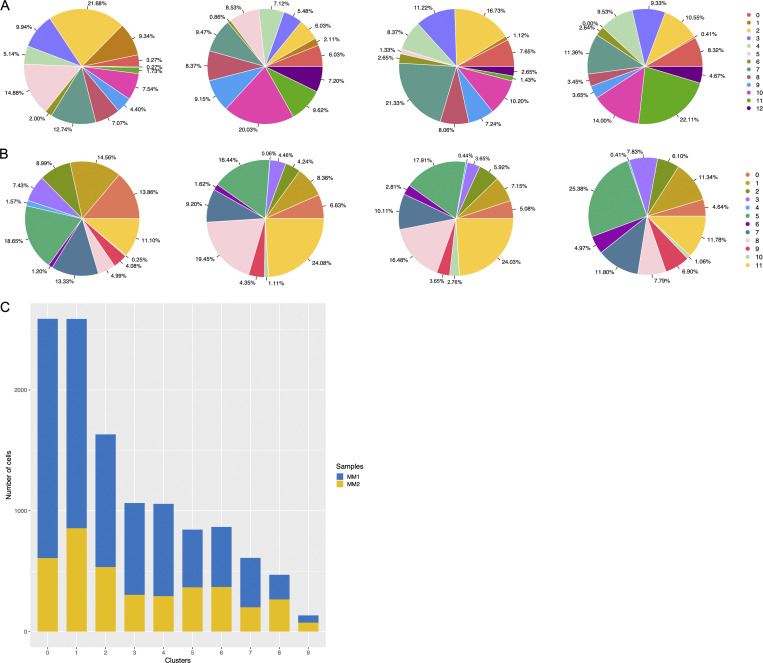
Representation of cell frequencies from donors and compartments. (A and B) Cluster size of LpMs (A) and MMs (B) shown for each donor. (C) Representation of cells in MM clusters obtained from two sites (MM1, MM2) of muscularis propria (n = 3).
Figure 3.
GO terms significantly (P < 0.05) enriched at the transcriptomic level for selected clusters of LpMs and MMs.
LpM9 and LpM10 expressed high levels of HLA class II genes (Fig. 2, B and C). Accordingly, enriched GO terms were antigen processing and presentation of exogenous peptide antigen via MHC class II (Fig. 3). GO terms for LpM10 also included wound healing and receptor-mediated endocytosis (Fig. 3). Interestingly, LpM9 (and to a lesser extent LpM10) expressed CD9, TREM2, SPP1, and ACP5 (Fig. 2, B and C), genes that were recently shown to identify monocyte-derived macrophages enriched in liver fibrosis (Ramachandran et al., 2019) and in adipose tissues of obese patients (Jaitin et al., 2019). LpM12 selectively expressed many typical TRM genes, such as LYVE1, COLEC12, F13A1, and FOLR2 (Fig. 2, B and C), and several chemokine genes (e.g., CXCL2, CXCL3, CXCL8, CCL3, and CCL4; Fig. 2, B and C). GO terms included chemokine-mediated signaling pathway, synapse pruning, apoptotic cell clearance, and receptor-mediated endocytosis (Fig. 3). To validate the results, we integrated our data with a recently published dataset of macrophages derived from human intestinal mucosa (Elmentaite et al., 2021). Clustering analysis showed that the macrophage transcriptomes from the two datasets were largely overlapping (Fig. 2 D). Moreover, interestingly, the integrated analysis identified a small cluster of DEGs associated with proliferation (e.g., MKI67), suggesting that some of the macrophages had the capacity to proliferate.
Other reports (Bain et al., 2014; Bujko et al., 2018) have suggested that the vast majority of LpMs originate from bone marrow–derived monocytes, which constantly emigrate to the mucosa and differentiate into TRMs. To further understand the process of monocyte-to-macrophage differentiation, we reconstructed their developmental trajectories using the Monocle 3 algorithm (Trapnell et al., 2014). We excluded DC3 from the analysis because this subset is reported to originate independently of the monocyte lineage (Cytlak et al., 2020; Bourdely et al., 2020; Dutertre et al., 2019). Selecting random cells in LpM0 as root, we identified at least two distinct branches. A short branch ended in cluster 2, compatible with a distinct proinflammatory trajectory, whereas a major branch followed from LpM0 to LpM9–12 as a function of pseudotime (Fig. 2 E). As expected, genes typical for monocytes were downregulated following this trajectory, whereas typical TRM genes were increased (Fig. 2 F). Together, the findings suggested that LpMs consisted of multiple transcriptional cell states, indicating that incoming monocytes constantly differentiate into multiple distinct TRM subsets with time (Bujko et al., 2018).
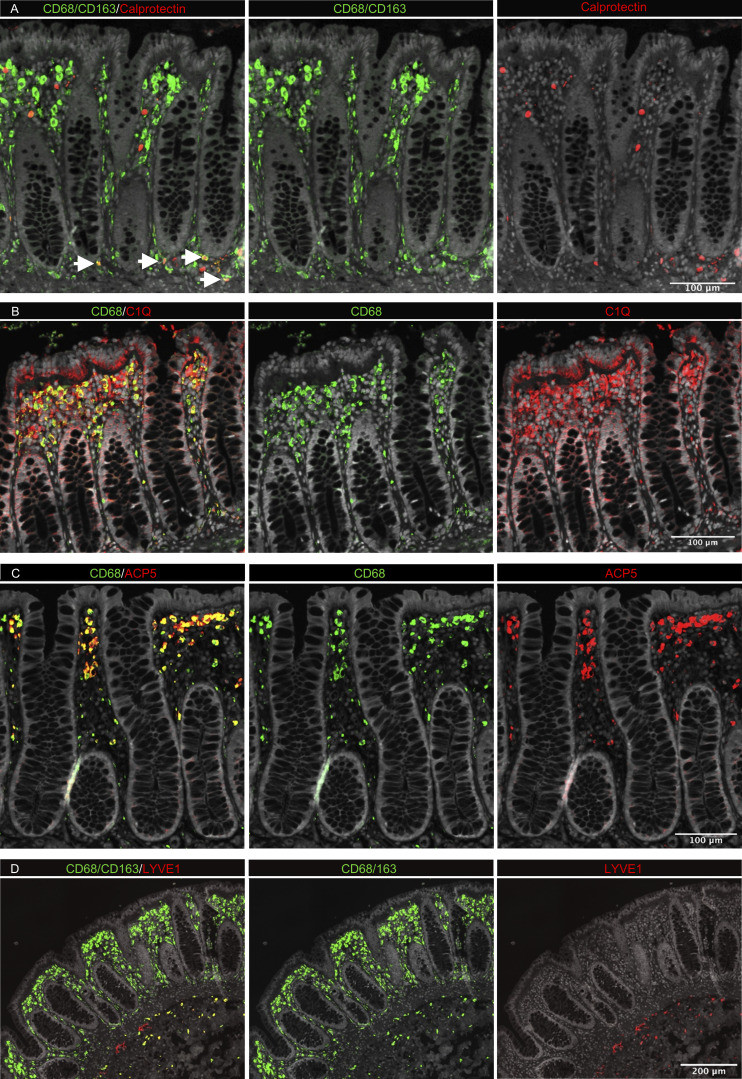
Studies in mice have shown that TRMs occupy distinct tissue niches, where they display niche-specific functions (Chakarov et al., 2019; Guilliams et al., 2020). To determine the anatomic localization of LpM subsets, we performed multicolor immunofluorescence stainings in situ. LpMs were present in high numbers (median 1,080/mm2, n = 5), and of those, calprotectin-expressing LpMs constituted a median of 6%, scattered in the lower part of the mucosa between crypts (Fig. 4 A), whereas a median of 45% LpMs strongly expressed C1Q, positioned in the subepithelial region (Fig. 4 B). To further determine the localization of distinct TRM clusters, we found that a median of 47% of LpMs stained for ACP5 (expressed by LpM9 and LpM10), whereas LYVE-1 and COLEC12, which were not expressed in the mucosa, decorated >90% of submucosal macrophages (SmMs; median 243 mm2; Figs. 4 D and S4 A), indicating that LpM12 represented the SmM population. Several studies have shown that LYVE-1 is associated with perivascular macrophages, whereas macrophages expressing COLEC12, a scavenger receptor for uptake of myelin, has been associated with neurons (Bogie et al., 2017). Here we found that the vast majority of SmMs expressed both LYVE-1 and COLEC12.
Figure 4.
In situ localization of LpMs in human colon. (A–D) Sections stained for CD68/CD163 (green) and calprotectin (S100A8/S100A9; red; A); CD68 (green) and C1Q (red; B); CD68 (green) and ACP5 (red; C); and CD68/CD163 (green) and LYVE-1 (red; D). All sections were counterstained with Hoechst DNA-stain (gray). Arrows indicate CD68/CD163+ calprotectin+ LpMs (yellow; A). Calprotectin+ CD68/CD163− cells (red, left upper panel) are granulocytes. Representative of n ≥ 3.
Figure S4.
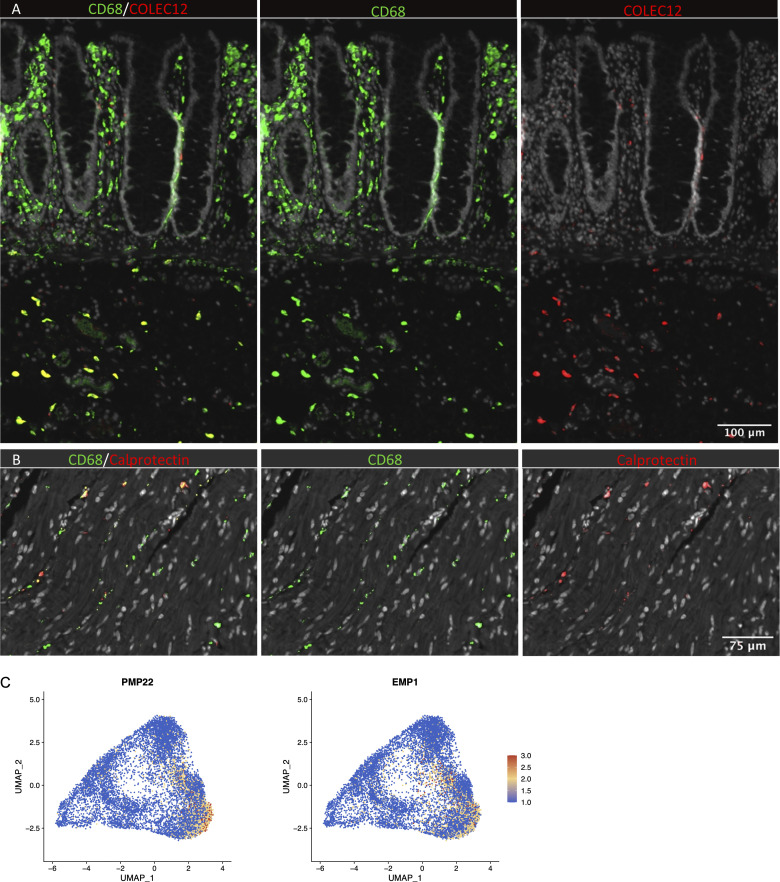
In situ localization of macrophages in human colon and expression of Schwann cell markers. (A) Section of mucosa and submucosa stained for CD68/CD163 (green) and COLEC12 (red). (B) Section of muscularis stained for CD68/CD163 (green) and calprotectin (S100A8/S100A9; red). Sections were counterstained with Hoechst DNA-stain (gray). Representative of n ≥ 3. (C) UMAP plot of MMs showing the expression of PMP22 and EMP1. Expression levels are visualized from low (blue) to high (red) expression.
Collectively, our analyses indicated that the colonic mucosa contains monocyte-derived LpMs that differentiate into multiple LpM subpopulations; some subsets had proinflammatory properties (e.g., LpM2 and LpM6), and other subsets had high antigen-presenting and phagocytic capacity and were strategically positioned in the subepithelial region (LpM9 and LpM10). In contrast, LYVE1+ SmMs displayed a transcriptomic profile indicating low antigen-presenting capacity but high chemotactic and tissue-protective properties.
MMs comprise transcriptionally distinct subsets displaying different developmental trajectories
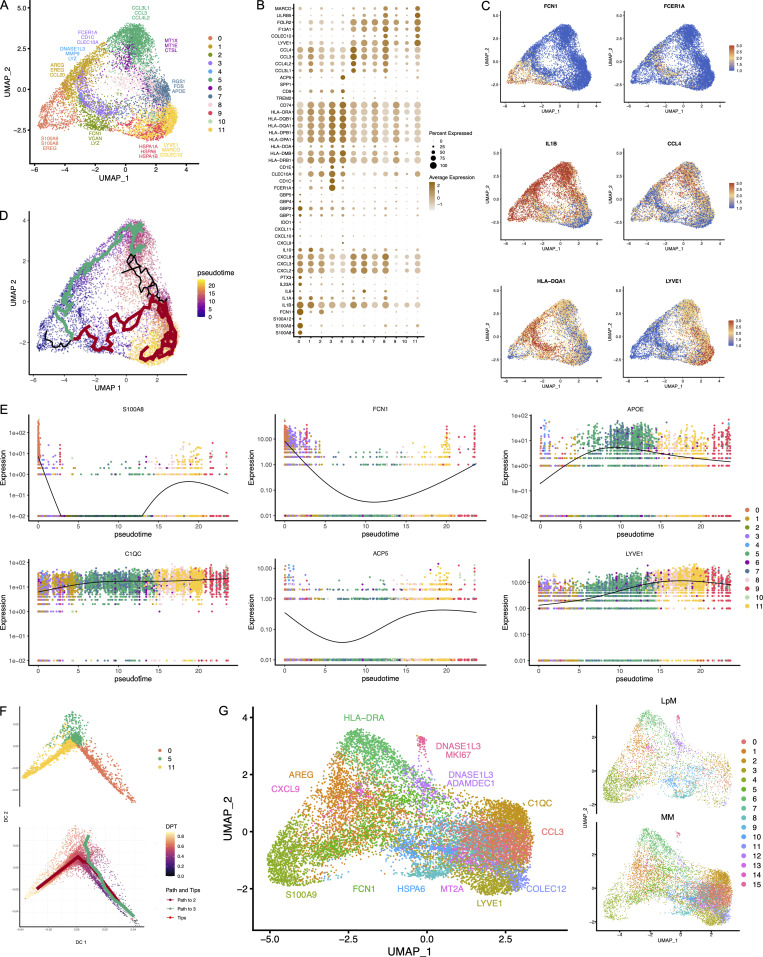
Next, we analyzed macrophages isolated from the muscular compartment. Following high-resolution clustering, the cells were separated into 12 transcriptionally distinct clusters (Figs. 5 A and S2 B) encompassing cells from all donors (Fig. S3 B). In three of the patients, we sampled muscularis propria from two different sites. Clustering analysis revealed that MMs from the sites were very similar (Fig. S2 C), indicating that MM subpopulations were distributed homogeneously throughout the muscular compartment. Cluster 0 (MM0) expressed high levels of S100A8, S100A9, S100A12, IL1B, IL1A, and CXCL chemokines (Fig. 5, B and C), and enriched GO terms were cellular response to bacterium and LPS as well as type I– and IFNγ-mediated signaling pathway, together with MHC class I–mediated antigen presentation (Fig. 3). MM1, MM2, and MM4, which clustered adjacent to MM0, expressed genes associated with immune activation (e.g., HLA class II genes; Fig. 5, B and C), and enriched GO terms were IFNγ-mediated signaling pathway and antigen processing and presentation of exogenous peptide antigen via MHC class II (Fig. 3). Cluster 3 was reminiscent of DC3 (Cytlak et al., 2020; Bourdely et al., 2020; Dutertre et al., 2019), demonstrating that this DC subset also resided in muscularis propria (Fig. S1 D). The clusters transcriptionally most distant from MM0 could be broadly divided into clusters with proinflammatory and homeostatic properties. MM5 (and MM8) expressed high levels of proinflammatory cytokines (e.g., IL1A and IL1B) and multiple chemokines (e.g., CXCL2, CXCL3, CXCL8, CCL3, and CCL4), whereas MM11 expressed low levels of proinflammatory cytokines and chemokines but high levels of genes such as LILRB5, MARCO, LYVE1, FOLR2, and COLEC12 (Fig. 5, B and C). Consistently, enriched GO terms for proinflammatory MM5 were cellular response to LPS and chemokine-mediated signaling pathway, whereas top GO terms for homeostatic MM11 were receptor-mediated endocytosis, synaptic pruning, and apoptotic cell clearance (Fig. 3). Interestingly, high expression of PMP22 and EMP1 genes was observed in MM8 and MM11 (Figs. S2 B and S4 C). These genes are mainly expressed in Schwann cells (Taylor et al., 1995). PMP22 protein is part of the myelin sheath that protects neurons. High expression of PMP22 and EMP1 genes suggests that MMs are phagocytosing Schwann cells and thus are in intimate contact with enteric neurons. Cluster 9, similar to LpM8 in mucosa, expressed high levels of HSP genes (Fig. S2 B), with enriched GO terms such as unfolded protein responses (Fig. 3). HSPs protect against cellular stress, and it was recently shown that increased expression of HSPs in macrophages concomitant with downregulation of IL-1 had antiinflammatory effects in response to change of diet in experimental mice (Brykczynska et al., 2020). In agreement, HSP+ MMs expressed low levels of proinflammatory cytokines and chemokines (Fig. 5 B).
Figure 5.
Cluster analysis, gene expression identification, and pseudotime trajectories for MMs. (A) UMAP representation of 12 clusters (different colors) with annotated highly expressed genes within selected clusters. (B) Dot plot of average expression of selected genes in every cluster. Average expression levels are visualized from low (white) to high (brown) expression. The percentage of positive cells is indicated by circle size. (C) UMAP visualization of selected genes. Expression levels are visualized from low (blue) to high (red) expression. (D) Pseudotime trajectory analysis of MMs using monocle. Cells are labeled by pseudotime colored from blue to yellow. The main branches in the trajectory are colored (green and red). (E) Expression for selected gene expression through pseudotime. Cell colors represent clusters. (F) UMAP representation of clusters 0, 5, and 11 and pseudotime trajectory analysis (lower) of MMs using destiny (Angerer et al., 2016). (G) UMAP of integrated analysis of LpMs and MMs.
Pseudotime trajectory analysis, using random cells in MM0 as root, showed a trajectory following two distinct branches (Fig. 5 D). One branch followed through MM1, MM5, and MM6, clusters expressing many proinflammatory genes. Interestingly, all three subsets shared the GO term “positive regulation of angiogenesis” (Fig. 3). Conversely, the homeostatic branch expressed lower levels of proinflammatory genes (Fig. 5 B) and ended in MM11, the cluster most strongly associated with enteric neurons. As for LpMs, typical monocyte-related genes were rapidly downregulated along the trajectory, whereas TRM genes (e.g., LYVE1, C1QC, and APOE) were rapidly upregulated and found to be more broadly expressed by MMs (Fig. 5 E) than by LpMs (Fig. 2 E). To give further support to these findings, we analyzed the data using Destiny (Angerer et al., 2016; Haghverdi et al., 2015), an efficient R implementation of the diffusion map algorithm. Here we also found as a function of pseudotime that the trajectory divided into two branches that ended in clusters 5 and 11 (Fig. 5 F).
To directly compare the transcriptomic profile of LpMs and MMs, we performed an integrated analysis. Clustering of the two datasets clearly showed that the transcriptomic profile differed between the two compartments. MMs were dominated in clusters expressing genes associated with homeostatic functions in muscularis (e.g., C1QC, COLEC12, LYVE1, and CCL3), whereas LpMs more dominated by clusters expressing proinflammatory genes (e.g., S100A9 and CXCL9) and genes involved in antigen presentation (e.g., HLA-DRA; Fig. 5 G). Interestingly, a small cluster of cells derived from both compartments expressed genes (e.g., MKI67) associated with proliferation.
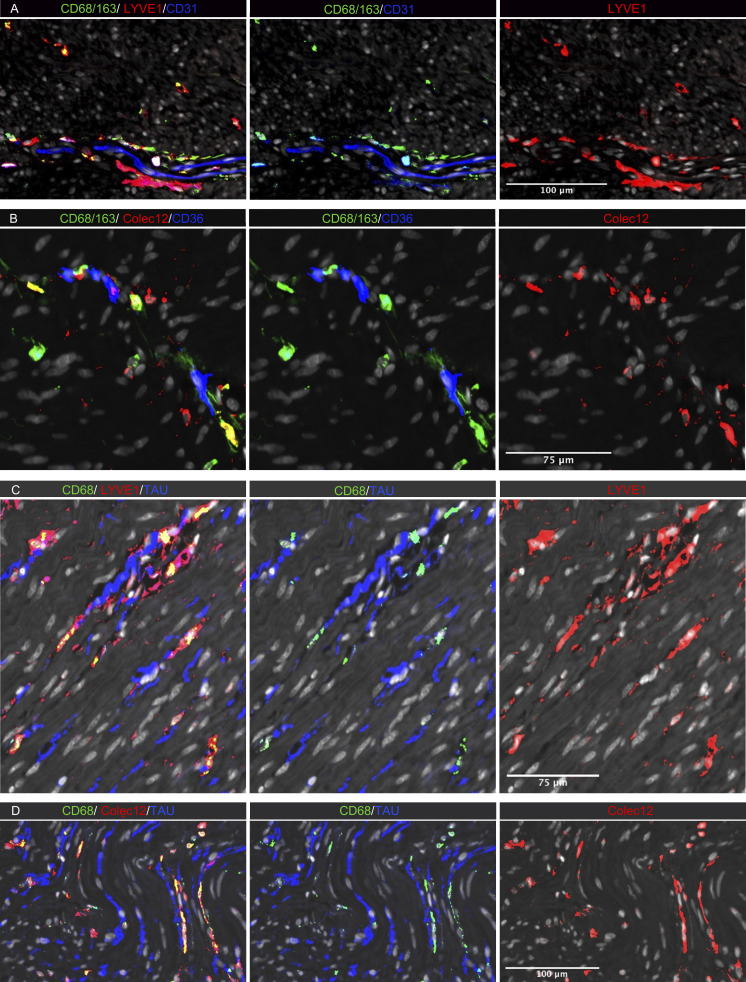
To determine the anatomic localization of MMs, we performed multicolor immunostaining in situ (Fig. 6). A median of 191 MMs/mm2 (n = 5) were detected in muscularis propria, and as in the submucosa, most MMs (median >90%) expressed both LYVE-1 and COLEC12. They were distributed throughout the muscularis tissue but were enriched adjacent to neurons (Fig. 6, C and D) and vessels (Fig. 6, A and B). In addition, a minor fraction of calprotectin+ MMs (median 6%) was found scattered throughout the tissue (Fig. S4 B).
Figure 6.
In situ localization of MMs in human colon. (A–D) Sections stained for (A) CD68/CD163 (green), LYVE-1 (red), and endothelial cell marker CD31 (blue); (B) CD68/CD163 (green), COLEC12 (red), and endothelial cell marker CD36 (blue); (C) CD68 (green), neuron marker tau (blue), and LYVE-1 (red); and (D) CD68 (green), tau (blue), and COLEC12 (red). All sections were counterstained with Hoechst DNA-stain (gray). Representative of n 3.
Together, the results showed that the MM population was very heterogeneous, consisting of multiple functionally distinct subsets. Transcriptomic profiling and pseudotime trajectory analysis revealed significant differences between MMs and their LpM counterparts, indicating that tissue-specific signals from the local microenvironment are important for macrophage differentiation and diversity.
A subpopulation of mucosal and muscularis macrophages express genes compatible with an embryonic origin
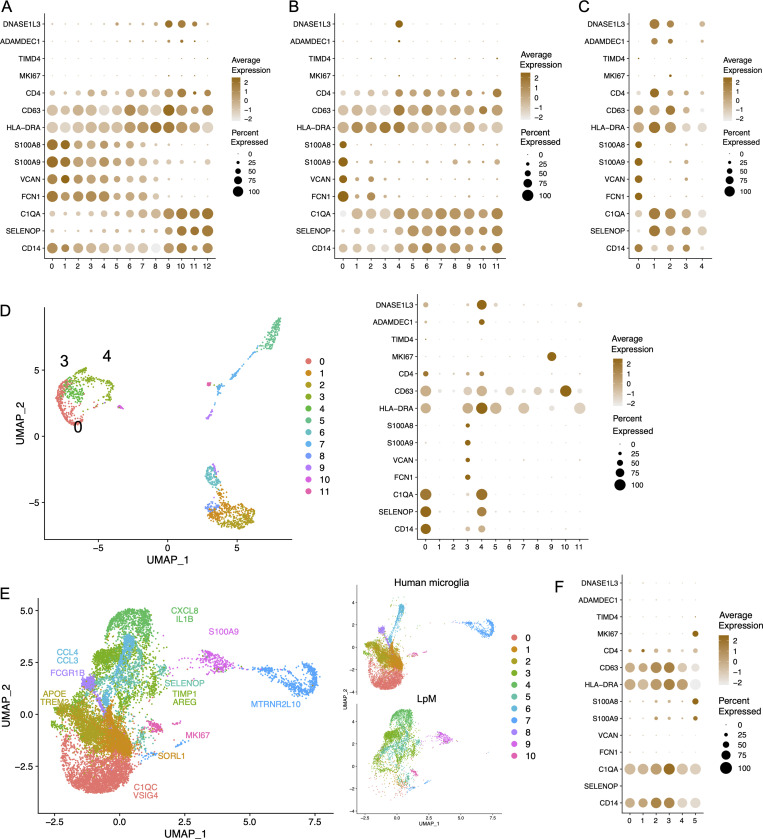
Studies in mice have reported that gut macrophages are composed of both monocyte-derived and embryonic-derived macrophages (De Schepper et al., 2018; Shaw et al., 2018). To analyze whether embryonic-derived macrophages also occurred in adult human colon, we examined genes reported to be differentially expressed between lineages. Interestingly, MM4 and LpM9 (and MM10) showed higher expression of several genes related to embryonic ontogeny, such as CD63, ADAMDEC1, and DNASE1L3 (Fig. 7, A and B; De Schepper et al., 2018; Shaw et al., 2018). Using ClusterMap (Gao et al., 2019), a method to determine cluster similarity across biological samples, we found that MM4 and LpM9 showed the highest similarity index (0.21) when all clusters were compared to each other. Moreover, interestingly, in the integrated analysis, cluster 12 (located closest to proliferating macrophages) expressed the highest levels of ADAMDEC1 and DNASE1L3 (Fig. 5 G). Transcriptomic analysis of the mucosal macrophage dataset from Elmentaite et al. (2021) showed a similar expression profile (Fig. 7 C). To investigate further the possibility that these clusters contained embryonic-derived macrophages, we examined the transcriptomic profile of intestinal macrophages in human embryos. Fawkner-Corbett et al. (2021) recently published a study analyzing human intestinal development using scRNA-seq. Reexamining the immune cell data of embryos at postconception weeks 12–22, we found that intestinal macrophages contained three distinct subpopulations (Fig. 7 D). Cluster 3 expressed high levels of monocyte-related genes such as S100A8, S100A9, VCAN, and FCN1, whereas clusters 0 and 4 expressed higher levels of genes associated with TRMs such as C1QA and SELENOP (Fig. 7 D). Interestingly, only cluster 4 expressed high levels of DNASE1L3 and ADAMDEC1, similar to embryonic-derived macrophages in mouse colon (Fig. 7 D). To examine whether this phenotype could be retrieved in other tissues with a low component of bone marrow–derived cells, we analyzed a recently published dataset of microglial cells isolated from the human brain (Olah et al., 2020). Integration of datasets from LpMs and microglial cells showed that their transcriptomic profiles were very different, with almost no overlap (Fig. 7 E). As expected, few microglial cells expressed monocyte-like genes (e.g., S100A8), and most microglial cells expressed the TRM marker C1QA. However, expression of DNASE1L3 and ADAMDEC1 was not detected (Fig. 7 F).
Figure 7.
Expression of genes associated with embryonic-derived macrophages. (A–C) Dot plot of average expression of selected genes in LpMs (A), MMs (B), and macrophages from Gut Cell Atlas (Elmentaite et al., 2021; C). (D) UMAP plot of embryonic intestinal-derived immune cells (left, macrophage clusters indicated [0, 3, 4]) and dot plot of average expression in fetal macrophage clusters (right). Intestinal samples are from postconception weeks 12–22 (Fawkner-Corbett et al., 2021). (E) UMAPs of integrated analysis of human microglia (Olah et al., 2020) and LpMs. (F) Dot plot of average expression in microglia cell clusters.
Together, these results may suggest that a minor population of gut macrophages in human adults are of embryonic ontogeny. However, the gut “embryonic” signature was not expressed by human microglial cells.
Mucosal and muscularis macrophages interact extensively with resident tissue cells and immune cells
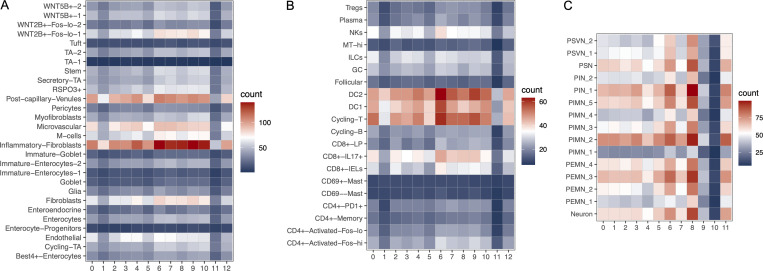
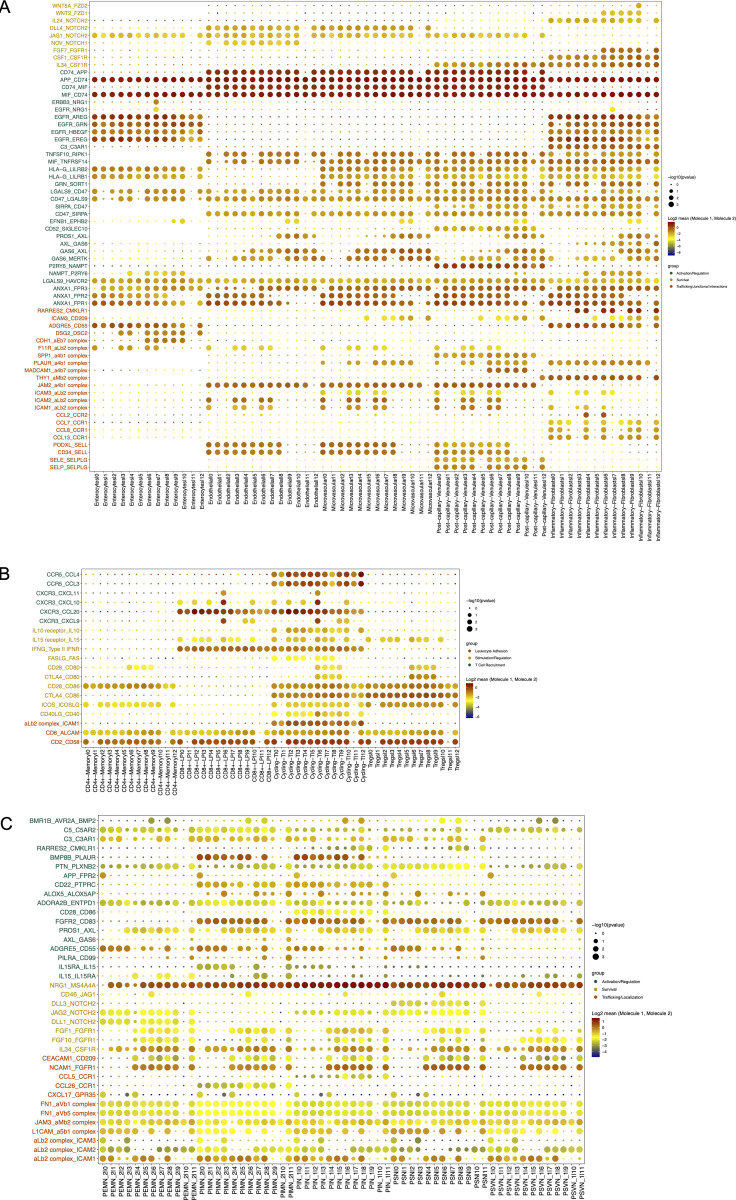
Cell differentiation in tissues is triggered by contacts with other neighboring cells through receptor–ligand interactions. Thus, we interrogated microenvironmental signals that could be involved in the transcriptional reconfiguration process observed in both compartments. We determined such interactions by applying CellPhoneDB2.0 (Efremova et al., 2020), combining our scRNA-seq datasets of LpMs and a published scRNA-seq dataset covering all stromal and immune cells from normal colonic mucosa (Smillie et al., 2019). Numerous statistically significant interactions were found between LpMs and subtypes of fibroblasts, endothelial cells, and epithelial cells (Fig. 8 A). Among receptor-ligand pairs that are particularly important for macrophage survival and differentiation, we found that the CSF1R-ligand cytokines CSF1 and IL34 (Lavin et al., 2015) were expressed by postcapillary venules and activated fibroblasts, whereas genes involved in the Notch signaling pathway (e.g., DLL4/JAG1:NOTCH2) were expressed by epithelial and stromal cells (Fig. S5 A). Endothelial cells and fibroblasts expressed many adhesion molecule and chemokine genes that interacted primarily with LpM0–LpM8. These results agree with the concept that endothelial cells and fibroblasts are involved in the recruitment, migration, and localization of LpMs (Fig. S5 A). LpM9 and LpM10, on the other hand, displayed interactions with epithelial cells (CDH1:aEb7, DSG2:DSC2; Fig. S5 A), consistent with their subepithelial localization (Fig. 4 C). Importantly, stromal and epithelial cells showed several interactions with LpMs that regulate macrophage functions. This included interactions associated with negative regulation of macrophage activation (LGALS9:HAVCR2, HLA-G:LILRB2, HLA-G:LILRB1, and TNFSF10:RIPK1; Chen et al., 2018; Hartwig et al., 2017; Ocana-Guzman et al., 2016), M2-like polarization (GAS6/PROS1:AXL and GAS6:MERTK; Myers et al., 2019; Myers et al., 2019), and “don’t eat me” signals (CD47:SIRPA and CD52:SIGLEC10; Barkal et al., 2019; Li et al., 2021). On the other hand, LpMs expressed ligands (EGFR and ERRB3) for receptor tyrosine kinases expressed by epithelial cells and activated fibroblasts, suggesting a bidirectional regulation of survival and function between LpMs and tissue resident cells. LpMs also showed numerous interactions with immune cell subtypes (Fig. 7 B). In particular, LpM6, LpM7, and LpM9 (as well as DC3-like LpM8), which expressed high levels of MCH class II genes (Fig. 2 B), showed interactions with cycling, memory, and regulatory T cells (e.g., CD28:CD80, CLTA4:CD80, CD28:CD86, and CLTA4:CD86; Fig. S5 B), suggesting that LpM subsets play a role as regulators of T cell responses in the colonic mucosa. Moreover, selective expression of several CXCR3-binding chemokines were expressed by LpM6 (Figs. 2 B and S5 B), indicating a role in the recruitment of CD8 T cells.
Figure 8.
Cell–cell interaction analysis. (A–C) Heatmap representing numbers of receptor-ligand pairs between LpM clusters and subtypes of epithelial and stromal cells (A), immune cell lineages (B), and subtypes of enteric neuronal cells (C) from normal colon.
Figure S5.
Cellular interactions between colonic macrophages and other cell types in colon. (A and B) Dot plot of interactions between LpMs and epithelial cells and stromal cells (A) and immune cells (B). (C) Dot plot of interactions between MMs and subtypes of enteric neurons. Rows represents ligand-receptor pairs, and columns define cell–cell interaction pairs.
Studies in mice have shown that MMs cross talk with enteric neurons (De Schepper et al., 2018; Muller et al., 2014). To interrogate macrophage–neuron interactions in muscularis propria, we analyzed our MM scRNA-seq dataset together with a published scRNA-seq dataset of the human enteric neuron system (Drokhlyansky et al., 2020). A very high number of interactions between multiple neuron subtypes and MMs was found (Fig. 8 C). Central to MM survival and differentiation, several neuron subtypes expressed Notch ligands (DDL1, DDL3, and JAG2) and IL34 interacting NOTCH2 and CSF1R on MMs, respectively. Furthermore, numerous receptor-ligand pairs were involved in macrophage migration, localization, and activation/regulation (Fig. S5 C). Finally, MM–neuron interactions were associated with synapse pruning (C3:C3AR1 and C5:C5AR2; Hong et al., 2016) and neuron stimulation (BMP2:BMPR2), strengthening the notion that there is an extensive cross talk between MMs and enteric neurons in the human colon that controls gastrointestinal motility (De Schepper et al., 2018; Muller et al., 2014). Together, our results indicated that macrophages interact extensively with tissue-resident cells in both compartments, compatible with the concept that the local microenvironment is important for imprinting of macrophage specialization and niche-specific localization.
Gene regulatory network analysis indicates that a limited number of TFs control macrophage differentiation and diversity
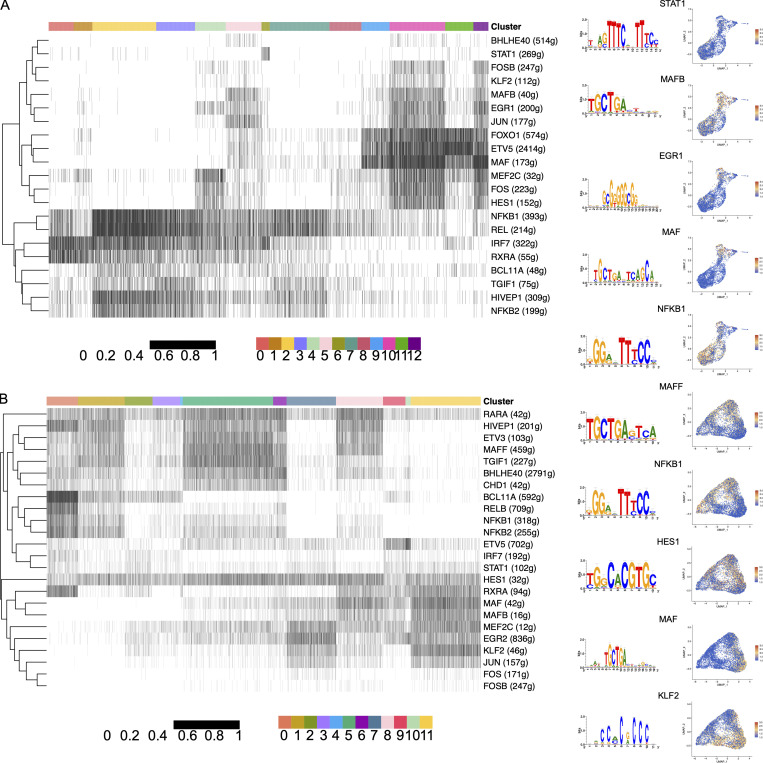
To identify TFs that may control transcriptional programming of LpMs and MMs, we used single-cell regulatory network inference and clustering (SCENIC; Van de Sande et al., 2020) to determine sets of genes coexpressed with their associated TFs (regulons). We found a total of 185 and 187 regulons (active in >1% of the cells) for LpMs and MMs, respectively, with significantly enriched motifs for the corresponding TFs. By ordering macrophage clusters along the pseudotime trajectory, we identified a restricted number of regulons corresponding to specific clusters. LpM0 showed increased regulon activity corresponding to RXRA and IRF7, whereas LpM2 was associated with several NF-κB family members (NFKB1, NFKB2, and REL; Fig. 9 A). LpM6 was associated with STAT1, whereas LpM8–LpM11 and LYVE1+ SmMs showed regulon activity driven by TFs such as MAF, MAFB, HES1, and EGR1. MAF and MAFB are known for their role in driving terminal macrophage differentiation (Aziz et al., 2009).
Figure 9.
Identification of TF modules based on regulon activities in LpMs and MMs. (A and B) Binarized heatmaps of regulon activity in LpMs (A) and MMs (B) with the representative TF and part of their binding motifs. Numbers in parentheses indicate the number of genes enriched in the regulons, and UMAP plots show expression of selected TF.
The gene regulatory network in MMs showed similarities with LpMs (Fig. 9 B). MM0 showed regulon activity corresponding to NF-κB family members (NFKB1, RELB, and BCL11A), whereas regulons corresponding to MAF and MAFB were upregulated in MM11. On the other hand, MM5 (and to a lesser extent MM8) expressed regulons corresponding to TFs such as MAFF, RARA, and BHLHE40, not found in the mucosal compartment. Interestingly, regulon activity with corresponding HES1 was broadly expressed by MMs and by subsets of LpMs (Fig. 8, A and B). HES1 is a classic TF downstream of the Notch signaling pathway (Sharma et al., 2020). Together with our cell–cell interaction data (Fig. S5, A and C), expression of HES1 suggests that the Notch signaling pathway is involved in reprogramming of LpMs and MMs, as shown for monocyte-derived macrophages in the liver (Ramachandran et al., 2019; Sharma et al., 2020). In summary, we found that regulon activity corresponds to distinct macrophage clusters following the pseudotime trajectory, indicating that a limited number of key TFs control the process of monocyte-to-macrophage differentiation observed in both compartments.
Discussion
Using high-resolution spatiotemporal single-cell analysis, we show that macrophage populations in mucosa and muscularis propria of the human colon contain multiple transcriptionally distinct subsets that display niche-specific localizations and functional properties. Our results also reveal tissue-specific cell–cell interactions and a limited number of TFs that may be key players in the extensive monocyte-to-macrophage reprogramming and subtissular-specific localization observed.
Studies in mice show that macrophages in different organs display functional differences imprinted by tissue-specific cues from the local microenvironment (Guilliams et al., 2020; Okabe and Medzhitov, 2014). Moreover, it was recently shown that heterogeneous macrophages with different transcriptional programs are governed by subtissular niches (Chakarov et al., 2019). Therefore, to understand the functional diversity of macrophages within a tissue, detailed spatiotemporal characterization of the macrophage population and their interactions with neighboring cells is needed. However, the nature of molecular signals that drive macrophage differentiation in the human gut is poorly characterized. Studies in humans and mice have clearly shown that mucosal macrophages in the intestine largely originate from bone marrow–derived monocytes (Bain et al., 2014; Bujko et al., 2018). Thus, probing colonic mucosal macrophages in histologically normal tissue is a unique possibility to study the monocyte-to-macrophage differentiation process in situ under steady-state conditions.
Integration of our data suggests that circulating monocytes are elicited through postcapillary venules in the crypt area, after which some cells rapidly differentiate into different types of proinflammatory macrophages and others migrate to the subepithelial region, where they upregulate expression of genes related to endocytosis, wound healing, and antigen presentation, while concomitantly downregulating proinflammatory genes. This latter subpopulation is thus ideally equipped to maintain mucosal barrier integrity with minimal collateral damage.
Our cell–cell communication analysis suggested that the survival, migration, and differentiation of LpMs are controlled by extensive interaction with tissue-resident cells (endothelial cells, fibroblasts, and epithelial cells). Stromal cells may provide a supply of macrophage-trophic factors (e.g., CSF-1 and IL-34), which are crucial for macrophage development and survival (Lavin et al., 2015), whereas several cell types expressed Notch ligands, suggesting that the Notch signaling pathway plays a role in monocyte-to-macrophage reprogramming (Sharma et al., 2020). Several receptor-ligand pairs identified have been shown to have inhibitory or antiinflammatory effects on macrophages, in line with the idea that most tissue macrophages are tolerogenic under steady-state conditions. Interestingly, however, many of these macrophage genes have been shown to promote tumor growth and may be targets for cancer immunotherapy (e.g., SIRPA, SIGLEC10, AXL, MERTK, and RIPK1; Barkal et al., 2019; Li et al., 2021; Myers et al., 2019; Wang et al., 2018). Thus, in strategies to target these genes to treat cancer, possible side effects should be taken into account, such as drug-induced colitis, as observed by current checkpoint inhibition (Luoma et al., 2020).
Our gene regulatory network analysis identified cluster-specific TFs that are likely to control subset-specific transcriptional programs, which strengthens the idea that the LpM population contains multiple transcriptionally stable macrophage subsets that coexist in the tissue. Interestingly, the transcriptomic profile of several LpM subsets is similar to that of macrophages associated with various inflammatory and fibrotic diseases (Martin et al., 2019; Qu et al., 2020; Ramachandran et al., 2019). This suggests that these disease-promoting macrophages also play a role under steady-state conditions, but that the relative contribution of functionally different LpM subsets is important for maintenance of homeostasis.
Analysis of muscularis propria showed that many MMs were positioned in close contact with nerves, and cell–cell interaction analysis displayed numerous MM–neuron interactions. Such interactions included BMP2:BMP2R and CSF1R:IL34. As previously shown in mouse models (Gabanyi et al., 2016), this finding suggests that MMs expressing BMP2 regulate peristaltic motility in the colon by activating BMP2R on enteric neurons, whereas neurons expressing IL34 feedback on CSF1R+ MMs by stimulating their survival and differentiation. Most MMs expressed high levels of C1Q genes, and we identified interactions between genes of the complement system (C3:C3AR1 and C5:C5AR2), suggesting that MMs are involved in synapse pruning (Stephan et al., 2012). Finally, MMs contained transcripts specific for Schwann cells, indicating that MMs phagocytose cellular material from such nerve-protecting cells. Together, these findings are in agreement with the concept that MM–neuron cross talk plays a pivotal role in gut homeostasis (De Schepper et al., 2018; Muller et al., 2014). MMs were also positioned adjacent to vessels, and the GO term “positive regulation of angiogenesis” was enriched in MM1, MM5, and MM6. Pseudotime trajectory analysis showed that these subsets were found along the proinflammatory branch, whereas neuron-associated MM subsets (first of all MM11) were linked to the homeostatic branch. This suggests that functionally specialized neuron- and blood vessel–associated MMs coexist in the human colon to ensure proper functioning of enteric neurons and blood vessels, respectively (De Schepper et al., 2018).
Several studies in mice have suggested that macrophages important for vascular integrity selectively express LYVE-1 (Chakarov et al., 2019; Lim et al., 2018). However, we found that the vast majority of MMs, those associated with both vessels and nerves, expressed LVYE-1 and COLEC12, and we were not able to distinguish these subsets by in situ staining. We also identified calprotectin+ MMs scattered throughout the muscularis propria. Clustering and pseudotime trajectory analysis strongly suggested that the vast majority of TRMs found in the muscularis propria originated from these incoming monocytes. Macrophages are the dominating leukocyte population in muscularis propria and submucosa. Interestingly, to this end, we found that MM subsets and SmM expressed high levels of several monocyte-attracting chemokines (e.g., CCL3, CCL4, CCL3L1, and CCL4L2), suggesting that TRMs in these compartments are important for continuous recruitment of monocytes.
Somewhat surprisingly, we found that subpopulations of LpMs and MMs showed phenotypic similarities with embryonic-derived macrophages in mouse colon (De Schepper et al., 2018) and with colonic macrophages in human fetus (Fawkner-Corbett et al., 2021). As far as we know there are no established markers to separate embryonic-derived from bone marrow monocyte–derived macrophages in humans, and evidence to suggest that human macrophages in adult life originate from embryonic precursors is sparse. We and others have shown that human macrophages in various tissues may live for several years (Eguiluz-Gracia et al., 2016; Patel et al., 2021). However, the origin of these long-lived cells has not been determined.
The embryonic signature was not detected in a dataset of human microglial cells, and others have shown that a transcriptional program of fetal macrophages reemerges in skin macrophages during inflammation (Reynolds et al., 2021). However, it is intriguing that a small subset of human colonic macrophages under steady-state conditions in adults express markers similar to macrophages in fetal colon, and that this subset is transcriptionally close to “proliferating” macrophages (Fig. 5 G). Thus, it should be studied further whether genes such as DNASE1L3 and ADAMDEC1 could be useful markers to distinguish macrophage lineages in the human intestine.
Together, these results show that LpMs and MMs are extremely heterogeneous and consist of several subsets with distinct functional properties. It appears that maintenance of homeostasis depends on coexistence of both proinflammatory and protective/homeostatic subtypes. Our data also give insights into cell–cell interactions and key TFs that are likely to control tissue-specific macrophage reprogramming. This work constitutes an important framework to understand the complexity of macrophage biology in the human gut and to identify potential targets to better treat inflammatory disorders and cancer in the future.
Materials and methods
Patients and tissue samples
Colonic resections were obtained from patients receiving surgery for colon cancer at Akershus University Hospital (Ahus). The resected colon was immediately examined by an experienced pathologist, and macroscopically normal colon tissue, ≥10 cm from the tumor, was placed in vials with RPMI 1640 and put on ice for transport. The study was performed in accordance with the Declaration of Helsinki. Written informed consent was obtained from all participants, and the study was approved by the Regional Committee for Medical Research Ethics (REK, 2018/703, Health Region South-East, Norway). For scRNA-seq, specimens from sigmoid colon were obtained (age 62–78 yr, three males, n = 4). For immunofluorescence staining, samples from ascending, transverse, descending, and sigmoid colon were included (age 62–78 yr, four males, n = 8). None of the patients had autoimmune, infectious, or inflammatory diseases or had received neoadjuvant chemotherapy or radiation therapy before the operation. All patients received surgery according to the national guidelines.
Single-cell dissociation
Resected colonic tissues were processed within 2 h after removal from the patient. Single-cell suspensions of colonic resections were obtained using a modified version of a previously published protocol (Bujko et al., 2018). The intestinal specimens were opened longitudinally and washed in Dulbecco’s PBS. The muscularis propria was first removed with scissors, after which the mucosa was dissected in narrow strips. The mucosal fragments were then incubated with shaking in PBS with 2 mM EDTA (Sigma-Aldrich) and 1% FCS (Sigma-Aldrich) three times for 15 min at 37°C. The remaining tissue was minced and digested with stirring for 60 min in complete RPMI (RPMI 1640 [Lonza] supplemented with 10% FCS, 1% penicillin/streptomycin [Lonza] and containing 0.25 mg/ml Liberase TL [Roche] and 20 U/ml DNase I [Sigma-Aldrich]). Digested cell suspension was passed through a 100-µm filter and washed.
Flow cytometry and cell sorting
Released tissue cells were stained in aliquots of 1 × 10⁶ cells/100 μl PBS with 2% FCS (Gibco) and 0.1% NaN3 for 30 min on ice. Nonspecific staining was blocked with 10 μl FcR Blocking Reagent (Miltenyi Biotec) before staining. Dead cells were excluded by TO-PRO-1 Iodide (Thermo Fisher Scientific) or Fixable Viability Dye eFluor 780 (eBioscience) staining. Analysis was performed with a BD LSRFortessa X-20 and sorting with a FACS Aria IIIu (BD Biosciences) running BD FACSDIVA 9.0 software. Purity of >98% was achieved in sorted populations. Data were processed with FlowJo 10.6.1 (TreeStar). Intracellular staining was performed after surface staining, using a Fixation & Permeabilization Buffer Set (eBioscience) according to the manufacturer’s instructions. The following antibodies were used for staining: HLA-DR PerCP/Cy5.5 (307630, clone L243), CD45 BV510 (103138, clone 30-F11), CD3 FITC (300406, clone UCHT1), CD19 Ax488 (302219, clone HIB19), CD14 APC (325608, clone HCD14), CD14 PE/Cy7 (325618, clone HCD14), CD1c BV421 (331526, clone L161), and FcεRI PE (334610, clone AER-37) from BioLegend; FcR Blocking Reagent (130-059-901) and CD141 PE (130-113-318, clone AD5-14H12) from Miltenyi Biotec; CD14 PE/Cy7 (562698, clone MφP9) and CD11c APC (333144, clone S-HCL-3) from BD Biosciences; epithelial antigen FITC (F0860, clone Ber-EP4) from Agilent; C1Q FITC (F025402-2) from Dako; and calprotectin PE (MCA874PE, clone MAC387) from Bio-Rad.
scRNA-seq
Cellular suspensions (∼15,000 cells, with expected recovery of ∼7,500 cells) of sorted CD45+HLA-DR+CD14+ macrophages from colonic mucosa and muscularis propria were loaded on the 10X Chromium Controller instrument (10X Genomics) according to the manufacturer’s protocol using 10X GEMCode proprietary technology. All samples from individual patients were loaded in one batch. The Chromium Single Cell 3′ v2 Reagent kit (10X Genomics) was used to generate the cDNA and prepare the libraries, according to the manufacturer’s protocol. The libraries were then equimolarly pooled and sequenced on an Illumina NextSeq500 using HighOutput flow cells v2.5. A coverage of 400 million reads per sample was targeted to obtain 50,000 reads per cell. The raw data were then demultiplexed and processed with the Cell Ranger software (10X Genomics) v2.1.1.
Preprocessing scRNA-seq data
In total, we analyzed 63,917 human cells from donors (n = 4). We aligned the reads of the input dataset to the GRCh38 reference genomes and estimated cell-containing partitions and associated unique molecular identifiers using the Cell Ranger Chromium Single Cell RNA-seq v3.0.2. We performed data preparation using Seurat R packages. Genes expressed in fewer than three cells in a sample were excluded, as well as cells that expressed fewer than 200 genes and mitochondrial gene content >5% of the total unique molecular identifier count. We normalized data by using gene counts for each cell that were divided by the total counts for that cell and multiplied by 10,000 and then log-transformed. Subsequently, we identified genes that were outliers on a mean variability plot using the vst method with 2,000 genes. For mucosa and muscularis data, we separately found integration anchors and then performed data integration using a precomputed anchorSet with default parameters. Finally, we scaled data and centered genes in the dataset using linear model.
Dimensionality reduction, clustering, and differential expression analysis and data integration
We ran principal component analysis dimensionality reduction with 30 principal components to compute and store (on 2,000 variable genes). We estimated dimensions of reduction parameter (for LpM = 13 and for MM type = 20) and constructed a shared nearest neighbor graph for given datasets. We first determined the k-nearest neighbors of each cell. We used this k-nearest neighbor graph to construct the shared nearest neighbor graph by calculating the neighborhood overlap (Jaccard index) between every cell and its 20 nearest neighbors. To obtain the resolution parameter, we used the clustree R package, with resolution varying from 0.1 to 2.0. We got resolution parameters for LpM = 0.7 and for MM = 0.6. We then ran the UMAP dimensional reduction technique with principal component analysis dimension reduction and found DEGs for each of the clusters in the datasets.
For data integration and batch correction, we used Seurat integration methods FindIntegrationAnchors and IntegrateData, with default parameters. We applied integration for LpMs and MMs, microglial cells (Olah et al., 2020), and LpMs, and LpMs and macrophages from Gut Cell Atlas (Elmentaite et al., 2021).
All heatmaps, UMAP visualizations, violin plots, and dot plots were produced using Seurat functions in conjunction with the ggplot2, pheatmap, and grid R packages. ClusterMap (Gao et al., 2019) was used to compute a similarity metric for subclusters between LpMs and MMs.
Developmental trajectory inference and transcriptional regulation
To generate pseudotemporal dynamics, we used the Monocle R package. We ordered cells in a semisupervised manner based on their Seurat clustering, scaled the resulting pseudotime values from 0 to 1, and mapped them onto UMAP visualizations generated by Seurat. DEGs along this trajectory were identified using Moran’s I test. To perform pseudotime trajectory analysis, we also used diffusion maps with default parameters setup from Destiny R package (Angerer et al., 2016).
For TF analysis, we obtained a list of all genes identified as human TFs. To analyze TF regulons further, we adopted Single Cell Regulatory Network Inference and Clustering (SCENIC; Van de Sande et al., 2020), using default parameters and the normalized data matrices from Seurat as input. SCENIC is a combination of three packages (GENIE3, RcisTarget, and AUCell). For motif visualization, we obtained the highest normalized enrichment score of the motif in the gene set.
Identification of significant ligand-receptor pairs
For comprehensive systematic analysis of interlineage interactions, we used CellPhoneDB2.0 (Efremova et al., 2020). CellPhoneDB2.0 is a manually curated repository of ligands, receptors, and their interactions, integrated with a statistical package for inferring cell–cell communication networks from single-cell transcriptomic data. This package searches for ligand–receptor interactions and outputs multiple result files based on curated databases such as UniProt, IUPHAR, and Ensembl.
Each dataset was analyzed using matrices from Seurat and datasets covering epithelial, endothelial, fibroblast, and immune cell (Smillie et al., 2019) subsets and enteric neurons (Drokhlyansky et al., 2020). Significant ligand-receptor pairs identified from datasets, with adjusted P value <0.05, were extracted, requiring the ligand and receptor to be expressed in ≥10% of the cells.
Immunofluorescence staining
Sections of formalin-fixed and paraffin-embedded tissue were cut in series at 4 µm, mounted on Superfrost Plus object glasses (Thermo Fisher Scientific), and washed sequentially in xylene, ethanol, and PBS. Heat-induced epitope retrieval was performed by boiling sections for 20 min in citrate buffer (pH 6.0) and cooling to room temperature (RT) before staining. Sections were incubated with mixtures of primary antibodies for 1 h at 37°C, rinsed in PBS, and incubated with secondary antibodies for 1.5 h at RT. The following primary antibodies were used: CD68 (M087601-2, clone PG-M1), C1q Complement/FITC (F025402-2), and CD31 (M082329-2, clone JC70A) from Dako Agilent; CD36 (14347S, clone D8L9T) and Tau (4019S) from Cell Signaling Technology; LYVE1 (ab10278) and ACP5 (ab238033, clone rACP5/1070) from Abcam; CD163 (NCL-L-CD163) from Leica Biosystems; C25H (LS-B14159-50, clone aa142-247) from LS Bio; Colec12/CL-P1 (AF2690) from RD Systems; and anti-human calprotectin from Calpro. The following reagents served as secondary antibodies: donkey anti-goat IgG Alexa Fluor 555 (A-21432), donkey anti-rabbit IgG Alexa Fluor 647 (A-31573), goat anti-mouse IgG3 Alexa Fluor 488 (A-21151), donkey anti-mouse IgG Alexa Fluor 488 (A-21202), goat anti-mouse IgG1 Alexa Fluor 555 (A-21127), goat anti-mouse IgG2b Alexa Fluor 555 (A-21147), and goat anti-mouse IgG1 Alexa Fluor 647 (A-21240) from Thermo Fisher Scientific; donkey anti-rabbit IgG Cy3 (711-165-152) from Jackson ImmunoResearch; rat anti-mouse IgG3 Alexa Fluor 488 (clone SB76b, ab172328) from Abcam; and rat anti-mouse IgG1-Alexa Fluor 647 (clone SB77e, 1144-31) from SouthernBiotech. Sections were then incubated for 5 min at RT in Hoechst 33342 nucleic acid stain (Thermo Fisher Scientific), and stained sections were mounted with ProLong Glass Antifade mountant (Molecular Probes). Laser scanning confocal microscopy was performed by acquiring tile scans on an Andor Dragonfly equipped with a fusion stitcher. The Andor Dragonfly was built on a Nikon TiE inverted microscope equipped with a 60×/1.40-NA oil-immersion objective. To determine cell densities, the total number of positive cells for all staining combinations was counted in an average of 1.7-mm2 tissue area for every patient in both the mucosa and muscularis propria.
Online supplemental material
Fig. S1 shows the sorting strategy, feature plots of canonical macrophage markers, and flow cytometric detection of DC3. Fig. S2 shows heatmaps of top DEGs in LPM and MM clusters. Fig. S3 shows sample representation in clusters. Fig. S4 shows in situ immunostaining of COLEC12 and Calprotectin, as well as feature plots of Schwann cell markers in MMs. Fig. S5 shows bubble plots of ligand-receptor pairs between macrophages and other colonic cells.
Acknowledgments
We thank all patients and staff at Akershus University Hospital for providing tissue samples. Dr. Susanne Lorenz at the Genomics Core Facility at Oslo University Hospital is greatly acknowledged for supervising the sequencing. We also thank Dr. Frode Skjeldal at the Oslo NorMIC imaging platform at the Department of Biosciences, University of Oslo, for expert help with confocal microscopy analysis. Kjersti Thorvaldsen Hagen is greatly acknowledged for technical help with tissue processing and immunostainings.
This work was supported by grants from the Norwegian Cancer Society and Southern and Eastern Norway Regional Health Authority.
Author contributions: Conceptualization, F.L. Jahnsen and E.S. Bækkevold; Methodology, F.L. Jahnsen, E.S. Bækkevold, D. Domanska, and U. Majid; Software, D. Domanska; Formal analysis, D. Domanska; Investigation, E.S. Bækkevold, U. Majid, F.L. Jahnsen, S. Yaqub, M.A. Merok, V.T. Karlsen, and A.-C.R. Beitnes; Writing—Original Draft, F.L. Beitnes, E.S. Bækkevold, D. Domanska, and U. Majid; Visualization, D. Domanska, F.L. Jahnsen, E.S. Bækkevold, and U. Majid.
Data availability
scRNA-seq datasets generated in this study are deposited in the European Genome-Phenome Archive under the following accession numbers: EGAD00001007765 and EGAS00001005377. In addition, all data are available upon request.
Reference datasets used in this study are as follows: human ulcerative colitis scRNA-seq dataset (Smillie et al., 2019) Single Cell Portal: SCP259; human enteric neuron system scRNAseq dataset (Drokhlyansky et al., 2020) Broad Insitute Single Cell Portal: SCP1038; human fetal intestinal scRNA-seq dataset (Fawkner-Corbett et al., 2021) Gene Expression Omnibus: GSE158702; GUT HUMAN ATLAS scRNA-seq dataset (Elmentaite et al., 2021) https://www.gutcellatlas.org/; and human microglia scRNA-seq dataset (Olah et al., 2020; https://www.synapse.org/#!Synapse:syn21438358).
References
- Angerer, P., Haghverdi L., Buttner M., Theis F.J., Marr C., and Buettner F.. 2016. Destiny: diffusion maps for large-scale single-cell data in R. Bioinformatics. 32:1241–1243. 10.1093/bioinformatics/btv715 [DOI] [PubMed] [Google Scholar]
- Arandjelovic, S., and Ravichandran K.S.. 2015. Phagocytosis of apoptotic cells in homeostasis. Nat. Immunol. 16:907–917. 10.1038/ni.3253 [DOI] [PMC free article] [PubMed] [Google Scholar]
- Aziz, A., Soucie E., Sarrazin S., and Sieweke M.H.. 2009. MafB/c-Maf deficiency enables self-renewal of differentiated functional macrophages. Science. 326:867–871. 10.1126/science.1176056 [DOI] [PubMed] [Google Scholar]
- Bain, C.C., Bravo-Blas A., Scott C.L., Perdiguero E.G., Geissmann F., Henri S., Malissen B., Osborne L.C., Artis D., and Mowat A.M.. 2014. Constant replenishment from circulating monocytes maintains the macrophage pool in the intestine of adult mice. Nat. Immunol. 15:929–937. 10.1038/ni.2967 [DOI] [PMC free article] [PubMed] [Google Scholar]
- Barkal, A.A., Brewer R.E., Markovic M., Kowarsky M., Barkal S.A., Zaro B.W., Krishnan V., Hatakeyama J., Dorigo O., Barkal L.J., and Weissman I.L.. 2019. CD24 signalling through macrophage Siglec-10 is a target for cancer immunotherapy. Nature. 572:392–396. 10.1038/s41586-019-1456-0 [DOI] [PMC free article] [PubMed] [Google Scholar]
- Bleriot, C., Chakarov S., and Ginhoux F.. 2020. Determinants of resident tissue macrophage identity and function. Immunity. 52:957–970. 10.1016/j.immuni.2020.05.014 [DOI] [PubMed] [Google Scholar]
- Bogie, J.F., Mailleux J., Wouters E., Jorissen W., Grajchen E., Vanmol J., Wouters K., Hellings N., van Horssen J, Vanmierlo T., and Hendriks J.J.. 2017. Scavenger receptor collectin placenta 1 is a novel receptor involved in the uptake of myelin by phagocytes. Sci. Rep. 7:44794. 10.1038/srep44794 [DOI] [PMC free article] [PubMed] [Google Scholar]
- Bourdely, P., Anselmi G., Vaivode K., Ramos R.N., Missolo-Koussou Y., Hidalgo S., Tosselo J., Nunez N., Richer W., Vincent-Salomon A., et al. 2020. Transcriptional and functional analysis of CD1c+ human dendritic cells identifies a CD163+ subset priming CD8+CD103+ T cells. Immunity. 53:335–352.e8. 10.1016/j.immuni.2020.06.002 [DOI] [PMC free article] [PubMed] [Google Scholar]
- Brykczynska, U., Geigges M., Wiedemann S.J., Dror E., Boni-Schnetzler M., Hess C., Donath M.Y., and Paro R.. 2020. Distinct transcriptional responses across tissue-resident macrophages to short-term and long-term metabolic challenge. Cell Rep. 30:1627–1643.e7. 10.1016/j.celrep.2020.01.005 [DOI] [PubMed] [Google Scholar]
- Bujko, A., Atlasy N., Landsverk O.J.B., Richter L., Yaqub S., Horneland R., Øyen O., Aandahl E.M., Aabakken L., Stunnenberg H.G., et al. 2018. Transcriptional and functional profiling defines human small intestinal macrophage subsets. J. Exp. Med. 215:441–458. 10.1084/jem.20170057 [DOI] [PMC free article] [PubMed] [Google Scholar]
- Chakarov, S., Lim H.Y., Tan L., Lim S.Y., See P., Lum J., Zhang X.M., Foo S., Nakamizo S., Duan K., et al. 2019. Two distinct interstitial macrophage populations coexist across tissues in specific subtissular niches. Science. 363:eaau0964. 10.1126/science.aau0964 [DOI] [PubMed] [Google Scholar]
- Chen, H.M., van der Touw W., Wang Y.S., Kang K., Mai S., Zhang J., Alsina-Beauchamp D., Duty J.A., Mungamuri S.K., Zhang B., et al. 2018. Blocking immunoinhibitory receptor LILRB2 reprograms tumor-associated myeloid cells and promotes antitumor immunity. J. Clin. Invest. 128:5647–5662. 10.1172/JCI97570 [DOI] [PMC free article] [PubMed] [Google Scholar]
- Chikina, A.S., Nadalin F., Maurin M., San-Roman M., Thomas-Bonafos T., Li X.V., Lameiras S., Baulande S., Henri S., Malissen B., et al. 2020. Macrophages maintain epithelium integrity by limiting fungal product absorption. Cell. 183:411–428.e16. 10.1016/j.cell.2020.08.048 [DOI] [PMC free article] [PubMed] [Google Scholar]
- Cytlak, U., Resteu A., Pagan S., Green K., Milne P., Maisuria S., McDonald D., Hulme G., Filby A., Carpenter B., et al. 2020. Differential IRF8 transcription factor requirement defines two pathways of dendritic cell development in humans. Immunity. 53:353–370.e8. 10.1016/j.immuni.2020.07.003 [DOI] [PMC free article] [PubMed] [Google Scholar]
- De Schepper, S., Verheijden S., Aguilera-Lizarraga J., Viola M.F., Boesmans W., Stakenborg N., Voytyuk I., Schmidt I., Boeckx B., Dierckx de Casterle I., et al. 2018. Self-maintaining gut macrophages are essential for intestinal homeostasis. Cell. 175:400–415.e13. 10.1016/j.cell.2018.07.048 [DOI] [PubMed] [Google Scholar]
- Drokhlyansky, E., Smillie C.S., Van Wittenberghe N., Ericsson M., Griffin G.K., Eraslan G., Dionne D., Cuoco M.S., Goder-Reiser M.N., Sharova T., et al. 2020. The human and mouse enteric nervous system at single-cell resolution. Cell. 182:1606–1622.e23. 10.1016/j.cell.2020.08.003 [DOI] [PMC free article] [PubMed] [Google Scholar]
- Dutertre, C.A., Becht E., Irac S.E., Khalilnezhad A., Narang V., Khalilnezhad S., Ng P.Y., van den Hoogen L.L., Leong J.Y., Lee B., et al. 2019. Single-cell analysis of human mononuclear phagocytes reveals subset-defining markers and identifies circulating inflammatory dendritic cells. Immunity. 51:573–589.e8. 10.1016/j.immuni.2019.08.008 [DOI] [PubMed] [Google Scholar]
- Earley, A.M., Graves C.L., and Shiau C.E.. 2018. Critical role for a subset of intestinal macrophages in shaping gut microbiota in adult zebrafish. Cell Rep. 25:424–436. 10.1016/j.celrep.2018.09.025 [DOI] [PMC free article] [PubMed] [Google Scholar]
- Efremova, M., Vento-Tormo M., Teichmann S.A., and Vento-Tormo R.. 2020. CellPhoneDB: Inferring cell–cell communication from combined expression of multi-subunit ligand-receptor complexes. Nat. Protoc. 15:1484–1506. 10.1038/s41596-020-0292-x [DOI] [PubMed] [Google Scholar]
- Eguiluz-Gracia, I., Schultz H.H., Sikkeland L.I., Danilova E., Holm A.M., Pronk C.J., Agace W.W., Iversen M., Andersen C., Jahnsen F.L., and Baekkevold E.S.. 2016. Long-term persistence of human donor alveolar macrophages in lung transplant recipients. Thorax. 71:1006–1011. 10.1136/thoraxjnl-2016-208292 [DOI] [PubMed] [Google Scholar]
- Elmentaite, R., Kumasaka N., Roberts K., Fleming A., Dann E., King H.W., Kleshchevnikov V., Dabrowska M., Pritchard S., Bolt L., et al. 2021. Cells of the human intestinal tract mapped across space and time. Nature. 597:250–255. 10.1038/s41586-021-03852-1 [DOI] [PMC free article] [PubMed] [Google Scholar]
- Fawkner-Corbett, D., Antanaviciute A., Parikh K., Jagielowicz M., Geros A.S., Gupta T., Ashley N., Khamis D., Fowler D., Morrissey E., et al. 2021. Spatiotemporal analysis of human intestinal development at single-cell resolution. Cell. 184:810–826.e23. 10.1016/j.cell.2020.12.016 [DOI] [PMC free article] [PubMed] [Google Scholar]
- Gabanyi, I., Muller P.A., Feighery L., Oliveira T.Y., Costa-Pinto F.A., and Mucida D.. 2016. Neuro-immune interactions drive tissue programming in intestinal macrophages. Cell. 164:378–391. 10.1016/j.cell.2015.12.023 [DOI] [PMC free article] [PubMed] [Google Scholar]
- Gao, X., Hu D., Gogol M., and Li H.. 2019. ClusterMap: Compare multiple single cell RNA-Seq datasets across different experimental conditions. Bioinformatics. 35:3038–3045. 10.1093/bioinformatics/btz024 [DOI] [PubMed] [Google Scholar]
- Godwin, J.W., Pinto A.R., and Rosenthal N.A.. 2013. Macrophages are required for adult salamander limb regeneration. Proc. Natl. Acad. Sci. USA. 110:9415–9420. 10.1073/pnas.1300290110 [DOI] [PMC free article] [PubMed] [Google Scholar]
- Guilliams, M., De Kleer I., Henri S., Post S., Vanhoutte L., De Prijck S., Deswarte K., Malissen B., Hammad H., and Lambrecht B.N.. 2013. Alveolar macrophages develop from fetal monocytes that differentiate into long-lived cells in the first week of life via GM-CSF. J. Exp. Med. 210:1977–1992. 10.1084/jem.20131199 [DOI] [PMC free article] [PubMed] [Google Scholar]
- Guilliams, M., Thierry G.R., Bonnardel J., and Bajenoff M.. 2020. Establishment and maintenance of the macrophage niche. Immunity. 52:434–451. 10.1016/j.immuni.2020.02.015 [DOI] [PubMed] [Google Scholar]
- Haghverdi, L., Buettner F., and Theis F.J.. 2015. Diffusion maps for high-dimensional single-cell analysis of differentiation data. Bioinformatics. 31:2989–2998. 10.1093/bioinformatics/btv325 [DOI] [PubMed] [Google Scholar]
- Hartwig, T., Montinaro A., von Karstedt S., Sevko A., Surinova S., Chakravarthy A., Taraborrelli L., Draber P., Lafont E., Arce Vargas F., et al. 2017. The TRAIL-induced cancer secretome promotes a tumor-supportive immune microenvironment via CCR2. Mol. Cell. 65:730–742.e5. 10.1016/j.molcel.2017.01.021 [DOI] [PMC free article] [PubMed] [Google Scholar]
- Hong, S., Beja-Glasser V.F., Nfonoyim B.M., Frouin A., Li S., Ramakrishnan S., Merry K.M., Shi Q., Rosenthal A., Barres B.A., et al. 2016. Complement and microglia mediate early synapse loss in Alzheimer mouse models. Science. 352:712–716. 10.1126/science.aad8373 [DOI] [PMC free article] [PubMed] [Google Scholar]
- Hulsmans, M., Clauss S., Xiao L., Aguirre A.D., King K.R., Hanley A., Hucker W.J., Wulfers E.M., Seemann G., Courties G., et al. 2017. Macrophages facilitate electrical conduction in the heart. Cell. 169:510–522.e20. 10.1016/j.cell.2017.03.050 [DOI] [PMC free article] [PubMed] [Google Scholar]
- Jahchan, N.S., Mujal A.M., Pollack J.L., Binnewies M., Sriram V., Reyno L., and Krummel M.F.. 2019. Tuning the tumor myeloid microenvironment to fight cancer. Front Immunol. 10:1611. 10.3389/fimmu.2019.01611 [DOI] [PMC free article] [PubMed] [Google Scholar]
- Jaitin, D.A., Adlung L., Thaiss C.A., Weiner A., Li B., Descamps H., Lundgren P., Bleriot C., Liu Z., Deczkowska A., et al. 2019. Lipid-associated macrophages control metabolic homeostasis in a trem2-dependent manner. Cell. 178:686–698.e14. 10.1016/j.cell.2019.05.054 [DOI] [PMC free article] [PubMed] [Google Scholar]
- Katzenelenbogen, Y., Sheban F., Yalin A., Yofe I., Svetlichnyy D., Jaitin D.A., Bornstein C., Moshe A., Keren-Shaul H., Cohen M., et al. 2020. Coupled scRNA-Seq and intracellular protein activity reveal an immunosuppressive role of TREM2 in cancer. Cell. 182:872–885.e19. 10.1016/j.cell.2020.06.032 [DOI] [PubMed] [Google Scholar]
- Lavin, Y., Mortha A., Rahman A., and Merad M.. 2015. Regulation of macrophage development and function in peripheral tissues. Nat. Rev. Immunol. 15:731–744. 10.1038/nri3920 [DOI] [PMC free article] [PubMed] [Google Scholar]
- Lavin, Y., Winter D., Blecher-Gonen R., David E., Keren-Shaul H., Merad M., Jung S., and Amit I.. 2014. Tissue-resident macrophage enhancer landscapes are shaped by the local microenvironment. Cell. 159:1312–1326. 10.1016/j.cell.2014.11.018 [DOI] [PMC free article] [PubMed] [Google Scholar]
- Li, Z., Li Y., Gao J., Fu Y., Hua P., Jing Y., Cai M., Wang H., and Tong T.. 2021. The role of CD47-SIRPα immune checkpoint in tumor immune evasion and innate immunotherapy. Life Sci. 273:119150. 10.1016/j.lfs.2021.119150 [DOI] [PubMed] [Google Scholar]
- Lim, H.Y., Lim S.Y., Tan C.K., Thiam C.H., Goh C.C., Carbajo D., Chew S.H.S., See P., Chakarov S., Wang X.N., et al. 2018. Hyaluronan receptor LYVE-1-expressing macrophages maintain arterial tone through hyaluronan-mediated regulation of smooth muscle cell collagen. Immunity. 49:1191–1341.e327. 10.1016/j.immuni.2018.12.009 [DOI] [PubMed] [Google Scholar]
- Luoma, A.M., Suo S., Williams H.L., Sharova T., Sullivan K., Manos M., Bowling P., Hodi F.S., Rahma O., Sullivan R.J., et al. 2020. Molecular pathways of colon inflammation induced by cancer immunotherapy. Cell. 182:655–671.e22. 10.1016/j.cell.2020.06.001 [DOI] [PMC free article] [PubMed] [Google Scholar]
- Martin, J.C., Chang C., Boschetti G., Ungaro R., Giri M., Grout J.A., Gettler K., Chuang L.S., Nayar S., Greenstein A.J., et al. 2019. Single-cell analysis of crohn’s disease lesions identifies a pathogenic cellular module associated with resistance to anti-TNF therapy. Cell. 178:1493–1508.e20. 10.1016/j.cell.2019.08.008 [DOI] [PMC free article] [PubMed] [Google Scholar]
- Matheis, F., Muller P.A., Graves C.L., Gabanyi I., Kerner Z.J., Costa-Borges D., Ahrends T., Rosenstiel P., and Mucida D.. 2020. Adrenergic signaling in muscularis macrophages limits infection-induced neuronal loss. Cell. 180:64–78.e16. 10.1016/j.cell.2019.12.002 [DOI] [PMC free article] [PubMed] [Google Scholar]
- Muller, P.A., Koscso B., Rajani G.M., Stevanovic K., Berres M.L., Hashimoto D., Mortha A., Leboeuf M., Li X.M., Mucida D., et al. 2014. Crosstalk between muscularis macrophages and enteric neurons regulates gastrointestinal motility. Cell. 158:1210. 10.1016/j.cell.2014.08.002 [DOI] [PubMed] [Google Scholar]
- Myers, K.V., Amend S.R., and Pienta K.J.. 2019. Targeting Tyro3, Axl and MerTK (TAM receptors): Implications for macrophages in the tumor microenvironment. Mol. Cancer. 18:94. 10.1186/s12943-019-1022-2 [DOI] [PMC free article] [PubMed] [Google Scholar]
- Ocana-Guzman, R., Torre-Bouscoulet L., and Sada-Ovalle I.. 2016. TIM-3 regulates distinct functions in macrophages. Front Immunol. 7:229. 10.3389/fimmu.2016.00229 [DOI] [PMC free article] [PubMed] [Google Scholar]
- Okabe, Y., and Medzhitov R.. 2014. Tissue-specific signals control reversible program of localization and functional polarization of macrophages. Cell. 157:832–844. 10.1016/j.cell.2014.04.016 [DOI] [PMC free article] [PubMed] [Google Scholar]
- Olah, M., Menon V., Habib N., Taga M.F., Ma Y., Yung C.J., Cimpean M., Khairallah A., Coronas-Samano G., Sankowski R., et al. 2020. Single cell RNA sequencing of human microglia uncovers a subset associated with Alzheimer’s disease. Nat. Commun. 11:6129. 10.1038/s41467-020-19737-2 [DOI] [PMC free article] [PubMed] [Google Scholar]
- Patel, A.A., Ginhoux F., and Yona S.. 2021. Monocytes, macrophages, dendritic cells and neutrophils: An update on lifespan kinetics in health and disease. Immunology. 163:250–261. 10.1111/imm.13320 [DOI] [PMC free article] [PubMed] [Google Scholar]
- Qu, Y., Wen J., Thomas G., Yang W., Prior W., He W., Sundar P., Wang X., Potluri S., and Salek-Ardakani S.. 2020. Baseline frequency of inflammatory Cxcl9-expressing tumor-associated macrophages predicts response to avelumab treatment. Cell Rep. 32:108115. 10.1016/j.celrep.2020.108115 [DOI] [PubMed] [Google Scholar]
- Ramachandran, P., Dobie R., Wilson-Kanamori J.R., Dora E.F., Henderson B.E.P., Luu N.T., Portman J.R., Matchett K.P., Brice M., Marwick J.A., et al. 2019. Resolving the fibrotic niche of human liver cirrhosis at single-cell level. Nature. 575:512–518. 10.1038/s41586-019-1631-3 [DOI] [PMC free article] [PubMed] [Google Scholar]
- Reynolds, G., Vegh P., Fletcher J., Poyner E.F.M., Stephenson E., Goh I., Botting R.A., Huang N., Olabi B., Dubois A., et al. 2021. Developmental cell programs are co-opted in inflammatory skin disease. Science. 371:eaba6500. 10.1126/science.aba6500 [DOI] [PMC free article] [PubMed] [Google Scholar]
- Sharma, A., Seow J.J.W., Dutertre C.A., Pai R., Bleriot C., Mishra A., Wong R.M.M., Singh G.S.N., Sudhagar S., Khalilnezhad S., et al. 2020. Onco-fetal reprogramming of endothelial cells drives immunosuppressive macrophages in hepatocellular carcinoma. Cell. 183:377–394.e21. 10.1016/j.cell.2020.08.040 [DOI] [PubMed] [Google Scholar]
- Shaw, T.N., Houston S.A., Wemyss K., Bridgeman H.M., Barbera T.A., Zangerle-Murray T., Strangward P., Ridley A.J.L., Wang P., Tamoutounour S., et al. 2018. Tissue-resident macrophages in the intestine are long lived and defined by Tim-4 and CD4 expression. J. Exp. Med. 215:1507–1518. 10.1084/jem.20180019 [DOI] [PMC free article] [PubMed] [Google Scholar]
- Smillie, C.S., Biton M., Ordovas-Montanes J., Sullivan K.M., Burgin G., Graham D.B., Herbst R.H., Rogel N., Slyper M., Waldman J., et al. 2019. Intra- and inter-cellular rewiring of the human colon during ulcerative colitis. Cell. 178:714–730.e22. 10.1016/j.cell.2019.06.029 [DOI] [PMC free article] [PubMed] [Google Scholar]
- Stephan, A.H., Barres B.A., and Stevens B.. 2012. The complement system: An unexpected role in synaptic pruning during development and disease. Annu. Rev. Neurosci. 35:369–389. 10.1146/annurev-neuro-061010-113810 [DOI] [PubMed] [Google Scholar]
- Stuart, T., Butler A., Hoffman P., Hafemeister C., Papalexi E., Mauck W.M. 3rd, Hao Y., Stoeckius M., Smibert P., and Satija R.. 2019. Comprehensive integration of single-cell data. Cell. 177:1888–1902.e1821. 10.1016/j.cell.2019.05.031 [DOI] [PMC free article] [PubMed] [Google Scholar]
- Taylor, V., Welcher A.A., Program A.E., and Suter U.. 1995. Epithelial membrane protein-1, peripheral myelin protein 22, and lens membrane protein 20 define a novel gene family. J. Biol. Chem. 270:28824–28833. 10.1074/jbc.270.48.28824 [DOI] [PubMed] [Google Scholar]
- Trapnell, C., Cacchiarelli D., Grimsby J., Pokharel P., Li S., Morse M., Lennon N.J., Livak K.J., Mikkelsen T.S., and Rinn J.L.. 2014. The dynamics and regulators of cell fate decisions are revealed by pseudotemporal ordering of single cells. Nat. Biotechnol. 32:381–386. 10.1038/nbt.2859 [DOI] [PMC free article] [PubMed] [Google Scholar]
- Van de Sande, B., Flerin C., Davie K., De Waegeneer M., Hulselmans G., Aibar S., Seurinck R., Saelens W., Cannoodt R., Rouchon Q., et al. 2020. A scalable SCENIC workflow for single-cell gene regulatory network analysis. Nat. Protoc. 15:2247–2276. 10.1038/s41596-020-0336-2 [DOI] [PubMed] [Google Scholar]
- Wang, W., Marinis J.M., Beal A.M., Savadkar S., Wu Y., Khan M., Taunk P.S., Wu N., Su W., Wu J., et al. 2018. RIP1 kinase drives macrophage-mediated adaptive immune tolerance in pancreatic cancer. Cancer Cell. 34:757–774.e757. 10.1016/j.ccell.2018.10.006 [DOI] [PMC free article] [PubMed] [Google Scholar]
- Zhang, L., Li Z., Skrzypczynska K.M., Fang Q., Zhang W., O’Brien S.A., He Y., Wang L., Zhang Q., Kim A., et al. 2020. Single-cell analyses inform mechanisms of myeloid-targeted therapies in colon cancer. Cell. 181:442–459.e429. 10.1016/j.cell.2020.03.048 [DOI] [PubMed] [Google Scholar]
Associated Data
This section collects any data citations, data availability statements, or supplementary materials included in this article.
Data Availability Statement
scRNA-seq datasets generated in this study are deposited in the European Genome-Phenome Archive under the following accession numbers: EGAD00001007765 and EGAS00001005377. In addition, all data are available upon request.
Reference datasets used in this study are as follows: human ulcerative colitis scRNA-seq dataset (Smillie et al., 2019) Single Cell Portal: SCP259; human enteric neuron system scRNAseq dataset (Drokhlyansky et al., 2020) Broad Insitute Single Cell Portal: SCP1038; human fetal intestinal scRNA-seq dataset (Fawkner-Corbett et al., 2021) Gene Expression Omnibus: GSE158702; GUT HUMAN ATLAS scRNA-seq dataset (Elmentaite et al., 2021) https://www.gutcellatlas.org/; and human microglia scRNA-seq dataset (Olah et al., 2020; https://www.synapse.org/#!Synapse:syn21438358).


