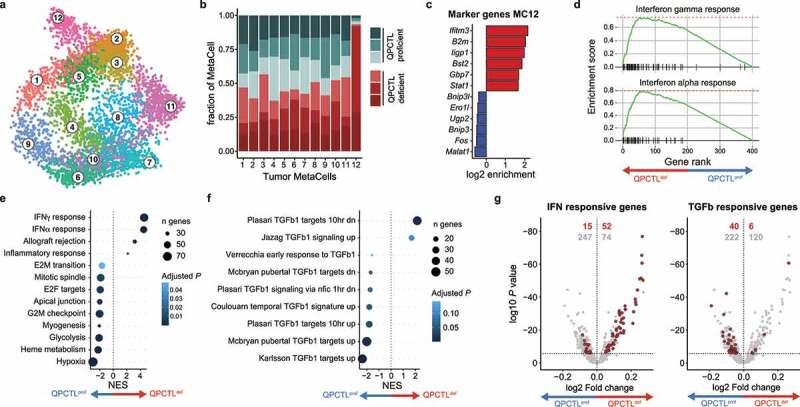
Figure 4.

QPCTL deficiency leads to an increased IFN- and decreased TGF-β-response signature in tumor cells. scRNA sequencing was performed on sorted live cells from QPCTL-proficient (n = 3) and QPCTL-deficient (n = 3) B16F10 TMEs. Tumors were harvested at day 14 post inoculation. (a) 2-dimensional MetaCell projection of the tumor cell compartment. Single cells are colored by MetaCell. (b) Stacked bar chart depicting the sample composition of each tumor cell MetaCell. Cell counts from each sample were normalized to 1,000 cells. (c) Enrichment of marker genes (6 highest and lowest expressed) in tumor cell MetaCell 12. (d) Gene set enrichment analysis performed on the top and bottom 200 genes expressed by MC12 (see Supplementary Fig. 7b). Gene-enrichment plots for the IFNγ and IFNα response gene-sets are depicted. (e-f) Differential gene expression analysis comparing tumor cells derived from QPCTL-proficient and QPCTL-deficient TMEs, followed by gene set enrichment analysis using either hallmark (e) or immunologic signature (f) gene sets from MSigDB. Results obtained from the immunologic signature gene sets were filtered for those containing “TGFb”. Gene sets with a P < .05 are shown. (g) Volcano plots depicting differential gene expression analysis. Horizontal line indicates an adjusted P value cutoff of 0.05. IFN (left) or TGF-β (right) signature genes are highlighted in red (see Supplementary Table 1 for signature genes). Red numbers denote quantity of significant differentially expressed genes within the signature, gray numbers denote the quantity of remaining differentially expressed genes. Depicted data were obtained in a single experiment, consisting of 6 mice. NES, normalized enrichment score; MSigDB, Molecular Signatures Database.
