. 2022 Mar 18;11:e65310. doi: 10.7554/eLife.65310

Figure 5. Influence of age on autosomal cis eQTMs in children’s blood.

(A) Enrichment of eCpGs for CpGs whose methylation levels change with age, in comparison to non eCpGs. eCpGs were classified in all (grey); inverse (yellow); and positive (green). CpGs whose methylation change with age were retrieved from the MeDALL project (from birth to childhood Xu et al., 2017) and from the Epidelta project (from birth to adolescence Mulder et al., 2021). They were classified in variable (CpGs with methylation levels that change with age); decreased (CpGs with methylation levels that decrease with age); and increased (CpGs with methylation levels that increase with age). The y-axis represents the odds ratio (OR) of the enrichment. (B) Overlap between autosomal cis/trans eQTMs identified in adults (GTP: whole blood; MESA: monocytes) (Kennedy et al., 2018) with cis eQTMs identified in children (HELIX: whole blood). All CpG-gene pairs reported at P-value < 1e-5 in GTP or MESA that could be compared with pairs in HELIX are shown. (C) Overlap between blood autosomal cis eQTMs identified in HELIX children with cis/trans eQTMs identified in adults (GTP: whole blood; MESA: monocytes) (Kennedy et al., 2018). All CpG-gene pairs in HELIX that could be compared with pairs in GTP or MESA are shown. Note: The comparison has been split into two plots because one eGene in HELIX can be mapped to different expression probes in GTP and MESA, and vice-versa. Only comparable CpG-Gene pairs are shown (see Materials and methods).

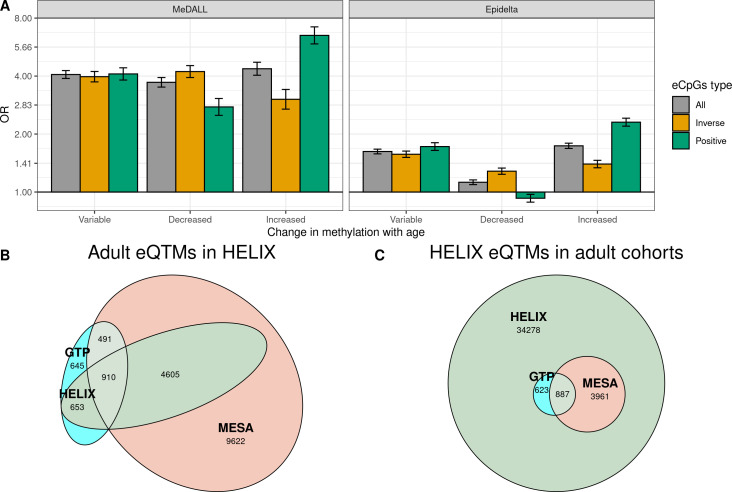
Figure 5.

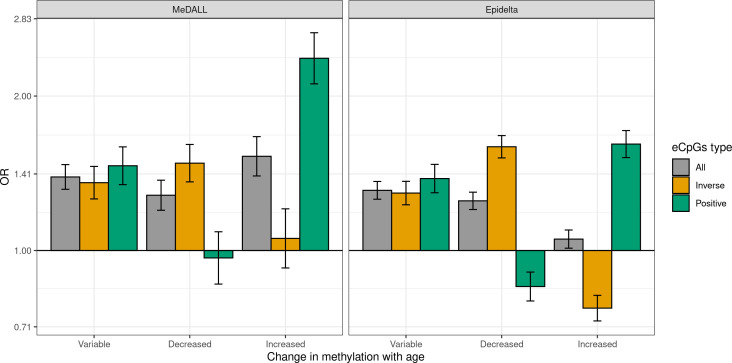
Figure 5—figure supplement 1. Enrichment of eCpGs with reliable measurements for CpGs with age-variable methylation levels.

Figure 5—figure supplement 1.

Only CpGs with reliable measurements (ICC > 0.4) were considered (Sugden et al., 2020). eCpGs were classified in all (grey), inverse (yellow); and positive (green). Age-variable CpGs were retrieved from the MeDALL project (from birth to childhood Xu et al., 2017) and the Epidelta project (from birth to adolescence Mulder et al., 2021), and they were classified in: variable (CpGs with methylation levels that change with age), decreased (CpGs with methylation levels that decrease with age), and increased (CpGs with methylation levels that increase with age). The y-axis represents the odds ratio (OR) of the enrichment. For all eCpG types, the enrichment was computed against non eCpGs.
Figure 5—figure supplement 2. Probe reliability in eCpGs according to overlap with adult eQTMs.

Figure 5—figure supplement 2.

eCpGs were classified in age-shared eCpGs (eCpGs identified in HELIX children and also in adults from MESA and/or GTP studies, in red); and child-specific eCpGs (eCpGs only identified in HELIX children and not in the adult cohorts, in blue). Probe reliabilities were based on intraclass correlation coefficients (ICCs) obtained from Sugden et al., 2020.
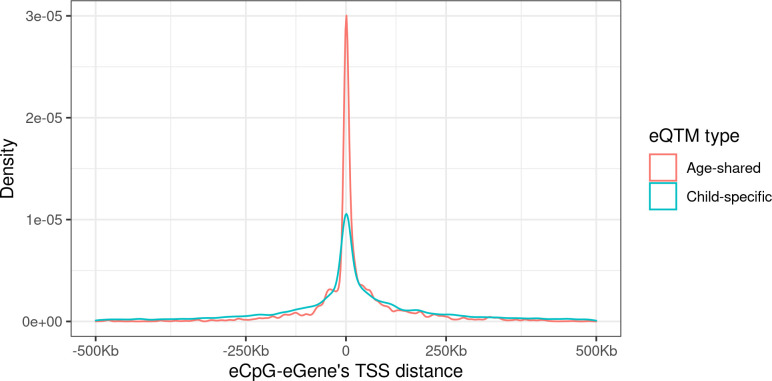
Figure 5—figure supplement 3. Distribution of the distance between CpG-Gene’s TSS by eQTM type.

Figure 5—figure supplement 3.

eQTMs were classified in age-shared (eQTMs identified in HELIX children and also in adults from MESA or GTP studies, in red); and child-specific (eQTMs only identified in HELIX children and not in adult cohorts, in blue). Distance between eCpG and eGene’s TSS is expressed in kb. Age-shared eQTMs median distance: 1.2 kb (IQR: –2.4; 35.4 kb). Child-specific eQTMs median distance: –1.1 kb (IQR: –39.4; 70.7 kb).
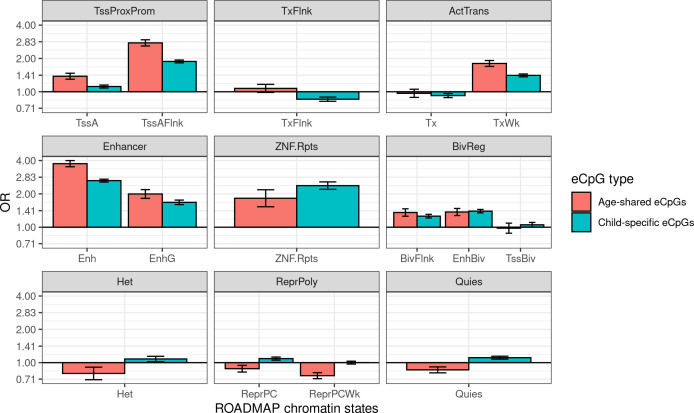
Figure 5—figure supplement 4. Enrichment of age-shared and child-specific eCpGs for blood ROADMAP blood chromatin states.

Figure 5—figure supplement 4.

eCpGs were classified in age-shared (eCpGs identified in HELIX children and also in adults from MESA or GTP studies, in red); and child-specific (eCpGs only identified in HELIX children and not in adult cohorts, in blue). ROADMAP blood chromatin states (Roadmap Epigenomics Consortium et al., 2015) are: active TSS (TssA), flanking active TSS (TssAFlnk), transcription at 5’ and 3’ (TxFlnk), transcription region (Tx), weak transcription region (TxWk), enhancer (Enh); genic enhancer (EnhG), zinc finger genes and repeats (ZNF.Rpts), flanking bivalent region (BivFlnx), bivalent enhancer (EnhBiv), bivalent TSS (TssBiv), heterochromatin (Het), repressed Polycomb (ReprPC), weak repressed Polycomb (ReprPCWk), and quiescent region (Quies). Chromatin states can be grouped in active transcription start site proximal promoter states (TssProxProm), active transcribed states (ActTrans), bivalent regulatory states (BivReg), and repressed Polycomb states (ReprPoly). The y-axis represents the odds ratio (OR) of the enrichment. For each regulatory element, the enrichment was computed against non eCpGs.