Abstract
Very rapid amplification of DNA by PCR in small volumes can be continuously monitored by the detection of the binding of probes with a rapid cycler with built-in fluorometric detection. Primers were designed to amplify approximately 100 bp of the polymerase gene of hepatitis B virus (HBV) spanning codon 550, where mutations associated with resistance to lamivudine invariably occur. Four hybridization probes were synthesized: one was 3′ labelled with fluorescein and hybridized upstream of codon 550. The others were 5′ labelled with Cy5 and 3′ labelled with biotin and spanned codon 550. The Cy5-labelled oligonucleotides contained either wild-type (ATG) or mutant (GTG or ATT) sequences. A Cy5-labelled probe and either the fluorescein-labelled probe or Sybr Green 1 (a compound that fluoresces when bound to double-stranded DNA) were included in each PCR. After completion of the amplification by using a LightCycler (Idaho Technology), the temperature at which the Cy5 probe melted from the product was determined in a melt program that took ca. 3 min. Pre- and posttreatment samples from eight patients (five chronic and three transplant) who failed lamivudine treatment were amplified, and the presence of mutations in codon 550 was determined by ABI sequencing and by using the LightCycler; in some cases PCR products were also cloned, and multiple clones were sequenced. Concordant results were obtained in all cases. We found the LightCycler to be better at resolving the sequences of genomic mixtures; for example, two samples showed a sequence at codon 550 of (A/G)T(G/T), which was found by fluorimetry to be mixtures of GTG and ATT but no ATG, and this finding was confirmed by the sequencing of clones. However, this approach was not more sensitive than population sequencing for the detection of the presence of mixtures. Overall, this pilot study has demonstrated an approach that could be an extremely rapid and economical method for the detection of lamivudine resistance-associated mutations in HBV.
Treatment of chronic hepatitis B virus (HBV) infection has been revolutionized by the introduction of antiviral drugs such as lamivudine and famciclovir. However, long-term monotherapy commonly does not result in complete suppression of viral replication and is associated with the emergence of resistant mutants (5, 7–9). Resistance to lamivudine has also been reported where these drugs are used to prevent HBV reinfection of the liver after transplantation (2, 3, 6, 10, 11, 13). Resistance to lamivudine is invariably associated with mutations in the highly conserved YMDD motif, which is part of the catalytic site of the HBV polymerase. Two classes of mutations have been described: either M550V associated with L526M (group I) or M550I alone (group II) (1, 7, 12). The L526M mutation may be also associated with resistance to famciclovir (2).
Although useful information can be gleaned from in vitro data, a full understanding of the emergence of resistance, the fitness of mutants, and the implications of mutations for susceptibility to alternative drugs requires detailed virological analysis of patients in whom such resistant virus emerges. By using a sensitive quantitative PCR assay to study the dynamics of emergence of lamivudine resistance after liver transplantation for HBV-related disease, we have demonstrated that drug-resistant mutants are likely to exist before transplantation, as part of the viral quasispecies, and that they grow rapidly after infection of the transplanted liver under the selective pressure of lamivudine (4, 6). Resistance appears to develop more quickly after transplantation than in chronically infected patients, and this may be determined, at least in the short term, by the availability of susceptible (uninfected) hepatocytes. Thus, circulating drug-resistant virions at the time of transplant have the opportunity to infect and rapidly multiply within the new liver. By contrast, existing persistently infected hepatocytes in patients with chronic infection may limit the ability of drug-resistant mutants to establish productive infections (4).
The emergence of resistance to nucleoside analogue monotherapy is not surprising in light of our experience with HIV treatment. It is likely that combination therapy will be needed to delay the onset of resistance. Nevertheless, rapid methods are required to identify the presence of resistance-associated mutations in patients failing HBV treatment, and these should be adaptable to new genotypic resistance information emerging from the use of novel drug combinations. This study describes the development of a technique that can detect the presence of mutations in the HBV polymerase YMDD motif very rapidly and inexpensively. The technique is based on rapid PCR followed by measurement of the temperatures at which fluorescent hybridization probes detach from PCR product by using a temperature-controlled microvolume fluorimeter (LightCycler; Idaho Technology).
MATERIALS AND METHODS
Patients.
Patients A to E in Table 1 were treated with lamivudine for chronic HBV infection; patients F to H were treated with lamivudine before and after liver transplantation. All of the patients described here showed failure of lamivudine treatment as defined by a rising viral load during ongoing lamivudine treatment. The genotype of HBV infecting the patients is shown in Table 1.
TABLE 1.
Probe melting temperatures and nucleotide sequence results for codon 550
| Patient (genotype) and mos of treatment | Mean probe melting temperature (°C) ± SDa
|
Temperature change relative to pretreatment (°C)
|
Interpretation | Sequence result
|
|||||
|---|---|---|---|---|---|---|---|---|---|
| WT (ATG) | M1 (GTG) | M2 (ATT) | WT (ATG) | M1 (GTG) | M2 (ATT) | Population | Cloning | ||
| A (D) | |||||||||
| 0 | 62.2 ± 0.8 | 59.5 ± 0.4 | 54.3 ± 0.4 | ATG | ATG | ||||
| 9 | 63.2 ± 0.9 | 60.4 ± 0.6 | 54.3 ± 0.4 | <1 | <1 | <1 | ATG | ATG | |
| 23 | 56.5 ± 0.2 | 55.6 ± 1.0 | 60.9 ± 0.1 | −5.7 | −3.9 | 6.6 | ATT | ATT | ATT (15 clones) |
| B (C) | |||||||||
| 0 | 62.0 ± 0.4 | 60.4 ± 0.6 | 54.1 ± 0.6 | ATG | ATG | ||||
| 25 | 57.0 ± 0.7 | 54.5 ± 0.6, | 52.0 ± 1.0, | −5.0 | −5.9 | −2.1 | GTG & ATT | (A/G)T(G/T) | 8 GTG 12 ATT |
| 64.1 ± 0.4b | 60.6 ± 0.7b | 3.7 | 6.5 | ||||||
| 31 | 56.7 ± 0.4 | 53.8 ± 0.6, | 51.8 ± 0.4, | −5.3 | −6.6 | −2.3 | GTG & ATT | (A/G)T(G/T) | |
| 65.0 ± 1.1b | 602. ± 0.3b | 4.6 | 6.1 | ||||||
| C (B) | |||||||||
| 0 | 61.3 ± 0.6 | 58.6 ± 0.4 | 53.6 ± 0.3 | ATG | ATG | ||||
| 19 | 55.7 ± 0.3 | 54.8 ± 1.1 | 59.4 ± 0.6 | −5.6 | −3.8 | 5.8 | ATT | ATT | |
| D (D) | |||||||||
| 0 | 61.8 ± 0.3 | 59.0 ± 0.7 | 54.7 ± 0.6 | ATG | ATG | ||||
| 29 | 56.5 ± 0.3 | 55.3 ± 0.1 | 61.0 ± 1.0 | −5.3 | −3.7 | 6.3 | ATT | ATT | |
| E (D) | |||||||||
| 0 | 61.7 ± 0.3 | 59.3 ± 0.4 | 54.4 ± 0.6 | ATG | ATG | ||||
| 28 | 57.0 ± 0.2 | 56.6 ± 0.2 | 59.8 ± 0.6 | −4.7 | −2.7 | 5.4 | ATT | ATT | |
| F (A) | |||||||||
| 0 | 61.6 ± 0.1 | 60.2 ± 0.4 | 54.1 ± 0.7 | ATG | ATG | ||||
| 16 | 55.7 ± 0.5 | 54.1 ± 0.7 | 60.5 ± 0.9 | −5.9 | −6.1 | 6.4 | ATT | ATT | |
| G (A) | |||||||||
| 0 | 60.4 ± 1.0 | 59.3 ± 1.1 | 54.1 ± 0.6 | ATG | ATG | ||||
| 13 | 57.3 ± 0.7 | 62.4 ± 0.8 | 51.1 ± 0.5 | −3.1 | 3.1 | −3.0 | GTG | GTG | |
| Off 3c | 56.2 ± 1.6 | No clear peak | No clear peak | −4.2 | ? | ? | Not ATG | (A/G)T(C/G) | 4 ATC 10 GTG |
| H (D) | |||||||||
| 2 | 62.4 ± 1.0 | 60.6 ± 0.3 | 54.7 ± 0.9 | ATG | ATG | ||||
| 12 | 57.5 ± 0.5 | 63.6 ± 0.5 | 51.6 ± 0.5 | −4.9 | 3.0 | −3.1 | GTG | GTG | |
| Off 6c | 62.0 ± 0.3 | 60.1 ± 0.5 | 53.9 ± 0.8 | <1 | <1 | <1 | ATG | ATG | |
Means were derived from at least three determinations.
Two peaks.
Off treatment.
HBV quantitation.
Serum HBV DNA was measured by quantitative PCR by using the Roche Diagnostics HBV Monitor assay. This assay estimates HBV DNA between titers of 400 and 40 million genome copies per ml of serum.
Extraction of HBV DNA from serum.
HBV DNA was extracted from serum samples by adding 10 μl of 0.2 M NaOH to 10 μl of serum, incubating the mixture at 40°C for 1 h, and then neutralizing it with 30 μl of 0.2 M Tris-HCl (pH 7.5), followed by heating at 95°C for 10 min. Alternatively, extracts were made by using the Roche Monitor assay kit, a method which follows a similar protocol but involves a polyethylene glycol precipitation step prior to extraction.
Conventional PCR.
Part of the polymerase gene between nucleotides 466 and 863 was amplified by PCR with primers 5′-GCCCGTTTGTCCTCTAAT and 5′-TAACCCCATCTTTTTGTTTTG and 40 cycles of 94°C for 30 s, 55°C for 30 s, and 72°C for 30 s. An HBV-negative serum was included in all extractions and PCRs to check for contamination. PCR products were purified by using Qiagen columns.
The PCR products were either (i) directly sequenced by using an Applied Biosystems automatic DNA sequencer with dye-labelled dideoxy terminators to provide a nucleotide sequence corresponding to the polymerase amino acids 483 to 583 (our numbering of amino acid positions follows that of the consensus sequence, with the M in the YMDD motif of the catalytic domain of the viral polymerase being designated amino acid 550); (ii) cloned, with multiple clones being sequenced by manual sequencing; or (iii) analyzed with a LightCycler.
Cloning and sequencing.
PCR products were cloned by using the pGem-T Easy Vector system (Promega), and clones were sequenced manually by using 33P-radiolabelled dideoxy terminators in a 33P terminator cycle sequencing kit (Amersham).
LightCycler.
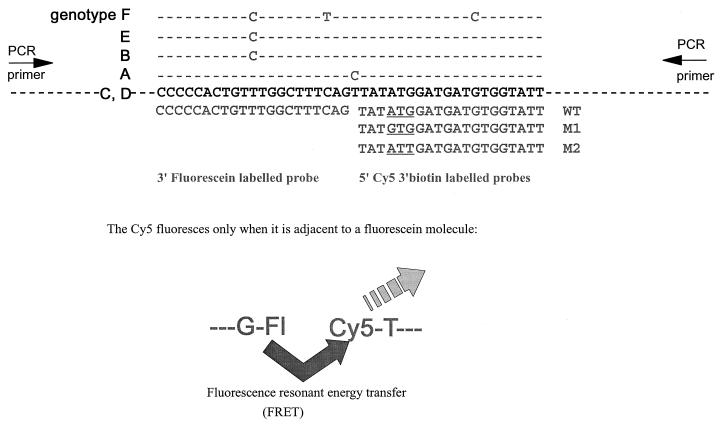
PCR primers were designed to amplify the region between nucleotides 680 and 783 of the polymerase gene. The primers used were 5′-TACTAGTGCCATTTGTTCAGTGG and 5′-CACGATGCTGTACAGACTTGG; these primers lie in conserved areas of the genome. The fluorescent probes were designed as shown in Fig. 1. The 3′-labelled fluorescein probe was designed to anneal upstream of the YMDD coding region; the fluorescein acts as a donor in fluorescence resonant energy transfer (FRET) and also blocks extension from the probe. The 5′ Cy5-labelled probes covered the YMDD coding region and contained ATG (WT), GTG (M1), or ATT (M2) for codon 550. The Cy5-labelled probes were also biotinylated at their 3′ ends to block extension. There was a one-base gap between the Cy5- and fluorescein-labelled probes. This base is subject to natural variability between genotypes, so this design of probes allows negation of any effect of that variability on the binding of the probes (Fig. 1). All primers and probes were synthesized by Alta Bioscience (University of Birmingham). The theoretical melting temperatures were 56 and 57°C for the PCR primers, 59°C for the fluorescein labelled probe, 51°C for the WT Cy5 probe, 53°C for the M1 Cy5 probe, and 49°C for the M2 Cy5 probe. Thus, the Cy5 probes should melt from the PCR product at a lower temperature than the fluorescein probe so that the fluorescence observed is a measure of binding of the Cy5-labelled probes.
FIG. 1.
Design of fluorescent probes for mutation detection in the LightCycler. HBV consensus sequence in positive sense is shown in boldface. Differences from the consensus for the various genotypes are shown above the consensus sequence, and probes are shown below. The nucleotides encoding position 550 in the probes are underlined. PCRs each contained one Cy5-labelled probe and either the fluorescein-labelled probe or Sybr Green 1. The Cy5 molecule fluoresces only when adjacent to the fluorescein molecule or Sybr Green 1. The probes are designed so that the Cy5 label will detach at a lower temperature than the fluorescein-labelled probe.
The components for PCR included the following: 50 mM Tris, pH 8.5; 2.8 mM MgCl2; 500 nM concentrations of each PCR primer; 200 nM concentrations of each probe; 200 μM concentrations of each deoxynucleoside triphosphate; 250 μg of bovine serum albumin per ml; and 0.4 U of Taq polymerase with 1 μl of template per 10-μl final volume of reaction mix. Each PCR contained one Cy5-labelled probe and the fluorescein-labelled probe. Alternatively, in some experiments, the fluorescein-labelled probe was replaced with Sybr Green 1 (Bio/Gene) at a final concentration of 1:20,000. Sybr Green 1 binds to double-stranded DNA and is a generic indicator of amplification. Sybr Green 1 has an excitation maximum near that of fluorescein (14), so it can also act as a generic donor in FRET. (The combined use of Sybr Green 1 and Cy5-labelled probes is subject to patent application 9725197.9.) Where a PCR product from conventional PCR (described above) was used as a template, this was first diluted 1:1,000, whereas serum extracts were used undiluted. Then, 3 μl of reaction mixture was placed in glass capillary cuvettes which were filled by pulse centrifugation in a microcentrifuge. Conditions for cycling were 95°C for 45 s, followed by 40 cycles of 95°C for 1 s, 50°C for 2 s, and 72°C for 6 s, with monitoring of fluorescence during the annealing phase; this, in turn, was followed by a melting program of 40 to 75°C at 0.2°C/s with continuous monitoring of the fluorescence.
RESULTS
Rapid PCR and continuous monitoring of product.
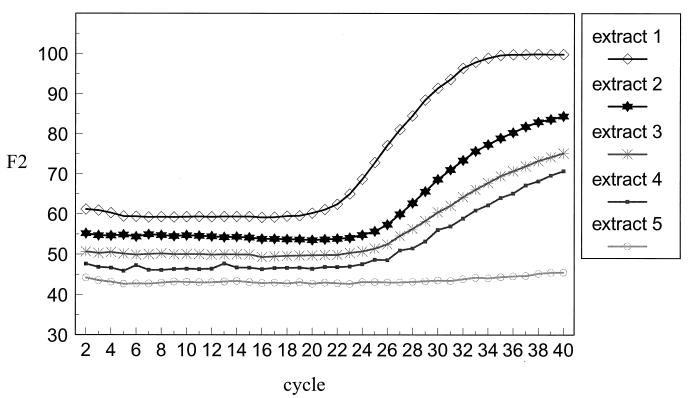
The accumulation of PCR product could be monitored by measurement of the level of Cy5 fluorescence. When the FRET was supplied by the fluorescein probe, product was observed to accumulate in an approximately linear manner, indicating a suboptimal PCR. In contrast, when FRET was supplied by Sybr Green 1, the increase in Cy5 fluorescence was usually exponential, as illustrated in Fig. 2. This figure shows the progress of five PCRs with, as template, DNA extracted for the Roche quantitative PCR assays with viral loads ranging from <400 to 14 × 106 genome copies per ml. It can be seen that the signal from the highest initial viral load sample started to rise earlier than the rest and reached a final higher level, indicating that the increase in fluorescence signal due to probe hybridization was related to the initial template concentration. No increase in fluorescence was observed in the sample that had an undetectable viral load. The lower level of sensitivity was approximately 1 × 10⁵ to 2 × 10⁵ genome copies per ml of serum (equivalent to 1 × 10² to 2 × 10² genome copies per reaction) when serum samples were extracted by the Roche Monitor quantitative PCR kit method. This method was about 10-fold more sensitive than with samples extracted by the non-kit method as described in Materials and Methods. This difference can partly be explained by the dilution factor of 1:5 during our extraction method, which does not occur in the Roche extraction.
FIG. 2.
Accumulation of Cy5-specific fluorescence during PCR of serum sample extracts by using WT Cy5 probe together with Sybr Green 1. Viral loads of sera were 14 × 106 genome copies/ml (extract 1), 3.5 × 10⁶ copies/ml (extract 2), 2.9 × 10⁶ copies/ml (extract 3), 0.2 × 10⁶ copies/ml (extract 4), and <400 copies/ml (extract 5).
The primers used in the “conventional” PCR were also tested by using the LightCycler protocol, but the yields were much lower than with the primers specifically designed for use in the LightCycler. This is probably due to the rapid cycling protocol working better with a smaller target.
Melting temperatures of probes.
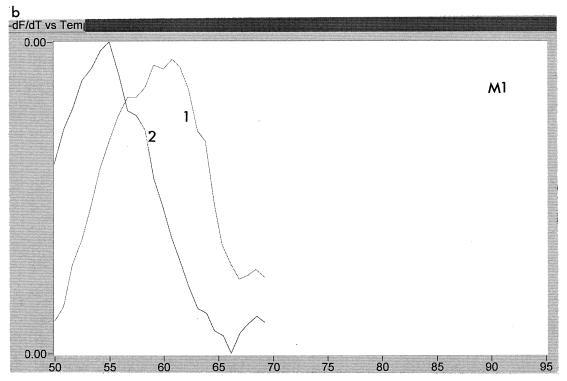
The temperature at which the probes melted from the PCR product during the melt program was calculated by using the LightCycler software. A typical result is shown in Fig. 3. This figure shows an analysis of two samples from patient A, one taken before treatment with lamivudine (sample 1) and one after resistance to lamivudine had developed (sample 2). Each sample was tested with WT, M1, and M2 probes. It can be seen that the melting temperature for the WT and M1 probes was higher in the sensitive virus than in the resistant virus, while the reverse was true for the M2 probe. This indicates that sample 1 had the sequence ATG and sample 2 had the sequence ATT at codon 550. The melting temperature of the M1 probe dropped for sample 2 because of the double mismatch, i.e., GTG versus ATT. A summary of the melting temperatures for each of the probes for the patient samples is shown in Table 1, together with the changes in melting temperatures for the product derived from resistant virus relative to that from sensitive virus. It can be seen that the change from wild type to mutant at codon 550 resulted in a drop of melting temperature of the WT probe of >3°C, with a concomitant increase in melting temperature of one of the mutant probes. The sequence for codon 550, as deduced from the LightCycler data, was in accordance with the nucleotide sequencing in all cases. For one sample from one patient (G) following cessation of lamivudine treatment, the HBV sequence could not be determined from the LightCycler, although it was clearly not wild type. Sequencing of clones derived from this sample showed it to be a mixture of ATC and GTG. Thus, the unclear data were due to the presence of a mixture, including the ATC genotype, which was not homologous with any of the probes used. There was sometimes slight variability (∼1°C) between runs in absolute melting temperatures. These variations were found to be very sensitive to salt concentrations.
FIG. 3.
Melting peaks of Cy5-labelled probes with two samples from patient A. Sample 1 is an lamivudine-sensitive virus, while sample 2 is a resistant virus. Panels: a, traces obtained with WT probe; b, traces obtained with M1 probe; c, traces obtained with M2 probe. Each trace shows the rate of change of fluorescence with respect to temperature, thus allowing calculation of the temperature at which the probes detach from the PCR product.
Emergence of YMDD mutations.
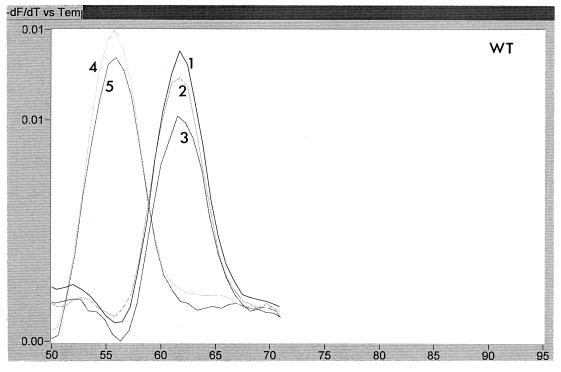
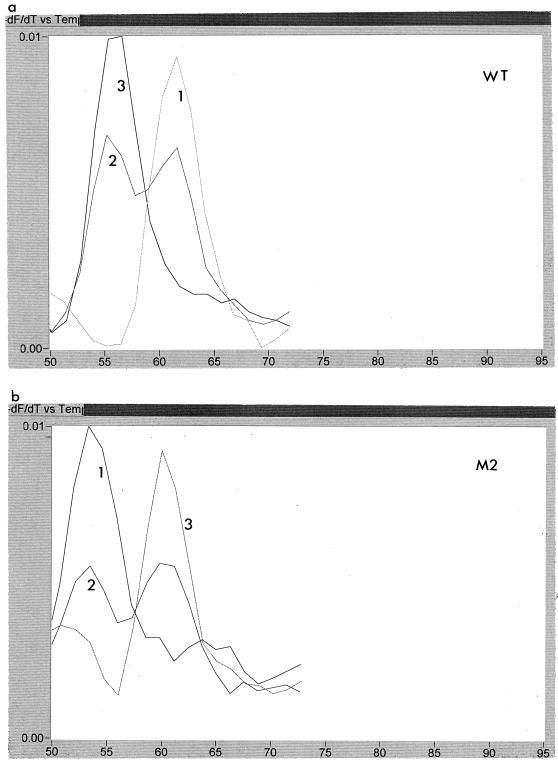
The emergence of resistance-associated mutations could be examined readily by using the LightCycler. Figure 4 shows the melting curves using the WT probe for five sequential samples obtained from patient A over a 14-month period. It can be seen that samples 1, 2, and 3 all showed a higher melting temperature than the later samples, 4 and 5, indicating that the first three samples had wild-type sequence, whereas the last two were mutant. Likewise, Fig. 5 shows three samples from patient C probed with WT and M2. Sample 1 is ATG, and sample 3 is ATT, whereas sample 2 is a mixture of ATG and ATT.
FIG. 4.
Melting peaks of WT probe for five consecutive samples, labelled 1 to 5, obtained from patient A over a period of 14 months. It can be seen that samples 1 to 3 all had a higher melting temperature with this probe than samples 4 and 5.
FIG. 5.
Melting peaks of three samples, labelled 1 to 3, from patient C, that were probed with WT and M2 probes. These peaks show the transition with time from ATG to ATG/ATT to ATT. Panels: a, trace obtained with WT probe; b, trace obtained with M2 probe.
Resolution of mixtures.
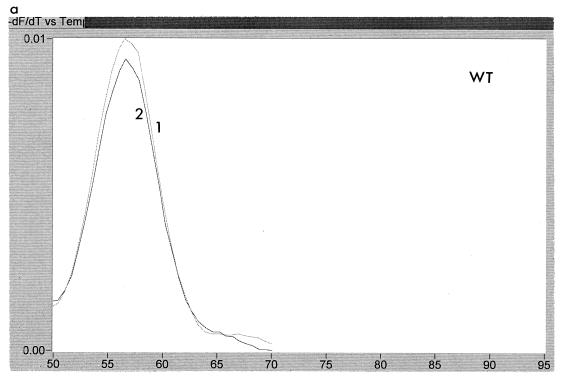
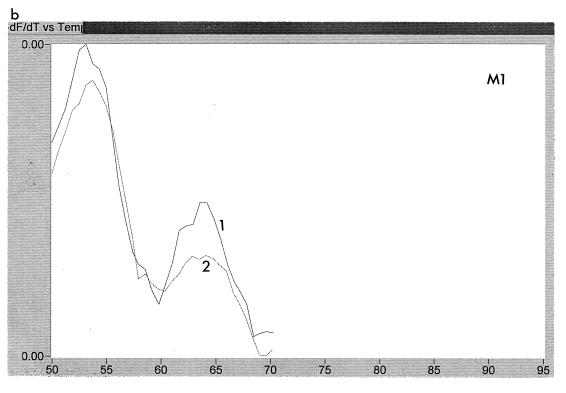
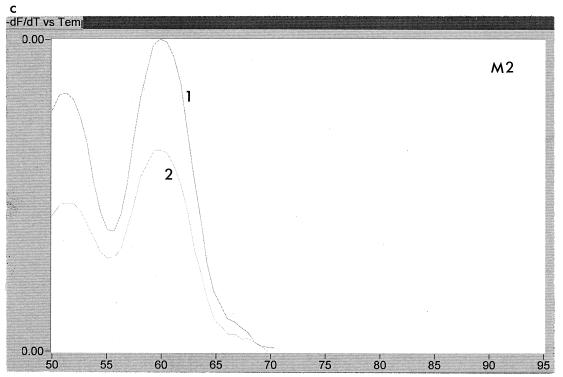
The LightCycler could be used to determine the makeup of some mixtures. For example, two samples from patient B showed the nucleotide sequence (A/G)T(T/G) at codon 550 by population sequencing. This could be either ATT, ATG, GTG, or GTT. Analysis of the melting curves showed that ATG was absent and that the sample was a mix of ATT and GTG, as illustrated in Fig. 6. This finding was confirmed by sequencing of 10 clones derived from the same PCR product. Interestingly, this mixture of mutant types was seen in two samples taken 6 months apart, indicating that neither mutant type had a particular growth advantage over the other.
FIG. 6.
Melting peaks of two samples, labelled 1 and 2, of resistant virus obtained 6 months apart from patient B probed with WT (a), M1 (b), and M2 (c) probes. The peaks show that a mixture of mutant sequences is present.
The sensitivity of the LightCycler method described here for the detection of mixtures was examined by using defined mixtures of plasmids. The plasmids were two clones derived from PCR product from patient A, one showing a wild-type sequence (ATG) at codon 550 and the other showing a mutant sequence (ATT) at that codon. In this case the lower level of reliable detection of a minority species occurred when it comprised about 20% of the population (data not shown). This is approximately equivalent to the level of sensitivity of detection of mixtures achieved by population sequencing. Thus, this method does not improve the sensitivity of detection of mixtures relative to population sequencing, but it can aid the resolution of the exact nature of the mixtures.
DISCUSSION
The method described here provides a rapid, accurate, and inexpensive way to detect lamivudine resistance-associated mutations in the YMDD region of the HBV polymerase. In all cases, the results obtained with the LightCycler corresponded with nucleotide sequencing data. In many cases the actual melting temperature for each probe was diagnostic of the sequence present. However, it is possible that natural variability in the sequence where the Cy5 probes bind could lead to a lower melting temperature of the probe without this being associated with resistance mutations, although all of the probes would show a similar effect. The patients in this report were infected with HBV of genotypes A, B, C, or D (Table 1), and for these samples no overall lower melting temperatures for the probes were observed since there was no variability in the region covered by the Cy5-labelled probe. However, this could be predicted to happen with virus of genotype F, for which the consensus sequence indicates there would be one mismatch in the Cy5 probe binding region together with two mismatches in the fluorescein probe binding region. Thus, a more accurate diagnosis can be better obtained if pretreatment samples are analyzed in conjunction with putatively resistant samples so that changes in melting temperatures are determined rather than absolute melting temperatures.
The probes used in this study were specific for ATG (WT), GTG (M1), and ATT (M2) at codon 550. An alternative mutation that would generate the M550I variant is for codon 550 to become ATC. This ATC mutation has not been reported as the sole population thus far, although we have detected it in association with ATT and GTG (6). Therefore, for complete analysis it may be necessary to include in the assay a fourth Cy5 probe specific for ATC.
In our hands, the use of Sybr Green 1 as a generic donor in FRET (instead of a specific fluorescein probe), combined with a Cy5-labelled hybridization probe, was more sensitive than using a fluorescein-labelled second probe. However, this method also resulted in increased noise in the assay, particularly since, when doing melting curves, there was a steady diminution of fluorescence with the increase in temperature before the sudden decrease due to detachment of the probe. Our choice would be to use the fluorescein-labelled probe when examining PCR products derived by conventional PCR but to use Sybr Green 1 when starting with serum extracts with relatively low copy numbers. The level of sensitivity reported here (ca. 100 to 200 copies per reaction) is similar to that reported by Woo et al. (14), who used the LightCycler to identify Leptospira species.
The hardware required for this test is expensive, but this type of equipment is becoming increasingly common in routine diagnostic laboratories, and the rapid reaction time allows multiple runs to occur each day. The consumable costs for this technique are only those associated with carrying out PCR in tiny volumes; operator time is low, since up to 32 samples can be analyzed simultaneously. We have shown that it is possible to use stored extracts obtained for viral load testing, so little additional work is required for mutation detection. If additional studies with a variety of HBV strains and controls confirm our findings, this rapid, accurate, and inexpensive assay should allow the routine analysis of many patient samples and thus readily give additional information to guide treatment options and to allow detailed analysis of the development of drug resistance in HBV infections.
ACKNOWLEDGMENTS
We are grateful to Elwyn Elias for access to samples from his patients. We also thank Jean Shaw, Katharina O’Donnell, and Judith Workman for excellent administrative and technical assistance and Julie King for help with the LightCycler.
REFERENCES
- 1.Allen M I, Deslauriers M, Andrews C W, Tipples G A, Walters K A, Tyrrell D L J, Brown N, Condreay L D. Identification and characterization of mutations in hepatitis B virus resistant to lamivudine. Hepatology. 1998;27:1670–1677. doi: 10.1002/hep.510270628. [DOI] [PubMed] [Google Scholar]
- 2.Aye T T, Bartholomeusz A, Shaw T, Bowden S, Breschkin A, McMillan J, Angus P, Locarnini S. Hepatitis B virus polymerase mutations during antiviral therapy in a patient following liver transplantation. J Hepatol. 1997;26:1148–1153. doi: 10.1016/s0168-8278(97)80125-0. [DOI] [PubMed] [Google Scholar]
- 3.Bartholomew M M, Jansen R W, Jeffers L J, Reddy K R, Johnson L C, Bunzendahl H, Condreay L D, Tzakis A G, Schiff E R, Brown N A. Hepatitis-B virus resistance to lamivudine given for recurrent infection after orthotopic liver transplantation. Lancet. 1997;349:20–22. doi: 10.1016/S0140-6736(96)02266-0. [DOI] [PubMed] [Google Scholar]
- 4.Burroughs N J, Rand D A, Pillay D, Elias E, Mutimer D. The consequences of quasispecies heterogeneity and within-host ecology for antiviral therapy of hepatitis B virus. In: Schinazi R F, Sommadossi J P, Thomas H, editors. Therapies for viral hepatitis. International Medical Press; 1998. pp. 335–343. [Google Scholar]
- 5.Buti M, Jardi R, Cotrina M, Rodriguez-Frias F, Esteban R, Guardia J. Transient emergence of hepatitis B variants in a patient with chronic hepatitis B resistant to lamivudine. J Hepatol. 1998;28:510–513. doi: 10.1016/s0168-8278(98)80327-9. [DOI] [PubMed] [Google Scholar]
- 6.Cane P A, Mutimer D, Ratcliffe D, Cook P, Beards G, Elias E, Pillay D. Analysis of HBV quasispecies changes during emergence and reversion of lamivudine resistance in liver transplantation. Antiviral Ther. 1999;4:7–14. [PubMed] [Google Scholar]
- 7.Chayama K, Suzuki Y, Kobayashi M, Kobayashi M, Tsubota A, Hashimoto M, Miyano Y, Koike H, Kobayashi M, Koida I, Arase Y, Saitoh S, Murashima N, Ikeda K, Kumada H. Emergence and takeover of YMDD motif mutant hepatitis B virus during long-term lamivudine therapy and re-takeover by wild type after cessation of therapy. Hepatology. 1998;27:1711–1716. doi: 10.1002/hep.510270634. [DOI] [PubMed] [Google Scholar]
- 8.Honkoop P, Niesters H G, deMan R A, Osterhaus A D, Schalm S W. Lamivudine resistance in immunocompetent chronic hepatitis B. Incidence and patterns. J Hepatol. 1997;26:1393–1395. doi: 10.1016/s0168-8278(97)80476-x. [DOI] [PubMed] [Google Scholar]
- 9.Lai C-L, Chien R-N, Leung N W Y, Chang T-T, Guan R, Tai D-I, Ng K-Y, Wu P-C, Dent J C, Barber J, Stephenson S L, Gray D F. A one-year trial of lamivudine for chronic hepatitis B. N Engl J Med. 1998;339:61–68. doi: 10.1056/NEJM199807093390201. [DOI] [PubMed] [Google Scholar]
- 10.Ling R, Mutimer D, Ahmed M, Boxall E H, Elias E, Dusheiko G M, Harrison T J. Selection of mutations in the hepatitis B virus polymerase during therapy of transplant recipients with lamivudine. Hepatology. 1996;24:711–713. doi: 10.1002/hep.510240339. [DOI] [PubMed] [Google Scholar]
- 11.Nauomov N V, Chokshi S, Smith H M, Williams R. Emergence and characterisation of lamivudine-resistant hepatitis B virus variant. Hepatology. 1996;24:282A. [Google Scholar]
- 12.Pillay D, Bartholomeusz A, Cane P A, Mutimer D, Schinazi R F, Locarnini S. Mutations in the hepatitis B virus DNA polymerase associated with antiviral resistance. Antiviral News. 1998;6:167–169. [Google Scholar]
- 13.Tipples G A, Ma M M, Fischer K P, Bain V G, Kneteman N M, Tyrrell D L. Mutation in HBV RNA-dependent DNA polymerase confers resistance to lamivudine in vivo. Hepatology. 1996;24:714–717. doi: 10.1002/hep.510240340. [DOI] [PubMed] [Google Scholar]
- 14.Woo T H S, Patel B K C, Smythe L D, Symonds M L, Norris M A, Dohnt M F. Identification of pathogenic Leptospira genospecies by continuous monitoring of fluorogenic hybridization probes during rapid-cycle PCR. J Clin Microbiol. 1997;35:3140–3146. doi: 10.1128/jcm.35.12.3140-3146.1997. [DOI] [PMC free article] [PubMed] [Google Scholar]


