

Abstract
Ionizing radiation (IR) can cause radiation damage, mutagenesis, or carcinogenesis in the irradiated subject. It is manifested as metabolic disorders of the body and damage to the immune system, nervous system, and endocrine system, which can lead to physiological and pathological changes and endogenous metabolic disorders. Ginsenoside Re (G-Re), a single component of traditional Chinese medicine, has a certain ameliorating effect on radiation damage. However, its mechanism of action in the treatment of radiotherapy injury remains unclear. With this purpose, the hematopoietic function of mice damaged by X-ray radiation was studied, and the protective effect of G-Re on mice damaged by radiation was preliminarily evaluated. Network pharmacology and metabolomics analysis are used to further reveal the mechanism of G-Re to improve radiation damage through metabolomics research. Results of metabolomics analysis showed that 16 potential biomarkers were identified as participating in the therapeutic effect of G-Re on IR. Most of these metabolites are adjusted to recover after G-Re treatment. The pathways involved included glycerophospholipid metabolism, sphingolipid metabolism, and linoleic acid metabolism. According to network pharmacology analysis, we found 10 hub genes, which is partly consistent with the findings of metabolomics. Further comprehensive analysis focused on 4 key targets, including SRC, EGFR, AKT1, and MAPK8, and their related core metabolites and pathways. This study combines metabolomics and network pharmacology analysis to explore the key targets and mechanisms of G-Re in the treatment of IR, in order to provide new strategies for clinical treatment of radiotherapy injury.
1. Introduction
Ionizing radiation (IR) refers to the general term for radiation that can cause ionization of affecting substances, including X-rays, charged particles of α and β, and uncharged neutrons. It has the characteristics of high energy, high frequency, and short wavelength [1]. It has brought huge economic and social benefits to human modern life and also has the potential harm to the human body. It has grown up to be a kind of “invisible bomb” in life, causing serious harm to human life and health at any time [2, 3]. The application of IR in medicine including diagnosis and treatment, especially the continuous update of X-knife, CT instrument, and gamma-knife treatment methods, has become an important method and has been more and more widely used. Radiation can not only kill tumor cells but also cause damage and death of normal cells and cause local and systemic adverse reactions in patients [4]. Hematopoietic system damage caused by radiotherapy is the most common, which is mainly manifested as bone marrow suppression, significantly increased risk of anemia and bleeding, decreased immune function, and enhanced complications.
Total body irradiation (TBI) will provoke a continuous increase in the level of ROS in the irradiated body, leading to chronic oxidative stress [5]. When ionizing radiation acts on organisms, the impact on the hematopoietic system is mainly manifested in the inhibition and destruction of bone marrow hematopoietic stem cells and hematopoietic stromal cells, as well as the impact on peripheral blood cells. Hematopoietic stem cells protect the hematopoietic system from exhaustion under various stress conditions under steady-state conditions; when the body is exposed to radiation, hematopoietic stem cells and their self-renewal ability are impaired, resulting in decreased blood cell and platelet counts, decreased hematopoietic function, and hematopoietic system development. Long-term or permanent damage and bone marrow failure and body death may occur [6].
Hematopoietic dysfunction is the main clinical symptom of radiotherapy injury. In recent years, many studies have found that antiradiation effects are found in Chinese herbal medicines that invigorate qi and blood and enhance immunity, and its active ingredients have become an important way to develop radiopharmaceuticals. In addition, traditional Chinese medicine holds the characteristics of the high source, small toxicity, and low price, so traditional Chinese medicine antiradiation active ingredients have become a research hotspot in recent years. Panax ginseng C. A. Meyer was first published in Herbal Lection. It is the rhizome of a perennial herbaceous plant belonging to Araliaceae and Panax ginseng. It has the elegant names of God grass, goblin, and jade essence and is known as the king of herbs [7]. With the development of modern medical technology, the pharmacological effects and application value of ginseng have been gradually confirmed by modern pharmacology and clinical medicine, and it has been widely used in various preparations of decoctions and Chinese patent medicines, which has established its special position in Chinese medicine in my country [8]. Ginsenoside Re (G-Re) is the main active ingredient of ginseng. G-Re has a good protective effect on UVB-induced skin damage, and its mechanism of action is linked to the scavenging of free radicals and antioxidant effects [9]. In addition, G-Re can also play a role in resisting radiation damage by protecting the immune system and cardiovascular system, resisting oxidative stress, inhibiting cell apoptosis, and reducing lipid peroxidation [10, 11].
Metabolomics is the study of various metabolic changes that occur in an organism under the action of physiology, pathology, or drugs. By measuring the changes of endogenous metabolites in the organism, the target can be more easily discovered, thereby revealing its mechanism of action [12]. The serum is a commonly used biological fluid that is easily available and rich in information in metabolomics. Monitoring the level of specific metabolites in serum has become an important method for detecting early disease. Serum metabolite profiles can be considered as an important indicator to monitor the physiological and pathological status of organisms. Compared with other biofluid analyses, serum metabolite profiles have many advantages, contribute to the understanding of the mechanism of disease occurrence and development at the metabolic level, and provide information that can identify early and differential metabolic markers of disease [13, 14]. Radiation injury is a pathological state caused by ionizing radiation, which can result in a series of changes in metabolites. Many of these studies are based on the search for biomarkers related to radiation dose in metabolites that can be used for early diagnosis and early warning of radiation damage. The development of network pharmacology is based on the increasing knowledge of the interaction between proteins and molecules, which is of great help in understanding the pathogenesis of TCM syndromes and the treatment mechanism of TCM [15, 16]. Therefore, combining traditional Chinese medicine with metabolomics provides an effective way to scientifically explain the metabolic mechanism of traditional Chinese medicine as an auxiliary drug for radiotherapy.
At present, there are few reports on the radiation resistance of ginseng and the protective mechanism of ginsenosides against X-ray radiation damage and the mechanism of action from the aspect of metabonomics is still unclear. Potential therapeutic targets were screened based on metabonomics and network pharmacology to prove the therapeutic effect of G-RE on ionizing radiation injury. A mouse model of radiation injury induced by X-ray was established and serum metabolomics was used to screen differential metabolites. Potential targets for G-RE treatment of IR were identified by network pharmacology, and a comprehensive network of metabolomics and network pharmacology was constructed. Using a combination of metabonomics and network pharmacology, this study provides a strategy to understand the underlying mechanisms of radiation damage. At the same time, G-Re is considered to be an auxiliary drug for exogenous radiotherapy to study its radiation protection effect on organisms and its mechanism.
2. Materials and Methods
2.1. Reagents
Ginsenoside Re (Re purity) were purchased from Nanjing Chunqiu Biological Engineering Co., Ltd., and identified according to the Chinese Pharmacopoeia (2015 Edition). Perchloric acid, glacial acetic acid, anhydrous calcium chloride, and formaldehyde were obtained from Shanghai Macklin Biochemical Co., Ltd. (China). Leu-enkephalin was obtained from Sigma-Aldrich company (USA). Acetonitrile was obtained from Thermo Fisher Scientific company (USA). HPLC-grade formic acid and methanol were obtained from Dikma Technologies company (CA). The assay kits used to determine IL-2, IL-6, IL-12, and IgM were purchased from Jiancheng Bioengineering Institute (Nanjing, China).
2.2. Animal and Experimental Design
Thirty Kunming mice (Weighing approximately 20 ± 2 g) were supplied by the Liaoning Changsheng Biotechnology Co., Ltd., (Liaoning, China) with the license number SCXK (Liao) 2020-0001. All mice were housed in an animal breeding room under specific pathogen-free (SPF) conditions with free access to fodder and purified water at a temperature (22 ± 2°C) with 50–60% humidity and under a 12 h light/dark cycle. All animal procedures were performed in accordance with the Guide for Care and Use of Laboratory Animals and the related ethical regulations of Heilongjiang University of Chinese Medicine (process number: 2018052325).
After acclimatization, thirty KM mice were divided into three groups as follows: normal control group (n = 10), radiation model group (n = 10), and dosage group of G-Re (240 mg/kg/d, n = 10). The G-Re dose was chosen based on the daily intake from our previous study of Chinese. The control and model groups were administered corresponding volumes of normal saline; the G-Re group was orally administrated with G-Re. Drugs were administered for 20 days by gavage. 9th day after the intragastric administration, except for the control group, the model group and the G-Re group were subjected to whole-body one-time irradiation with X rays (irradiation dose of 5.0 Gy). After irradiation, the G-Re group continued to gavage the G-Re, and the control group and the model group continued to give normal saline.
2.3. Sample Collection and Preparation
2.3.1. Serum Collection and Detection of Biochemistry Parameters
After the last intragastric administration of G-Re for 24 hours, blood samples were collected from the orbit and then divided into two aliquots. Serum was obtained from one aliquot by centrifugation at 3500 rpm for 15 min after the blood samples clotted and stored at −80°C.
Serum samples were taken to measure the IL-2, IL-6, IL-12, and IgM indicators according to the kit instructions. Methanol (400 mL) was added to serum (100 μL) and vortexed for 1 min followed by centrifuged at 12,000 rpm for 15 min, and the obtained supernatant was then transferred to another tube and the supernatant was filtered through a 45 μL filter and moved into a microinlet tube. The obtained supernatant was set aside until use for the UPLC-MS analysis.
2.3.2. Collection and Biochemical Test of Mouse Spleen and Bone Marrow
The spleen was taken out and weighed, put in the preconfigured Bouin's solution for 24 hours, and then took out. The number of nodules protruding from the surface of the spleen (CFU-S) was counted by naked eye or a magnifying glass. Get out the mice femur and use scissors to subtract the joints at the upper and lower ends of the femur. Use a syringe to draw 10 mL of 5 mmol/L CaCl2 solution to slowly flush the bone marrow into the centrifuge tube until the inner wall of the femur is white and place the centrifuge tube with bone marrow under 4°C for 30 min. After centrifugation at 3500 r/min for 10 min, discard the supernatant, then add 5 mL 0.2 mol/L HClO4 solution to the precipitate and mix thoroughly, then cool the resulting solution to room temperature in a water bath at 90°C for 15 min, and centrifuge at 3500 r/min for 15 min. Discard the precipitate and aspirate the supernatant, and use a UV spectrophotometer to measure the absorbance of the obtained supernatant at 268 nm to calculate the DNA content of the bone marrow.
| (1) |
2.4. Chromatographic and Mass Spectrometric Conditions
In our experiment, chromatographic separation was performed on a UPLC BEH C18 column (100 mm × 2.1 mm, 1.7 μm i.d.; Waters Corporation, Milford, Massachusetts, USA) using a Waters ACQUITY UPLC System (Waters Corporation). A 3 μL aliquot of the sample was injected into the column, which was maintained at 35°C. The UPLC mobile phase consisted of 0.1% formic acid acetonitrile (solvent A) and water (solvent B). The gradient duration was 9 min at a constant flow rate of 0.4 mL/min. The metabolites were eluted using a linear gradient of 99–80% B for 0.5 min, 80–40% B for 0.5–2.5 min, 40–34% B for 2.5–4 min, 34–20% B for 4–5 min, 20–14% B for 5–7.5 min, 14–1% B for 7.5–8 min, and 1% B for 8–9 min. The column eluent was directed to the mass spectrometer for analysis. A blank was analyzed between every five samples to wash the column.
Mass spectroscopy was performed by a Waters Micromass Q-TOF (Quadrupole Time-of-Flight) Micromass Spectrometer (Waters Corporation) connected to electrospray ionization (ESI) operating in positive and negative modes and a full scan mode from m/z 100 to 1500 for 0 to 16 min. The desolvation gas rate of nitrogen was set to 750 L/h, the desolvation temperature was 350°C, the cone gas rate was set at 20 L/h, and the source temperature was 110°C. The capillary voltage was set at 1.3 kV and 1.5 kV in positive ion mode and in negative ion mode, respectively. The cone voltage was set at 60 V in positive and 70 V in negative ion mode. For accurate mass acquisition, a lock mass of leucine enkephalin was used through a lock spray interface at a flow rate of 40 μL/min. The lock spray frequency was set at 0.48 s, and the lock mass data were averaged over 10 scans for correction.
2.5. Data Processing and Analysis
The UPLC/MS data were processed using the Micromass MarkerLynx Application Version 4.1 (Waters, Milford, MA, USA) and Progenesis QI software, which allowed data alignment, peak matching, deconvolution, and reduction to yield a table of mass and retention time pairs with the associated intensities for all detected peaks. Mathematical treatments of data such as principal component analysis (PCA) and partial least squares discriminant analysis (PLS-DA) apply a statistically driven model in order to determine latent variables indicative of hidden relationships between the observed data. All ions to be analyzed were arranged in descending order according to variable importance in the project (VIP) values and S-plot. Variables with VIP >1.0 and q value <0.05 were considered to be important in discriminating biomarkers between different groups. The databases used to confirm the pick-out potential biomarkers were the Human Metabolome Database (HMDB: http://www.hmdb.ca/spectra/ms/search) and the Kyoto Encyclopedia of Genes and Genomes (KEGG: http://www.genome.jp/kegg/). MetaboAnalyst (http://www.metaboanalyst.ca/) and other metabolic pathway databases carry out enrichment analysis and network construction of related metabolic pathways.
Data collected in biochemical assay were expressed as mean ± SD. Statistical analyses were performed using SPSS 21.0 software. Comparisons between groups were measured by two-sided test. P values < 0.05 were considered statistically significant.
2.6. Network Pharmacology Analysis
In order to better reveal the key metabolites and related proteins, by constructing a metabolite-protein pathway network, Cytoscape 3.7.2 (Cytoscape Consortium, CA, USA) is used for network construction. The chemical structural formula, SMILE standard structural formula, and PubChem CID of ginsenoside Re were searched through the PubChem database (https://pubchem.ncbi.nlm.nih.gov/). Then import SwissTargetPrediction database (http://swisstargetprediction.ch/) and PharmMapper database (http://59.78.98.102/pharmmapper/get.php) to screen related targets. “Radiation” is used as keywords in GeneCards (https://www.genecards.org/), OMIM database (https://www.omim.org/), and DisGeNET (https://www.disgenet.org/). The intersection of disease target and drug target is used as the prediction target of drug action on disease. The Uniprot database (http://www.uniprot.org/) was used to standardize the names of genes and proteins. The target information of interaction between G-Re and radiation damage obtained above was imported into STRING database (https://string-db.org/) to obtain the correlation between potential targets. Cytoscape V3.7.2 software was used to visually analyze the results of protein interaction analysis in STRING database and construct protein-protein interaction network. Fourth, using the David (http://david.nifcrf.gov/) database, the obtained intersecting genes were subjected to a GO annotation analysis (gene-ontology) and a KEGG pathway analysis (Kyoto Encyclopedia of Genes and Genomes). Differential metabolites identified in metabolomics were introduced into Cytoscape with Metscape to obtain a compound-reaction-enzyme-gene network. This structure was carried out to visualize the interactions between metabolites, pathways, enzymes, and genes. Key metabolites and proteins are then identified by combining the compound-reaction-enzyme-gene network with central genes and metabolic pathways.
3. Results
3.1. The Levels of Pharmacodynamic Index in the Mice Serum
Colony forming unit-spleen (CFU-S) are the remaining hematopoietic stem cells with the ability to proliferate and divide after exposure to ionizing radiation [17]. They proliferate and differentiate in the spleen and finally form a certain number and size of splenic colonies, forming a rounded shape visible to the naked eye. Each splenic nodule is referred to as a splenic nodule forming unit. CFU-S and the changes in bone marrow DNA together represent the body's ability to restore hematopoietic tissue. As shown in Table 1, the spleen surface of the mice in the normal control group was smooth and no splenic nodules were formed. CFU-S gradually formed on the surface of the spleen after irradiation. Compared with the model, CFU-S increased in the G-Re group and the difference was statistically significant (P < 0.05). As shown in Table 1, compared with the normal group, the bone marrow DNA content of the model group was significantly reduced (P < 0.01), indicating that radiation would cause the bone marrow DNA content to decrease, and the damage to the bone marrow would seriously damage the normal function of the body's hematopoietic system. Compared with the model group, the bone marrow DNA content in the G-Re group was significantly greater, and the difference was extremely significant (P < 0.01).
Table 1.
Changes of G-Re on bone marrow DNA and spleen nodules in X-ray irradiated mice ( ± s, n = 10).
| Group | Bone marrow DNA (μg) | CFU-S |
|---|---|---|
| NC | 346.60 ± 30.39 | 0 |
| M | 298.55 ± 17.37∗∗ | 4.909 ± 1.700 |
| G-Re | 328.73 ± 16.95## | 6.909 ± 1.868# |
Significant difference compared with control group, ∗P < 0.05, ∗∗P < 0.01; significant difference compared with model group, #P < 0.05, ##P < 0.01.
Ionizing radiation can affect the production of cytokines, which have played a role in many radiation-related studies and have promoted bone marrow remodeling after radiotherapy and chemotherapy. As shown in Table 2, compared with the normal group, the serum concentrations of IL-2 and IL-12 in the radiation model group were significantly decreased, while the serum concentrations of IL-2 and IL-12 in the G-Re group were significantly increased (P < 0.05). After radiation, the serum IL-6 level of mice was detected, and the radiation model group had the highest level, and the difference was significant compared with the normal group (P < 0.01). The experimental results showed that compared with the model group, the G-Re group could effectively increase the IL-6 concentration, and the difference was significant (P < 0.05). As a glycoprotein of immunoglobulin, IgM can reflect the body's immune response to pathogens in the blood. After the mice were irradiated with X-rays, the concentration of IgM in the serum of irradiated mice was reduced. Among them, mice in the irradiated model group decreased the most, and the difference was statistically significant compared with the normal control group (P < 0.05). The results showed that the G-Re can increase the IgM concentration level, and the difference is statistically significant compared with the model group (P < 0.05).
Table 2.
Effects of G-Re on serum IL-2, IL-6, IL-12, and IgM in irradiated mice (‾x ± s,n = 10).
| Group | IL-2 (pg/mL) | IL-6 (pg/mL) | IL-12 (pg/mL) | IgM (μg/mL) |
|---|---|---|---|---|
| NC | 13.957 ± 1.245 | 13.897 ± 0.880 | 70.887 ± 9.250 | 0.623 ± 0.050 |
| M | 11.726 ± 1.539∗∗ | 15.315 ± 1.111∗∗ | 61.623 ± 6.368∗ | 0.562 ± 0.056∗ |
| G-Re | 13.769 ± 1.358# | 14.885 ± 1.057# | 66.500 ± 3.143# | 0.612 ± 0.042# |
Significant difference compared with control group, ∗P < 0.05, ∗∗P < 0.01; significant difference compared with model group, #P < 0.05, ##P < 0.01.
3.2. Multivariate Statistical Analysis of Serum Metabolic Profiles of Irradiated Mice
Changes of endogenous metabolites in serum of mice were induced by X-ray, and the data were analyzed by combining PCA and PLS-DA to screen the different potential metabolites. As shown in Figure 1(a) in the PCA in positive and negative ion mode, the sample points of the normal group and the model group were obviously separated, indicating that the serum metabolic profile of the mice after radiation injury was obviously disordered. A clear separation between the G-Re treated and model groups can be observed in the PCA score plot where each coordinate represents one sample, with significant differences in metabolites across samples. In order to further verify the separation of each sample in the normal group, the model group, and the ginsenoside dose group and to maximize the separation between groups, the supervised PLS-DA method was adopted, and the model established by this supervised method had a high interpretation rate and prediction rate. As can be shown from Figure 1(b), PLS-DA analysis significantly improved the ability of data separation and aggregation. The serum metabolic profile of the three groups of mice showed their own clustering, which were placed in three separate regions of the scatter score chart. In the PLS-DA diagram of the normal group and the radiation model group, the metabolic trajectories showed good similarity within each group and little crossover and overlap, which were far away from each other, indicating that obvious biological changes occurred in the serum of mice after radiation induction and also indicating that the metabonomics technology could effectively distinguish the difference between normal and radiation injury. As can be seen from the PLS-DA diagram of the normal group, the model group, and the G-Re group, there was a deviation trend between the G-Re group and the radiation model group, the G-Re group was more concentrated, and the intragroup difference was small, and the deviation was closer to the normal group. From the point of view of the hour, G-Re affected the serum metabolic profile of the radiation mice and alleviated the deviation caused by ionizing radiation.
Figure 1.

(a) PCA score of mice under positive (ESI+) and negative ion mode (ESI-); (b) PLS-DA analysis under positive (ESI+) and negative ion mode (ESI-); (c) statistical validations obtained by 200X permutation tests under positive (ESI+) and negative ion mode (ESI-); (d) VIP-plot under positive (ESI+) and negative ion mode (ESI-).
The stability and predictive power of the PLS-DA model should be evaluated by cross-validation (CV) and substitution experiments. As shown in Figure 1(c), R2X = 0.263, R2Y = 0.86, Q2 = 0.74 (negative ion mode) and R2X = 0.681, R2Y = 0.971, Q2 = 0.925 (positive ion mode), indicating that the PLS-DA model under the two ion modes has a low risk of overfitting and the model has a good predictive ability.
As shown in Figure 1, VIP-plot (D), in the “V-shaped distribution of ion fragments,” the closer the fragments to the top of the two sides, the greater the contribution rate to the change of metabolic profile trajectory, and red is the selected biomarker. Therefore, VIP >1 was selected as the criteria for screening potential biomarkers. The preliminary screened potential metabolites were tested by SPSS 21.0 software for t-test, and the variables without significant difference (P < 0.05) were excluded. HMDB, KEGG, and other databases were used to determine the structural information of the screened potential markers, which were imported into MetaboAnalyst 5.0 for online analysis of metabolic pathways. The corresponding pathways were analyzed and elaborated, and the corresponding metabolic pathways involved in the potential markers were sorted out.
3.3. Identification of Potential Biomarkers and Pathway Analysis
Through the search for QI software and HMDB and KEGG network database, 16 common and significantly different metabolites were screened as the characteristic biomarkers of radiated mice before and after intervention, as shown in Table 3. In the heat map of markers obtained by hierarchical clustering analysis, the horizontal axis represents different experimental groups, and the vertical axis represents the biomarkers compared in groups. Each row represents the expression levels of different markers in different samples and all markers in each sample. The color blocks in different positions represent the relative expression of the corresponding position markers. The changes in the content of 16 potential biomarkers in the serum of mice between each group can be directly seen from the heat map (Figure 2(a)). Potential biomarker content could be clearly distinguished between the normal group and the radiation model group, and the potential biomarker level could be clearly distinguished between the G-Re dose group and the model group. The level of potential markers in the G-Re dose group moved closer to the normal control group than the model group.
Table 3.
Potential biomarker information.
| No. | ESI mode | HMDBID | Metabolites | Chemical formula | VIP | RT (min) | m/z | Normal vs model trend | Model vs G-Re trend |
|---|---|---|---|---|---|---|---|---|---|
| 1 | − | HMDB0009156 | PE (18 : 3 (9Z, 12Z, 15Z)/18 : 0) | C41H76NO8P | 3.8777 | 1.954 | 740.50656 | Up | Down |
| 2 | − | HMDB0008429 | PC (20 : 4 (5Z, 8Z, 11Z, 14Z)/16 : 0) | C44H80NO8P | 2.5692 | 8.974 | 826.57028 | Down | Up |
| 3 | − | HMDB0001085 | Leukotriene B4 | C20H32O4 | 2.6425 | 3.290 | 671.46118 | Up | Down |
| 4 | − | HMDB0003337 | Oxidized glutathione | C20H32N6O12S2 | 1.4469 | 3.467 | 593.13535 | Down | Up |
| 5 | − | HMDB0002710 | Prostaglandin J2 | C20H30O4 | 3.1346 | 3.247 | 379.21586 | Down | — |
| 6 | − | HMDB0000673 | Linoleic acid | C18H32O2 | 4.7441 | 12.039 | 279.21364 | Down | Up |
| 7 | + | HMDB0010384 | LysoPC (18 : 0) | C26H54NO7P | 3.2924 | 6.363 | 524.37289 | Up | Down |
| 8 | + | HMDB0010385 | LysoPC (18 : 1 (11Z)) | C26H52NO7P | 1.3872 | 5.511 | 522.35657 | Up | Down |
| 9 | + | HMDB0010383 | LysoPC (16 : 1 (9Z)) | C24H48NO7P | 1.4353 | 4.513 | 494.32409 | Up | Down |
| 10 | + | HMDB0007981 | PC (16 : 0/20 : 3 (8Z, 11Z, 14Z)) | C44H82NO8P | 6.2389 | 6.158 | 806.60484 | Down | Up |
| 11 | + | HMDB0012096 | SM (d18 : 1/12 : 0) | C35H71N2O6P | 1.1461 | 7.789 | 669.49175 | Up | Down |
| 12 | + | HMDB0000220 | Palmitic acid | C16H32O2 | 8.4544 | 3.243 | 274.27847 | Up | Down |
| 13 | + | HMDB0004610 | Phytosphingosine | C18H39NO3 | 4.6911 | 3.272 | 318.30280 | Down | Up |
| 14 | + | HMDB0000638 | Dodecanoic acid | C12H24O2 | 2.6015 | 2.273 | 218.21566 | Down | – |
| 15 | + | HMDB0000269 | Sphinganine | C18H39NO2 | 1.7346 | 3.805 | 302.30810 | Down | Up |
| 16 | + | HMDB0000806 | Myristic acid | C14H28O2 | 2.6476 | 2.773 | 246.24757 | Down | Up |
Figure 2.

Heat map of cluster analysis of mouse serum metabolites and metabolic pathway analysis diagram.
Import the relevant 16 differential metabolite ion information table in the irradiated mouse serum into MetaboAnalyst 5.0 Pathway Analysis for topological analysis and set the critical value of the metabolic pathway impact value to 0.10, and the pathways higher than this value will be as a potential target path. As shown in Figure 2(b) and Table 4, serum metabolic pathways in radiation-damaged mice were mainly related to linoleic acid metabolism, sphingolipid metabolism, and glycerophospholipid metabolism. Under the intervention of G-Re, the content of metabolites was adjusted back, and the disorder of related metabolic pathways was improved. From the metabolic level, it was verified that G-Re had a better recovery effect on mice damaged by ionizing radiation.
Table 4.
Metabolic pathways associated with potential biomarkers in serum.
| Metabolic pathway | Total | Expected | Hits | Raw p | Holm adjust | FDR | Impact |
|---|---|---|---|---|---|---|---|
| Sphingolipid metabolism | 21 | 0.18 | 3 | 0.00056 | 0.04726 | 0.0269 | 0.158 |
| Linoleic acid metabolism | 5 | 0.04 | 2 | 0.00064 | 0.05317 | 0.0269 | 1.0 |
| Glycerophospholipid metabolism | 36 | 0.30 | 3 | 0.00281 | 0.23015 | 0.0786 | 0.216 |
| Fatty acid biosynthesis | 47 | 0.39 | 3 | 0.00604 | 0.48925 | 0.1268 | 0.015 |
| Biosynthesis of unsaturated fatty acids | 36 | 0.30 | 2 | 0.03484 | 1.0 | 0.4878 | 0.0 |
| Arachidonic acid metabolism | 36 | 0.30 | 2 | 0.03484 | 1.0 | 0.4878 | 0.020 |
| Alpha-linolenic acid metabolism | 13 | 0.11 | 1 | 0.10409 | 1.0 | 1.0 | 0.0 |
| Glycosylphosphatidylinositol (GPI)-anchor biosynthesis | 14 | 0.12 | 1 | 0.11167 | 1.0 | 1.0 | 0.004 |
| Glutathione metabolism | 28 | 0.23 | 1 | 0.21173 | 1.0 | 1.0 | 0.027 |
| Fatty acid elongation | 39 | 0.33 | 1 | 0.28293 | 1.0 | 1.0 | 0.0 |
| Fatty acid degradation | 39 | 0.33 | 1 | 0.28293 | 1.0 | 1.0 | 0.0 |
3.4. Network Pharmacology Analysis
In order to further explore the mechanism of G-Re on IR, we conducted a network pharmacology study. The intersection of disease-related genes and drug active ingredient-related targets was obtained, and 34 genes were obtained (Table 5). As shown in Figure 3(a), in order to identify the hub genes of G-Re and HUA, Cytoscape 3.8.2 was used for visual analysis to construct the protein-protein interaction network. At the same time, cytoHubba plug-in was used to screen the core targets, and the top 10 genes were considered as the hub genes combined with the scores of the calculation method (STAT3, SRC, EGFR, AKT1, MTOR, MAPK8, GRB2, PIK3CA, IL-2, and MMP9). GO annotation and KEGG pathway enrichment analysis of the obtained Re anti-IR potential target genes by David (Figures 3(b) and 3(c)). GO enrichment analysis showed mainly cellular response to chemical stress, peptidyl-serine phosphorylation, JUN kinase activity, sphingolipid blinding, protein autophosphorylation, and regulation of reactive oxygen species metabolic process. According to the KEGG enrichment analysis, the significantly affected pathways were FoxO signaling pathway, sphingolipid signaling pathway, PI3K-Akt signaling pathway, MAPK signaling pathway, chemokine signaling pathway, TNF signaling pathway, B cell receptor signaling pathway, and adipocytokine signaling pathway.
Table 5.
Target information of G-Re in the treatment of IR in network pharmacology.
| No. | Gene symbol | Uniprot ID | Protein name |
|---|---|---|---|
| 1 | STAT3 | P40763 | Signal transducer and activator of transcription 3 |
| 2 | IL2 | P60568 | Interleukin-2 |
| 3 | AKT2 | P31751 | Serine/threonine-protein kinase AKT2 |
| 4 | ROCK1 | Q13464 | Rho-associated protein kinase 1 |
| 5 | AKT1 | P31749 | Serine/threonine-protein kinase AKT |
| 6 | S1PR1 | P21453 | Sphingosine 1-phosphate receptor Edg-1 |
| 7 | IGF1R | P08069 | Insulin-like growth factor I receptor |
| 8 | EGFR | P00533 | Epidermal growth factor receptor erbB1 |
| 9 | MMP1 | P03956 | Matrix metalloproteinase 1 |
| 10 | MAPK8 | P45983 | Mitogen-activated protein kinase 8 |
| 11 | MAPK9 | P45984 | Mitogen-activated protein kinase 9 |
| 12 | SYK | P43405 | Tyrosine-protein kinase SYK |
| 13 | GRB2 | P62993 | Growth factor receptor-bound protein 2 |
| 14 | MTOR | P42345 | Serine/threonine-protein kinase mTOR |
| 15 | DPP4 | P27487 | Dipeptidyl peptidase IV |
| 16 | SLC37A4 | O43826 | Glucose-6-phosphate translocase |
| 17 | LTB4R | Q15722 | Leukotriene B4 receptor 1 |
| 18 | PIK3CA | P42336 | PI3-kinase p110-alpha subunit |
| 19 | CSF1R | P07333 | Macrophage colony stimulating factor receptor |
| 20 | ADRB2 | P07550 | Adrenergic receptor beta |
| 21 | NTRK1 | P04629 | Nerve growth factor receptor Trk-A |
| 22 | NTRK2 | Q16620 | Neurotrophic tyrosine kinase receptor type 2 |
| 23 | ROCK2 | O75116 | Rho-associated protein kinase 2 |
| 24 | HDAC6 | Q9UBN7 | Histone deacetylase 6 |
| 25 | MMP9 | P14780 | Matrix metalloproteinase 9 |
| 26 | MMP2 | P08253 | Matrix metalloproteinase 2 |
| 27 | CDK2 | P24941 | Cyclin-dependent kinase 2 |
| 28 | SELL | P14151 | Leukocyte adhesion molecule-1 |
| 29 | SELP | P16109 | P-selectin |
| 30 | SRC | P12931 | Src tyrosine kinase |
| 31 | GSR | P00390 | Glutathione reductase |
| 32 | SOD2 | P04179 | Superoxide dismutase |
| 33 | PPP5C | P53041 | Serine/threonine-protein phosphatase 5 |
| 34 | PLA2G2A | P14555 | Phospholipase A2 |
Figure 3.

Network pharmacology analysis of Ginsenoside Re in the treatment of IR. (a) PPI network diagram of RE treating IR. Node color reflects its degree; (b) diagram of the results from the KEGG pathway enrichment analysis (P ≤ 0.05); (c) pie chart and bar chart of the results from the GO enrichment analysis (P ≤ 0.05).
3.5. Comprehensive Analysis of Metabolomics and Network Pharmacology
To comprehensively understand the mechanism of G-RE against IR, we constructed an interaction network based on metabolomics and network pharmacology. The differential metabolites were imported into the MetScape plug-in of Cytoscape, and the compound-reaction-enzyme-gene network was collected (Figure 4). By matching potential targets identified in network pharmacology with genes in MetScape analysis, we found GSR and PLA2G2 are related to oxidized glutathione and linoleic acid, and PPP5, ROCK1, ROCK2, AKT1, AKT2, CDK2, MAPK8, EGFR, IGF1R, CSF1R, NTRK2, NTRK1, SRC, and SYK are related to palmitic acid, dodecanoic acid, and myristic acid (Table 6). They may play an important role in the therapeutic effect of G-Re on IR. Among these genes, SRC, EGFR, AKT1, and MAPK8 are the hub genes.
Figure 4.

Compound-reaction-enzyme-gene network of key metabolites and targets. Red hexagons, gray diamonds, green round rectangles, and purple circles represent active compounds, reactions, proteins, and genes, respectively.
Table 6.
Information on key target genes, metabolites, and metabolic pathways.
| Related pathways | Related target gene | Related metabolites |
|---|---|---|
| Linoleic acid metabolism | PLA2G2A | Linoleic acid |
| Fatty acid biosynthesis | PPP5, ROCK1, ROCK2, AKT1, AKT2, CDK2, MAPK8, EGFR, IGF1R, CSF1R, NTRK2, NTRK1, SRC, SYK | Palmitic acid, dodecanoic acid, myristic acid |
| Glutathione metabolism | GSR | Oxidized glutathione |
4. Discussion
The metabolites of the body change with the pathological changes of the body, and the identification of these changes through metabolomics can provide valuable information about the effects of radiation on health, help to find the potential markers of disease, and provide a new opportunity to elucidate the development mechanism of radiation-induced injury. In our experiment, we discovered 16 kinds of G-Re metabolites to IR and their related pathways. But metabolomics research is limited to listing potential metabolites and related pathways, without further exploring their direct relationship. Network pharmacology can further verify the therapeutic regulation of metabolic networks and promote the identification of key targets and biomarkers. By combining metabolomics and network pharmacology, four hub genes (SRC, EGFR, AKT1, and MAPK8), five key metabolites (linoleic acid, palmitic acid, dodecanoic acid, myristic acid, and oxidized glutathione) and four related pathways (linoleic acid metabolism, fatty acid biosynthesis, and glutathione metabolism) were discovered. This comprehensive strategy found the core target and mechanism and provided a more accurate G-Re counter-IR network (Figure 5).
Figure 5.
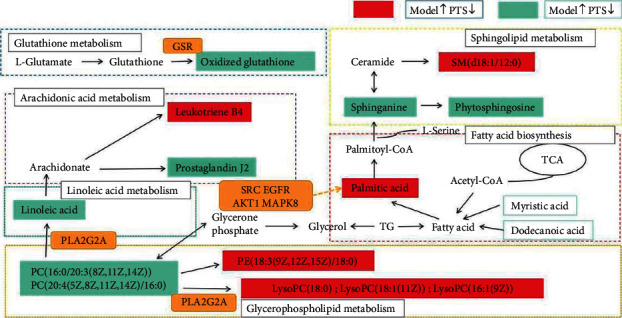
Network of the potential biomarkers associated with IR.
4.1. Linoleic Acid
Linoleic acid is a short-chain polyunsaturated fatty acid, which is an essential nutrient for the human body. It exists in animal fat in the form of glycerol ester together with other fatty acids and is the core component of the plasma membrane of most cells. It can lower cholesterol, soften blood vessels, prevent cardiovascular diseases, and promote lipid metabolism [18]. Phospholipase A2 is an esterase that catalyzes glycerophospholipid to produce fatty acids and lysophospholipids. PLA2G2A, a member of the phospholipase family, is a secretory phospholipase with a molecular weight of only 16 kDa [19]. Most of the currently known functions of PLA2G2A are related to inflammation, immune response, antithrombosis, cell proliferation, ischemic injury, and allergic reactions [20]. Linoleic acid can be constituted by phosphatidylcholines (PC) under the action of PLA2G2A and participate in the body's lipid metabolism.
Our experimental results show that the content of linoleic acid in the model group is significantly lower than that in the control group. It is speculated that IR may activate excess reactive oxygen species, while linoleic acid belongs to unsaturated double bonds containing unsaturated fatty acids and polyunsaturated fatty acids. The double bond is very sensitive to IR and is easily affected by hydrogen peroxide to cause structural changes, damage the cell membrane, and directly affect the immune function of the human body. G-Re can regulate the abnormal linoleic acid metabolism pathway in mice and increase the level of linoleic acid in serum, so as to reduce the cell damage of the body.
4.2. Sphingolipid Metabolism
Results of network pharmacology showed that the sphingolipid signaling pathway is included in the KEGG of being reintervened with IR-related genes, which is consistent with the results of metabolomics analysis. Sphingolipid metabolism is a complex reaction of sphingosine-based compounds in animal and plant membranes, especially in nerve cell membranes or in the rich myelin sheath of brain tissues and central nervous system tissues. Sphingolipids provide many bioactive metabolites that regulate cell proliferation, differentiation, and apoptosis, such as ceramide, sphingosine, and 1-phosphate sphingosine, which play an important role in cell signal molecular transduction [21]. To clarify the mechanism of sphingolipid metabolism and its relationship with diseases lays a foundation for clinical treatment. Therefore, the study of sphingolipid metabolism is of great significance for understanding the changes of serum metabolism before and after radiation injury. The differential metabolites mapped in sphingolipid metabolism in this experiment mainly included sphingomyelin (SM (d18 : 1/12 : 0)), sphinganine, and phytosphingosine metabolites. Among them, the metabolites of SM (d18 : 1/12 : 0) changed significantly. Compared with the normal control group, the index of SM (d18 : 1/12 : 0) in the radiation model group increased. Sphingomyelin is composed of sphingosine, phosphocholine, and fatty acid. It can generate ceramide under the action of sphingomyelinase. It is contained in the lipid membrane of the cell and is especially abundant in the membranous myelin sheath of nerve cell axons. This may be explained by the decrease in sphingomyelinase activity after radiation, which leads to the accumulation of sphingomyelin in the blood. However, in the dose group after G-Re treatment, SM (d18 : 1/12 : 0) was significantly downregulated in comparison with the model group. It may be due to the recovery of sphingomyelinase activity after G-Re treatment, which reduces the accumulation of sphingomyelin. As a second messenger, ceramide exists between the cell membrane and cytoplasm and is an essential cell signaling factor related to IR, oxidative stress, and inflammation. It can inhibit the oxidative stress response caused by TNF-alpha and to reduce the release of ROS [22]. Sphinganine is catalyzed by ceramidase to produce ceramides, and then the synthesis of ceramides is blocked due to the lack of sphingolipase, and the content of ceramides decreases, thus affecting the synthesis of sphinganine. Phytosphingosine is a class of lipid compounds with immuno-enhancing activity. It can be used as a precursor of ceramide and can induce cell apoptosis. It was found that the contents of sphinganine and phytosphingosine were significantly decreased in the model group compared with the normal group, while G-Re could significantly regulate the contents of sphinganine and phytosphingosine, thereby further regulating sphingolipid metabolism.
4.3. Glycerolipid Metabolism
Metabolites that changed significantly in glycerophospholipid metabolism included phosphatidylcholines (PC) and lysophosphatidylcholines (LysoPC) and phosphatidylethanolamine (PE). Glycerolipid metabolism is involved in the metabolism of serum samples, which are a special hydrolysis reaction existing in the body and an important metabolic pathway in the study of the pathogenesis of many diseases. It can be seen that glycerolipid metabolism is of great significance to the exploration of lipid metabolism in the body [23].
Phosphatidylcholine is the main glycerophospholipid that participates in the metabolism of glycerophospholipids and is also the principal component of cell membrane lipoprotein and lipid bilayer structure. It holds the unique characteristics of polar and nonpolar parts. It can be inserted into its own cell membrane to prevent lipid peroxidation, inhibit the breakage of lipid disulfide bonds, prevent cells from being destroyed and apoptosis, and maintain their cell integrity [23]. Lysophosphatidylcholine in the blood is drawn from the hydrolysis of phosphatidylcholine by phospholipase A2 (PLA2). LysoPC plays its biological function by activating ion channels, inducing cell apoptosis and increasing oxidative stress-induced inflammation and can activate a variety of immune cells. IR affects the activity of phospholipase and causes changes in the content of phosphatidylcholine, which will lead to a large number of lysophosphatidylcholine compounds aggregation inflammation, leading to serious functional disorders of the body and the development of diseases with metabolic abnormalities [25]. PLA2G2A screened by network pharmacology is the coding gene of small molecular weight secreted phospholipase A2IIA, which is associated with the process of PC synthesis of LysoPC. It corresponds to our metabolomics results.
PC (20 : 4 (5Z, 8Z, 11Z, 14Z)/16 : 0) and PC (16 : 0/20 : 3 (8Z, 11Z, 14Z)) belongs to phosphatidylcholine. We found that compared with the normal group, the content of phosphatidylcholine in the radiation model group was reduced, and the decrease in PC content after ionizing radiation may be due to radiation-induced damage to body cells and accelerated metabolism, thereby increasing the absorption of PC in the blood, while the content of the G-Re group was significant upregulation, which may inhibit cell damage caused by IR and protect cell integrity by unregulated phosphatidylcholine. Lysophosphatidylcholines (LysoPC (16 : 1 (9Z)), LysoPC (18 : 1 (11Z)), and LysoPC (18 : 0)) are involved in the metabolism of glycerophospholipids and are monoglycerophospholipids. It is converted from phosphatidylcholine and plays a major role in lipid metabolism, energy metabolism, and oxidative damage to the body. In general, the content of LysoPC in cells or tissues is low under normal conditions, but when the content is too high, it can damage the membrane system of cells. In this experiment, LysoPC (18 : 0), LysoPC (18 : 1 (11Z)), and LysoPC (16 : 1 (9Z)) are all upregulated in the radiation model group, indicating that IR leads to a high content of lysophatidylcholine thus affecting the permeability of vascular endothelial cells. It can also accelerate inflammation of blood vessels, affect platelet aggregation process, and cause hemolysis or necrosis of tissue cells, doing harm to the body. Compared with the model group, the content level after G-Re was significantly decreased. PC generates phosphatidylserine under the catalysis of phosphatidylserine synthase and further obtains phosphatidylethanolamine (PE) by phosphatidylserine decarboxylase [26]. In our experiment, it was found that PE (18 : 3 (9Z, 12Z, 15Z)/18 : 0) content increased after radiation, while G-Re can reduce LysoPC and PE content, increase PC content, regulate the balance of glycerophospholipid metabolism, and achieve the effect of anti-ionizing radiation.
4.4. Fatty Acid Biosynthesis
In addition, studies have also found that palmitic acid, myristic acid, and dodecanoic acid are involved in the fatty acid biosynthesis, which are structural components of cell biofilms. IR induces damage to mitochondrial structure and function, aggravates cellular oxidative stress, and results in the deposition of fatty acids in the cytoplasm, resulting in the inability of their products to be effectively utilized or transported, resulting in accumulation and impaired fatty acid metabolism. The experiment showed that the content of palmitic acid increased in the model group, but decreased significantly in the G-Re group. It was speculated that G-Re could also restore lipid metabolism disorder by regulating fatty acid metabolism.
In addition, hub genes (SRC, EGFR, AKT1, and MAPK8) screened by network pharmacology analysis were correlated with palmitic acid. As a core member of SRC family protein tyrosine kinases (SFKs), SRC plays an important role in mitosis, cell growth, and tumorigenesis [27, 28]. Epidermal growth factor receptor (EGFR) is a glycoprotein receptor on the surface of cell membrane, belonging to Erb B receptor family, and a receptor tyrosine kinase (RTK). EGFR has tyrosine kinase activity. When combined with ligand-EGF, EGFR can phosphorylate tyrosine residues, activate EGFR, and promote the growth and proliferation of tumor cells [29, 30]. EGFR-associated antibodies and inhibitors have proved to be useful for tumor therapy in basic oncology studies [31]. AKT1 is a serine/threonine kinase that plays an important role in cell metabolism, cell survival, cell cycle regulation, transcriptional regulation, and other biological processes [32]. Akt can inhibit cell apoptosis, and Akt can block the activity of metabolic inhibitory kinases such as AMP-activated protein kinase (AMPK) and upregulate the metabolic activity of cells. It also inactivates cell cycle kinase inhibitors (p21, P27, etc.), thereby promoting cell growth, survival, and tumor-formation [33, 34]. MAPK8 (mitogen-activated protein kinase 8) gene, also known as JNK1/SAPK1 gene, is an important signal molecule in the MAPK signal transduction pathway, whose functions involve various mechanisms such as cell proliferation, cell differentiation, and apoptosis [35]. TNFα can promote adipocyte apoptosis, inhibit adipocyte differentiation, promote mature adipocyte dedifferentiation, promote intracellular lipolysis, and so on [36]. MAPK8 gene is an important signaling molecule in the above pathway of TNFα, which not only acts as an essential gene in the apoptosis mechanism but also initiates the death signaling pathway and apoptosis by inducing mitochondrial cytochrome C release [37]. All of these four hub genes are associated with the biosynthesis of fatty acid, maintaining cell growth, maintaining cell membrane stability, and regulating the conduction of receptor signals and other inflammatory reactions by affecting the functions of immune cells and inflammatory cells.
In summary, lipid metabolism is many complex and important biochemical reactions in the body and the basis of maintaining homeostasis, and ionizing radiation can cause metabolism of lipids in the blood and other tissues and organs and their substance and abnormality of lipid caused by abnormal accumulation, enhance the pathophysiological changes in oxidative stress, and affect the level of lipid and lipid metabolism imbalance. In our experiment, it was found that there were obvious lipid metabolism disorders in radiation-damaged mice, among which the most critical ones were linoleic acid metabolism, sphingolipid metabolism, and glycerolipid metabolism. G-Re can effectively regulate the metabolic level.
4.5. Glutathione Metabolism
Oxidative stress is a state in which excessive reactive oxygen species are produced in the body or the antioxidant defense function is weakened, and the balance between oxidation and antioxidant is damaged, resulting in tissue or cell damage [38]. Glutathione plays an important role in maintaining normal physiological activities of cells and is an important bioactive substance, antioxidant, and reducing buffer in the human body. It can activate the REDOX system and activate mercapto enzyme, thereby effectively removing free radicals and other reactive oxygen species and promoting carbohydrate metabolism, fat metabolism, and protein metabolism, thus effectively regulating cell membrane metabolism [39]. Glutathione comes in two forms, reduced glutathione (GSH) and oxidized glutathione (GSSG). However, GSSG can only act as reduction and oxidation when it is converted into reduced GSH under the action of nicotinamide adenine dinucleotide phosphate (NADPH) and GSR [40]. In our experiment, it was found that the content of GSSG decreased after radiation, while G-RE could effectively increase the activity of GSSG and reduce the level of oxidative stress.
5. Conclusion
In this study, a new comprehensive strategy was used to explore the key targets and mechanisms of Ginsenoside Re in the treatment of radiation damage based on the combination of metabolomics and network pharmacology. Pharmacodynamic analysis shows that G-Re can improve the thymus and spleen index, bone marrow DNA, and cytokine levels of radiation-damaged mice, reduce oxidative stress, and protect their hematopoietic system. Based on multivariate statistical analysis, a total of 16 potential biomarkers were identified in serum samples. These biomarkers are closely related to the occurrence and development of radiation damage. In addition, analysis of metabolic pathways showed that glycerophospholipid metabolism, linoleic acid metabolism, and sphingolipid metabolism were regulated in radiation injury model mice after G-Re intervention. Comprehensive network pharmacology and metabolomic analysis revealed 4 key targets and related metabolites and pathways, which were further validated by molecular docking. In conclusion, this study clarified the efficacy and potential mechanism of G-Re in improving radiation damage from the perspective of metabolomics and provided a method reference for analyzing the potential therapeutic effects and pharmacological mechanisms of TCM.
Although metabolomics and traditional Chinese medicine have been cross-studied, there are still many thought-provoking questions. Due to the existing analysis, technology is not perfect. It is impossible to completely analyze all the markers and trace metabolites of metabolic pathways in the organism. Secondly, according to the data analysis results of metabolomics, several differential metabolites and related metabolic pathways are selected to summarize the whole. However, whether the selected metabolites are appropriate and whether the metabolic stages of the intercepted pathways are comprehensive remain to be discussed. Our future research needs to focus on some differential metabolites screened, such as oxidized glutathione, linoleic acid, and palmitic acid, to further validate biomarkers and conduct quantitative analysis to determine the correlation between their amounts and radiation effects at different stages. It also needs to be integrated with multiomics to make metabolomics research more clear and comprehensive to study the mechanism of radiation damage.
Acknowledgments
This work was supported by the Natural Science Foundation of Heilongjiang (No. H2016084) and http://dxPostdoctoral Scientific Research Development Fund of Heilongjiang Province (No. LBH-Q19186).
Abbreviations
- IR:
Ionizing radiation
- TCM:
Traditional Chinese medicine
- G-Re:
Ginsenoside Re
- ROS:
Reactive oxygen species
- CFU-S:
Colony forming unit-spleen
- HMDB:
Human Metabolome Database
- KEGG:
Kyoto Encyclopedia of Genes and Genomes
- VIP:
Variable importance projection
- PPI:
protein interaction
- PCA:
Principal component analysis
- PLS-DA:
Partial least squares discriminant analysis
- LysoPC:
Lysophatidylcholine
- SRC:
Src tyrosine kinase
- EGFR:
Epidermal growth factor receptor
- AKT:
Serine/threonine-protein kinase
- MAPK8:
Mitogen-activated protein kinase 8
- PC:
Phosphatidylcholines
- PE:
Phosphatidylethanolamine.
Data Availability
The data used to support the findings of this study are included within the article.
Disclosure
jiaqi Fu is the co-first author.
Conflicts of Interest
The authors declare that there are no conflicts of interest.
Authors' Contributions
Chunmiao Yu and Jiaqi Fu contributed equally to this work. Chunmiao Yu did formal analysis, visualized the study, wrote the original draft, and developed the methodology. Jiaqi Fu did formal analysis and wrote the original draft. Lidong Guo was responsible for software and reviewed and edited the manuscript; Miaomiao Yu curated the data; Donghua Yu conceptualized the study, reviewed and edited the manuscript, and did funding acquisition. All authors contributed to the review of the manuscript and approved the final version for publication.
References
- 1.Guo H. Ionizing radiation and its types. China Metrology . 2007;43 [Google Scholar]
- 2.Kamiya K., Ozasa K., Akiba S., et al. Long-term effects of radiation exposure on health. The Lancet . 2015;386(9992):469–478. doi: 10.1016/s0140-6736(15)61167-9. [DOI] [PubMed] [Google Scholar]
- 3.Akashi M. Long-term effects of low dose radiation exposure on health. Rinsho Ketsueki . 2012;53:p. 1883. [PubMed] [Google Scholar]
- 4.Christensen D. M., Iddins C. J., Sugarman S. L. Ionizing radiation injuries and illnesses. Emergency Medicine Clinics of North America . 2014;32(1):245–265. doi: 10.1016/j.emc.2013.10.002. [DOI] [PubMed] [Google Scholar]
- 5.Beerman I., Bhattacharya D., Zandi S., et al. Functionally distinct hematopoietic stem cells modulate hematopoietic lineage potential during aging by a mechanism of clonal expansion. Proceedings of the National Academy of Sciences . 2010;107(12):5465–5470. doi: 10.1073/pnas.1000834107. [DOI] [PMC free article] [PubMed] [Google Scholar]
- 6.Shao L., Luo Y., Zhou D. Hematopoietic stem cell injury induced by ionizing radiation. Antioxidants & Redox Signaling . 2014;20(9):1447–1462. doi: 10.1089/ars.2013.5635. [DOI] [PMC free article] [PubMed] [Google Scholar]
- 7.Liu M. Analysis on the medicinal properties and efficacy of ginseng. Journal of Shandong University of Traditional Chinese Medicine . 2012;36:p. 110. [Google Scholar]
- 8.Yue X. New progress of ginseng physicochemical and clinical research. Chinese Prescription Drugs . 2018;16:p. 10. [Google Scholar]
- 9.Wang E., Chen X., Xu X. Study on the protective effect of panaxatriol group saponins on RSa cell injury induced by UVC irradiation. Shizhen Chinese Medicine and Chinese Medicine . 2013;24:p. 1873. [Google Scholar]
- 10.Peng L., Sun S., Xie L.-H., Wicks S. M., Xie J.-T. Ginsenoside re: pharmacological effects on cardiovascular system. Cardiovascular Therapeutics . 2012;30(4):e183–e188. doi: 10.1111/j.1755-5922.2011.00271.x. [DOI] [PubMed] [Google Scholar]
- 11.Zhang H., Wang E., Chen X., et al. Protective effect of ginsenoside Re on cells damaged by UVC radiation. Journal of Jilin University (Medical Edition) . 2013;39:p. 507. [Google Scholar]
- 12.Nicholson J. K., Lindon J. C. Systems biology: metabonomics. Nature . 2008;455(7216):1054–1056. doi: 10.1038/4551054a. [DOI] [PubMed] [Google Scholar]
- 13.Zhang A., Sun H., Wang X. Serum metabolomics as a novel diagnostic approach for disease: a systematic review. Analytical and Bioanalytical Chemistry . 2012;404(4):1239–1245. doi: 10.1007/s00216-012-6117-1. [DOI] [PubMed] [Google Scholar]
- 14.James E. L., Parkinson E. K. Serum metabolomics in animal models and human disease. Current Opinion in Clinical Nutrition and Metabolic Care . 2015;18(5):478–483. doi: 10.1097/mco.0000000000000200. [DOI] [PubMed] [Google Scholar]
- 15.Li S., Zhang B. Traditional Chinese medicine network pharmacology: theory, methodology and application. Chinese Journal of Natural Medicines . 2013;11(2):110–120. doi: 10.1016/s1875-5364(13)60037-0. [DOI] [PubMed] [Google Scholar]
- 16.Zhang R., Zhu X., Bai H., Ning K. Network pharmacology databases for traditional Chinese medicine: review and assessment. Frontiers in Pharmacology . 2019;10:p. 123. doi: 10.3389/fphar.2019.00123. [DOI] [PMC free article] [PubMed] [Google Scholar]
- 17.Bing W., Kaoru T., Yasuharu N., et al. Increased hematopoietic stem cells/hematopoietic progenitor cells measured as endogenous spleen colonies in radiation-induced adaptive response in mice (yonezawa effect) Dose-Response . 2018;16 doi: 10.1177/1559325818790152. [DOI] [PMC free article] [PubMed] [Google Scholar]
- 18.Vangaveti V. N., Jansen H., Kennedy R. L., Malabu U. H. Hydroxyoctadecadienoic acids: icropte derivatives of linoleic acid and their role in inflammation associated with metabolic syndrome and cancer. European Journal of Pharmacology . 2016;785:70–76. doi: 10.1016/j.ejphar.2015.03.096. [DOI] [PubMed] [Google Scholar]
- 19.Birts C. N., Barton C. H., Wilton D. C. Catalytic and non-catalytic functions of human IIA phospholipase A2. Trends in Biochemical Sciences . 2010;35(1):28–35. doi: 10.1016/j.tibs.2009.08.003. [DOI] [PubMed] [Google Scholar]
- 20.Murakami M., Taketomi Y., Sato H., Yamamoto K. Secreted phospholipase A2 revisited. Journal of Biochemistry . 2011;150(3):233–255. doi: 10.1093/jb/mvr088. [DOI] [PubMed] [Google Scholar]
- 21.Hannun Y. A., Obeid L. M. Sphingolipids and their metabolism in physiology and disease. Nature Reviews Molecular Cell Biology . 2018;19(3):175–191. doi: 10.1038/nrm.2017.107. [DOI] [PMC free article] [PubMed] [Google Scholar]
- 22.Aureli M., Murdica V., Loberto N., et al. Exploring the link between ceramide and ionizing radiation. Glycoconjugate Journal . 2014;31(6-7):449–459. doi: 10.1007/s10719-014-9541-y. [DOI] [PubMed] [Google Scholar]
- 23.Wu F.-Z., Xu W.-J., Deng B., et al. Wen-Luo-Tong decoction attenuates paclitaxel-induced peripheral neuropathy by regulating linoleic acid and glycerophospholipid metabolism pathways. Frontiers in Pharmacology . 2018;9:p. 956. doi: 10.3389/fphar.2018.00956. [DOI] [PMC free article] [PubMed] [Google Scholar]
- 24.Yu C., Fu J., Guo L., Lian L., Yu D. UPLC-MS-based serum metabolomics reveals protective effect of Ganoderma lucidum polysaccharide on ionizing radiation injury. Journal of Ethnopharmacology . 2020;258 doi: 10.1016/j.jep.2020.112814.112814 [DOI] [PubMed] [Google Scholar]
- 25.Liu P., Zhu W., Chen C., et al. The mechanisms of lysophosphatidylcholine in the development of diseases. Life Sciences . 2020;247 doi: 10.1016/j.lfs.2020.117443.117443 [DOI] [PubMed] [Google Scholar]
- 26.Cole L. K., Vance J. E., Vance D. E. Phosphatidylcholine biosynthesis and lipoprotein metabolism. Biochimica et Biophysica Acta (BBA)-Molecular and Cell Biology of Lipids . 2012;1821(5):754–761. doi: 10.1016/j.bbalip.2011.09.009. [DOI] [PubMed] [Google Scholar]
- 27.Roskoski R. Src protein-tyrosine kinase structure, mechanism, and small molecule inhibitors. Pharmacological Research . 2015;94:9–25. doi: 10.1016/j.phrs.2015.01.003. [DOI] [PubMed] [Google Scholar]
- 28.Roskoski R. Src protein-tyrosine kinase structure and regulation. Biochemical and Biophysical Research Communications . 2004;324(4):1155–1164. doi: 10.1016/j.bbrc.2004.09.171. [DOI] [PubMed] [Google Scholar]
- 29.Seshacharyulu P., Ponnusamy M. P., Haridas D., Jain M., Ganti A. K., Batra S. K. Targeting the EGFR signaling pathway in cancer therapy. Expert Opinion on Therapeutic Targets . 2012;16(1):15–31. doi: 10.1517/14728222.2011.648617. [DOI] [PMC free article] [PubMed] [Google Scholar]
- 30.Sigismund S., Avanzato D., Lanzetti L. Emerging functions of the EGFR in cancer. Molecular Oncology . 2018;12(1):3–20. doi: 10.1002/1878-0261.12155. [DOI] [PMC free article] [PubMed] [Google Scholar]
- 31.Xu L., Hausmann M., Dietmaier W., et al. Expression of growth factor receptors and targeting of EGFR in cholangiocarcinoma cell lines. BMC Cancer . 2010;10(1):p. 302. doi: 10.1186/1471-2407-10-302. [DOI] [PMC free article] [PubMed] [Google Scholar]
- 32.Quan J.-H., Cha G.-H., Zhou W., Chu J.-Q., Nishikawa Y., Lee Y.-H. Involvement of PI 3 kinase/Akt-dependent bad phosphorylation in toxoplasma gondii-mediated inhibition of host cell apoptosis. Experimental Parasitology . 2013;133(4):462–471. doi: 10.1016/j.exppara.2013.01.005. [DOI] [PubMed] [Google Scholar]
- 33.Hahn-Windgassen A., Nogueira V., Chen C.-C., Skeen J. E., Sonenberg N., Hay N. Akt activates the mammalian target of rapamycin by regulating cellular ATP level and AMPK activity. Journal of Biological Chemistry . 2005;280(37):32081–32089. doi: 10.1074/jbc.m502876200. [DOI] [PubMed] [Google Scholar]
- 34.Qiao M., Sheng S., Pardee A. B. Metastasis and AKT activation. Cell Cycle . 2008;7(19):2991–2996. doi: 10.4161/cc.7.19.6784. [DOI] [PubMed] [Google Scholar]
- 35.Kim S.-W., Muise A. M., Lyons P. J., Ro H.-S. Regulation of adipogenesis by a transcriptional repressor that modulates MAPK activation. Journal of Biological Chemistry . 2001;276(13):10199–10206. doi: 10.1074/jbc.m010640200. [DOI] [PubMed] [Google Scholar]
- 36.Souza S. C., Palmer H. J., Kang Y.-H., et al. TNF-? induction of lipolysis is mediated through activation of the extracellular signal related kinase pathway in 3T3-L1 adipocytes. Journal of Cellular Biochemistry . 2003;89(6):1077–1086. doi: 10.1002/jcb.10565. [DOI] [PubMed] [Google Scholar]
- 37.Tournier C., Hess P., Yang D. D., et al. Requirement of JNK for stress- induced activation of the cytochrome c-mediated death pathway. Science . 2000;288(5467):870–874. doi: 10.1126/science.288.5467.870. [DOI] [PubMed] [Google Scholar]
- 38.Zhao L., Cui C., Liu Q., et al. Combined exposure to hypoxia and ammonia aggravated biological effects on glucose metabolism, oxidative stress, inflammation and apoptosis in largemouth bass (icropterus salmoides) Aquatic Toxicology . 2020;224 doi: 10.1016/j.aquatox.2020.105514.105514 [DOI] [PubMed] [Google Scholar]
- 39.Wu G., Fang Y.-Z., Yang S., Lupton J. R., Turner N. D. Glutathione metabolism and its implications for health. Journal of Nutrition . 2004;134(3):489–492. doi: 10.1093/jn/134.3.489. [DOI] [PubMed] [Google Scholar]
- 40.Flohé L. The fairytale of the GSSG/GSH redox potential. Biochimica et Biophysica Acta (BBA)-General Subjects . 2013;1830(5):3139–3142. doi: 10.1016/j.bbagen.2012.10.020. [DOI] [PubMed] [Google Scholar]
Associated Data
This section collects any data citations, data availability statements, or supplementary materials included in this article.
Data Availability Statement
The data used to support the findings of this study are included within the article.