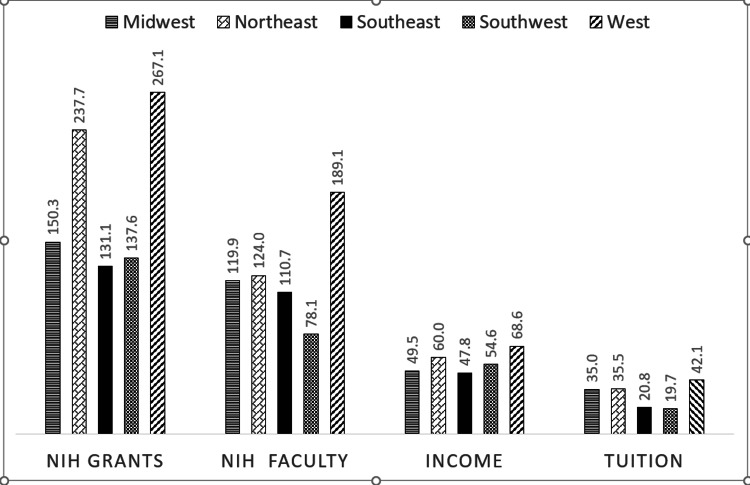
Figure 4. Distribution of research and institutional financial resources of medical schools by United States regions.
Values are from the Association of American Medical Colleges (AAMC) Faculty Roster Benchmark Report and are in percentages.
* One-way analysis of variance (ANOVA) was used to determine statistically significant differences. All the distributions above were statistically significant with p<0.001.
NIH grants: National Institute of Health (NIH) funds granted to medical school and affiliated hospitals (in millions)
NIH faculty funds: NIH research grant funds per faculty member (in thousands)
Income: Median income (in thousands) of the zip-code in which medical school is located
Tuition: Tuition (in thousands) out of state charged by the medical school

