

Abstract
Frontotemporal dementia in genetic forms is highly heterogeneous and begins many years to prior symptom onset, complicating disease understanding and treatment development. Unifying methods to stage the disease during both the presymptomatic and symptomatic phases are needed for the development of clinical trials outcomes. Here we used the contrastive trajectory inference (cTI), an unsupervised machine learning algorithm that analyzes temporal patterns in high‐dimensional large‐scale population datasets to obtain individual scores of disease stage. We used cross‐sectional MRI data (gray matter density, T1/T2 ratio as a proxy for myelin content, resting‐state functional amplitude, gray matter fractional anisotropy, and mean diffusivity) from 383 gene carriers (269 presymptomatic and 115 symptomatic) and a control group of 253 noncarriers in the Genetic Frontotemporal Dementia Initiative. We compared the cTI‐obtained disease scores to the estimated years to onset (age—mean age of onset in relatives), clinical, and neuropsychological test scores. The cTI based disease scores were correlated with all clinical and neuropsychological tests (measuring behavioral symptoms, attention, memory, language, and executive functions), with the highest contribution coming from mean diffusivity. Mean cTI scores were higher in the presymptomatic carriers than controls, indicating that the method may capture subtle pre‐dementia cerebral changes, although this change was not replicated in a subset of subjects with complete data. This study provides a proof of concept that cTI can identify data‐driven disease stages in a heterogeneous sample combining different mutations and disease stages of genetic FTD using only MRI metrics.
Keywords: disease progression, frontotemporal dementia, magnetic resonance imaging, unsupervised machine learning
Unifying methods to stage genetic frontotemporal dementia during both the presymptomatic and symptomatic phases are needed for the development of clinical trials outcomes. We applied an unsupervised machine learning algorithm [the contrastive trajectory inference (cTI)] to multi‐modal MRI from presymptomatic and symptomatic carriers of FTD‐causing mutations to obtain individual scores of disease stage. The cTI based disease scores were correlated with all clinical and neuropsychological tests (measuring behavioral symptoms, attention, memory, language, and executive functions), with the highest contribution coming from mean diffusivity. This study provides a proof of concept that cTI can identify data‐driven disease stages in a heterogeneous sample combining different mutations and disease stages of genetic FTD using only MRI metrics.
1. INTRODUCTION
Frontotemporal dementia (FTD) is a highly heterogeneous disorder with substantial clinical, genetic, and pathological variations. FTD is caused by frontotemporal lobar degeneration (FTLD) and presents clinically with predominantly behavioral changes [behavioral variant FTD (bvFTD); Rascovsky et al., 2011] or language impairment (primary progressive aphasias; Gorno‐Tempini et al., 2011). However, patients with FTLD can also develop symptoms of amyotrophic lateral sclerosis, progressive supranuclear palsy, and corticobasal syndrome. Up to one‐third of cases are caused by an autosomal‐dominant genetic mutation. The three most common mutations are in progranulin (GRN), microtubule‐associated protein tau (MAPT), and chromosome 9 open reading frame 72 (C9orf72), which together account for 10–20% of all FTD cases (Rademakers, Neumann, & Mackenzie, 2012). MAPT mutations are associated with tau pathology, while GRN mutations and C9orf72 expansions are associated with TAR DNA‐binding protein 43 (TDP‐43). The most common clinical presentation in all genetic forms is bvFTD, but all phenotypes can occur (Lashley, Rohrer, Mead, & Revesz, 2015).
The heterogeneity of FTD is a major barrier to the development of treatments. To optimize therapeutic opportunities, we need biomarkers that can accurately track disease progression despite heterogeneity, both in symptomatic FTD and in the long presymptomatic period. There are several disease‐modifying treatments under development for genetic FTD variants (Tsai & Boxer, 2016). The near to full penetrance of FTD‐causing gene mutations means that asymptomatic carriers could eventually be included in clinical trials, however, trials are impeded by the variation in age at onset and clinical presentation observed within gene mutations given that presymptomatic mutation carriers will develop different phenotypes. In the context of a relatively rare disease, phase 3 trials will need to merge presymptomatic carriers with symptomatic subjects into a single study with unified outcome measures. Potential biomarkers such as neuroimaging measures from structural and functional MRI find differing group‐level patterns across clinical (Bisenius, Neumann, & Schroeter, 2016; Lam, Halliday, Irish, Hodges, & Piguet, 2014; Pan et al., 2012; Seeley, Crawford, Zhou, Miller, & Greicius, 2009) and genetic variants, both symptomatically and in presymptomatic gene carriers (Cash et al., 2018; Jiskoot et al., 2019; Meeter, Kaat, Rohrer, & van Swieten, 2017; Panman et al., 2019). However, considerable variability has also been found within genetic groups; and atrophy in no one region captures the disease process in all subjects well (Olney et al., 2020). While neuroimaging remains a key biomarker of FTD, this high variance in biomarkers across FTD variants reduces the utility of these single measures to stage the disease. It is necessary to find unifying ways to stage the disease during both the presymptomatic and symptomatic phases.
Few studies have investigated disease staging of genetic FTD. Group‐level patterns have been found in gray and white matter by regressing against the estimated years to onset (Jiskoot et al., 2018; Rohrer et al., 2015). Data‐driven models of disease staging typically order a select number of biomarkers, assuming a single disease trajectory for all subjects, such as a recent model of GRN mutation carriers (Panman et al., 2021). A study combining disease progression modeling and clustering found data‐driven subtypes that corresponded with genetic FTD mutations and their temporal progression patterns. This study used lobar gray matter volumes only (Young et al., 2018).
The contrastive trajectory inference (cTI) is a recent unsupervised machine learning algorithm for staging and subtyping disease. This model uses multi‐dimensional data to uncover underlying temporal patterns in a diseased population, and subsequently orders and scores individuals along sub‐trajectories of disease progression. When applied to gene expression data from individuals with Alzheimer's and Huntington's diseases, cTI‐identified individual disease scores were significantly associated with clinical and neuropathological disease severity (Iturria‐Medina, Khan, Adewale, & Shirazi, 2020).
In this study, we applied the cTI to multi‐modal neuroimaging features from presymptomatic and symptomatic carriers of FTD‐causing mutations. We focused on neuroimaging given its key role in the diagnosis of FTD in the absence of approved molecular biomarkers. We compared the cTI obtained disease scores to existing measures of disease severity and clinical performance as a proof of concept of cTI scores for staging disease in a heterogeneous dataset of genetic FTD.
2. METHODS
2.1. Dataset
This study used data release 3 from the Genetic FTD Initiative (GENFI; http://www.genfi.org.uk/). GENFI is a large international study gathering longitudinal data on individuals with genetic FTD (C9orf72 expansion, GRN, or MAPT mutations) and their first‐degree relatives, which include an equal proportion of asymptomatic carriers and noncarriers. GENFI aims to develop markers which can identify FTD in its earliest stages as well as track disease progression.
We used multimodal MRI (volumetric T1 and T2, resting‐state functional MRI, and diffusion‐weighted imaging) as well as demographic, clinical, and neuropsychological data from the third data release of GENFI2, comprising 690 participants recruited from 23 sites in Canada and Europe. All participants were genotyped at their local site and underwent a standardized clinical assessment which consisted of a medical history, family history, and physical examination (Rohrer et al., 2015). Symptomatic status was based on this assessment, according to established diagnostic criteria (Gorno‐Tempini et al., 2011; Rascovsky et al., 2011). Mutation carriers were defined a presymptomatic when clinical criteria were not fulfilled.
2.2. Image acquisition and processing
MRI scans were acquired using 3 T scanners, or 1.5 T at sites where 3 T was not available. Protocols were designed to harmonize across scanners and sites as much as possible (Rohrer et al., 2015).
T1: Volumetric T1‐weighted MRI were acquired for 643 subjects. Acquisition parameters (median and ranges) included slice thickness 1.1 mm (1–1.2 mm), repetition time 2,000 ms (6.6–2,400), echo time 2.9 ms (2.2–9 ms), flip angle 8 (8–11), and number of slices 208 (140–208). Images were processed following the steps described in Iturria‐Medina, Carbonell, Sotero, Chouinard‐Decorte, and Evans (2017). In summary, images were segmented into gray matter, white matter, and cerebrospinal fluid probabilistic maps using SPM12. The gray matter maps were normalized to MNI space using DARTEL (Ashburner, 2007) and modulated to preserve the total amount of signal.
T2: Volumetric T2‐weighted MRI were acquired for all available subjects (n = 530). Acquisition parameters (median and ranges) included: repetition time 3,200 ms (2,200–3,200 ms), echo time 401 mm (75–403 mm), slice thickness 1.1 mm (1–1.2 mm), flip angle 120 (90–120), and the number of slices 176 (156–196). All T2 images were normalized to MNI space using the parameters acquired for the T1 image with the closest acquisition date, using SPM12. T1/T2 ratios were calculated by dividing the T2 image from the T1 image with the closest acquisition date.
Resting‐state functional MRI: Resting‐state fMRI data were acquired for all available subjects (n = 619) using an echo‐planar imaging sequence. Acquisition parameters (median and ranges) included: slice thickness 3.5 mm (2.7–3.5 mm), repetition time 2,500 ms (2,200–3,000 ms), echo time 30 ms (30–50 ms), flip angle 80 (80–90), and number of timepoints 200 (140–200). Images were processed following steps outlined in (Iturria‐Medina et al., 2017) using tools from SPM12, FSL, and the REST toolbox. Preprocessing steps included motion correction, slice timing correction, normalization to MNI space using the parameters acquired for the T1 image with the closest acquisition date, and signal filtering to keep only low frequency fluctuations (0.01–0.08 Hz). Maps of fractional amplitude of low frequency fluctuations (fALFF) were calculated, to have a regional indicator of the brain's functional integrity (Zou et al., 2008).
Diffusion‐weighted MRI: Diffusion‐weighted images were acquired for all subjects who had the standard GENFI protocol (n = 483) which consisted of two sequences, with either four or five b0 images (no diffusion sensitization) and 64 diffusion‐weighted images (b = 1,000 s/mm2). The second sequence was used when available. Additional acquisition parameters (median and ranges) included: slice thickness 2.5 mm (2–3 mm), repetition time 7,300 ms (3,742–10,300 ms), and echo time 90 ms (36–100 ms). Images were preprocessed using Mrtrix3 software (Tournier et al., 2019). Preprocessing steps included denoising, Gibbs ringing correction, eddy current distortions correction, and bias field correction. Diffusion tensor measures of fractional anisotropy (FA) and mean diffusivity (MD) were calculated using FSL. Images were normalized to MNI space using the parameters acquired for the T1 image with the closest acquisition date using SPM12. All subsequent analyses of FA and MD refer to gray matter.
2.3. Quality control and data preprocessing
All modalities underwent visual inspection, and images of poor quality were excluded. Imaging data from 637 subjects were used in the subsequent analysis. All imaging data were processed using the NeuroPM‐box (Iturria‐Medina et al., 2021; available at neuropm-lab.com/neuropm-box.html) “organizing input for MCM” tool, consisting of regional gray matter parcellation of each image, outlier detection and correction, and imputation of missing modalities. The NeuroPM‐box is currently designed for the analysis of gray matter. As such, all modalities in this study are measured in the gray matter. Mean gray matter density, fALFF, T1/T2 ratio, and gray matter FA and MD were calculated for 78 cortical and subcortical regions, based on the Desikan–Killiany–Tourville (DKT) atlas (Klein & Tourville, 2012). All baseline data with missing modalities were imputed using the trimmed scores regression with internal principal component analysis algorithm, implemented in the Missing Data Imputation Toolbox for MATLAB, which considers the relationship between all subjects and variables to obtain imputed data by iteratively fitting PCA models to the data (Folch‐Fortuny, Arteaga, & Ferrer, 2016).
2.4. Data harmonization
We used ComBat to harmonize baseline data of each imaging metric by site and scanner type. ComBat, an empirical Bayesian method of harmonizing multi‐site data originally used in genomics (Johnson, Li, & Rabinovic, 2007), has been shown to be robust for multi‐site imaging studies with small numbers of participants per site (Fortin et al., 2017, 2018). The biological variability in genetic variants, disease status (noncarrier, presymptomatic carrier, and symptomatic carrier), and the estimated years to symptom onset (EYO) was preserved, as well as age, sex, and years of education.
2.5. cTI method
The contrastive Trajectory Inference algorithm [cTI; Iturria‐Medina et al. (2020) implemented in the user‐friendly open‐access NeuroPM‐box software (Iturria‐Medina et al., 2021)] is an unsupervised machine learning method to analyze temporal patterns in multi‐dimensional populational datasets. Data can first be adjusted for confounding variables using robust additive linear regression modeling with pair‐wise interactions. The cTI method then consists of unsupervised feature selection (for high dimensional datasets), dimensionality reduction via contrastive principal component analysis, and subject ordering to obtain individual disease scores [described in detail in Iturria‐Medina et al. (2020)].
Contrastive principal component analysis (cPCA; Abid, Zhang, Bagaria, & Zou, 2018) is an unsupervised method of data exploration and visualization which identifies patterns in a target population (i.e., a diseased population) by controlling against patterns in a background population (a control group). By adjusting for patterns identified in the background population, such as aging effects or noise, cPCA has been found to be more sensitive to disease progression, by identifying trends in the population of interest that may be missed using standard methods of dimensionality reduction (i.e., PCA). The model then automatically chooses the contrasted principal component space which best optimizes the enriched trends in the target population. Each subject's position in the contrasted principal component space, therefore, reflects their disease state, with further distance from the background indicating more advanced disease.
Subjects are ordered and assigned an individual “pseudo‐time” score according to their proximity to the background, standardized to be between 0 and 1. Low scores indicate proximity to the background population while high scores indicate proximity to the most advanced disease state. In the context of neurodegeneration, the pseudo‐time score can be interpreted as a personalized index of disease stage (from the continuum of young subjects that are decades away from symptoms up to the more advanced dementia cases).
The cTI also estimates the specific contribution of each feature on the obtained disease scores. Individual weights of each feature reflect how much that feature contributed to the contrasted principal component space from which the subject ordering and disease scores were obtained. A larger weight value, therefore, indicates a greater influence on the cTI‐obtained disease scores.
2.6. cTI analysis
In this analysis, we considered baseline data from five MRI‐derived biomarkers in the gray matter (gray matter density, fALFF, T1/T2 ratio, FA, and MD). The cTI was run using all features due to the relatively small number of included features (5 modalities × 78 brain regions = 390 features). Data were first linearly adjusted by age, sex, and years of education. Parameters of the linear regression were obtained in noncarriers only, to obtain estimates of healthy aging. Parameters were then applied to all subjects. All noncarriers were used as the background population. As opposed to including all gene mutation carriers in the target population, we choose to include symptomatic carriers only. Therefore, the symptomatic subjects only were used in the data exploration and visualization via cPCA, in contrast to the noncarriers, and the corresponding transformations of the data to the disease‐associated space (contrastive principal component space) were then applied to all subjects. We used symptomatic subjects as the target population due to their more advanced disease state which should allow for better determination of the disease‐associated patterns by the cTI (as only subtle changes are expected in the presymptomatic participants), and due to the much larger number of presymptomatic carriers compared to symptomatic (many of whom are young and likely far from symptom onset) which would likely bias the model towards early presymptomatic cases, increasing the difficulty of finding underlying disease‐associated trends. The cTI was run using the combination of all five‐imaging metrics, as well as each metric individually.
2.7. Post‐hoc statistical analysis
We compared the cTI obtained disease scores to the EYO, clinical assessment, and neuropsychological test scores using Pearson's correlation. Tests included the Mini‐Mental State Examination (MMSE) for cognition, the Cambridge Behavioural Inventory Revised version (CBI‐R) for behavioral symptoms, and a neuropsychological battery measuring cognition, attention, memory, language, and executive function (Digit Span forward and backward from the Wechsler Memory Scale‐Revised, a Digit Symbol Task, Parts A and B of the Trail Making Test, the short version of the Boston Naming Test, Category Fluency (animals), Letter Fluency and the Wechsler Abbreviated Scale of Intelligence Block Design task). Z scores were calculated for all neuropsychological tests based on language‐specific norms (Rohrer et al., 2015). Differences in disease status were tested using one‐way ANOVAs. Post hoc pairwise differences between groups were analyzed using Tukey's test. All analyses were conducted using MATLAB (version 2019b) and R (version 4.0.3).
2.8. Sensitivity analysis
To assess the impact of missing data and the subsequent imputation of this missing data on the analyses, the cTI was run, with all five modalities in combination, using only those individuals with all imaging modalities at their baseline visit (n = 282) and the above analyses repeated in this subgroup.
3. RESULTS
We analyzed cross‐sectional data from 637 participants who had at least one useable T1 scan, including 269 presymptomatic carriers, 115 symptomatic carriers, and 253 noncarriers (see Table 1 for demographic characteristics). Of the presymptomatic carriers, 92 had a C9orf72 expansion, 129 had a GRN mutation, and 48 had a MAPT mutation. Of the symptomatic subjects, 56 had a C9orf72 expansion, 40 had a GRN mutation, and 19 had a MAPT mutation. Eighty had a diagnosis of bvFTD, 20 had a primary progressive aphasia (15 non‐fluent variant, 1 semantic variant, 4 non‐specified), 4 had amyotrophic lateral sclerosis (ALS), 5 had FTD‐ALS, 2 had corticobasal syndrome, 1 had progressive supranuclear palsy, and 3 had non‐specified dementia.
TABLE 1.
Demographics of included subjects
| Presymptomatic | Symptomatic | Noncarriers | |
|---|---|---|---|
| N | 269 | 115 | 253 |
| Mutation a | |||
| C9orf72 | 92 (34.2) | 56 (48.7) | 87 (34.4) |
| GRN | 129 (48.0) | 40 (34.8) | 126 (49.8) |
| MAPT | 48 (17.8) | 19 (16.5) | 40 (15.8) |
| Age (years) b | 44.9 ± 11.9 (20.1–75.5) | 63.0 ± 8.6 (32.9–78.7) | 46.8 ± 13.7 (18.6–85.7) |
| Sex (female) c | 170 (63.2) | 50 (43.5) | 142 (56.1) |
| Education (years) b | 14.3 ± 3.3 | 11.9 ± 4.1 | 14.0 ± 3.5 |
| CBI‐R b | 5.1 ± 9.1 | 61.2 ± 32.0 | 3.9 ± 6.3 |
| MMSE b | 29.3 ± 1.2 | 22.5 ± 6.3 | 29.4 ± 1.1 |
| EYO b | −13.8 ± 11.5 | 3.4 ± 6.8 | NA |
Note: Diagnoses in symptomatic subjects: 79 bvFTD (41 C9orf72, 20 GRN, and 19 MAPT), 5 FTD‐ALS (all C9orf72), 4 ALS (C9orf72), 15 nonfluent variant PPA (2 C9orf72, 13 GRN), 1 semantic variant PPA (C9orf72), 2 corticobasal syndrome (GRN), 4 dementia—not otherwise specified (GRN), and 1 progressive supranuclear palsy (C9orf72). Data are n (%) or mean ± standard deviation (range).
Abbreviations: ALS, amyotrophic lateral sclerosis; bvFTD, behavioral variant frontotemporal dementia; CBI‐R, Cambridge Behavioural Inventory Revised version; EYO, estimated years to symptom onset; MMSE, Mini‐Mental State Examination; PPA, primary progressive aphasia.
Genetic mutation status in noncarriers refers to the mutation carried in family members.
p < .001 (one‐way ANOVA), significant differences between symptomatic and presymptomatic, as well as noncarriers (p < .001, Tukey tests).
p < .001 (chi‐square), the difference in distribution across groups.
3.1. cTI‐identified disease scores
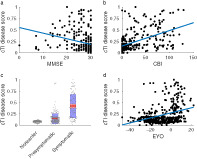
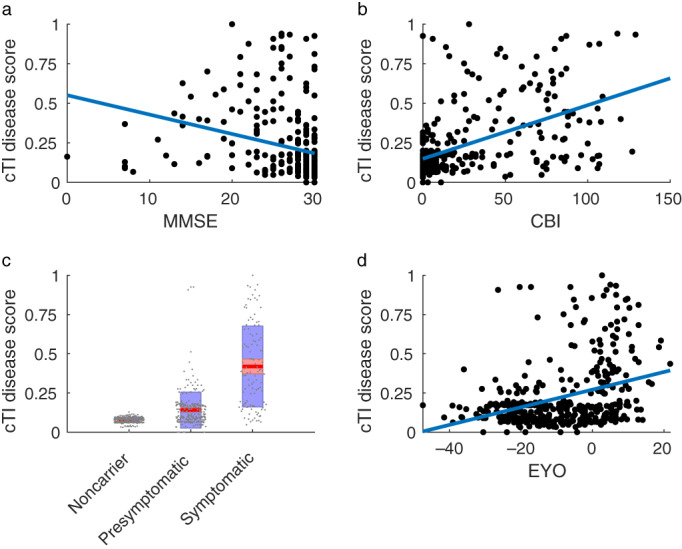
The cTI identified disease scores, obtained using all imaging metrics in combination, were significantly correlated with MMSE (r = −.273, p < .001, Figure 1a), CBI‐R (r = .516, p < .001, Figure 1b), and each neuropsychological test (all |r| .276–.468, p < .001, Figure 2) for all gene mutation carriers. A higher disease score was associated with greater impairment on all tests and clinical scales. Correlations were not significant in presymptomatic carriers only (p > .05, Table 2), while in the symptomatic group, only the MMSE was significantly correlated with disease scores (p < .05, Table 2). Correlations between cTI scores in the full group (including noncarriers) were similar to those in the gene mutation carriers (all p < .001, Table 2).
FIGURE 1.
Association between cTI identified disease scores and (a) MMSE, (b) CBI‐R, (c) Disease status, and (d) EYO. In c, points are laid over a 1.96 SEM (95% confidence interval) in red and at 1 SD in blue. CBI, Cambridge Behavioural Inventory; EYO, estimated years to symptom onset; MMSE, Mini‐Mental State Examination
FIGURE 2.
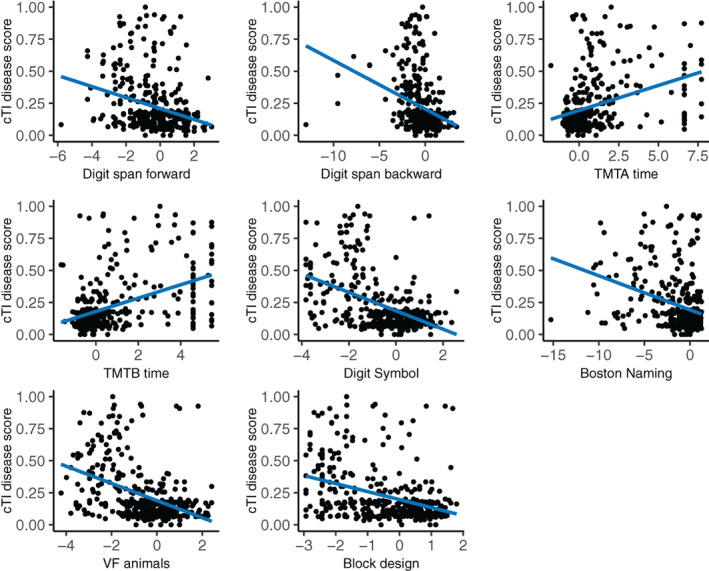
Association between cTI identified disease scores and neuropsychological tests. TMTA, Trail Making Test Part A; TMTB, Trail Making Test Part B; VF, verbal fluency
TABLE 2.
Correlation (r) between cTI disease scores (all modalities) and each clinical/neuropsychological test for all gene carriers, presymptomatic carriers only, symptomatic carriers only, and the full group (including noncarriers)
| Carriers | Presymptomatic | Symptomatic | All | |
|---|---|---|---|---|
| MMSE | −0.273 | −0.014 | 0.237 | −0.337 |
| CBI‐R | 0.516 | 0.017 | 0.109 | 0.573 |
| DS F score | −0.276 | 0.008 | 0.087 | −0.269 |
| DS B score | −0.292 | −0.017 | 0.091 | −0.295 |
| TMTA time | 0.357 | 0.019 | −0.072 | 0.392 |
| TMTB time | 0.466 | 0.061 | 0.015 | 0.490 |
| Digit symbol | −0.468 | 0.025 | −0.026 | −0.461 |
| Boston naming | −0.334 | 0.015 | 0.132 | −0.385 |
| VF animals | −0.436 | 0.043 | 0.057 | −0.424 |
| VF F | −0.406 | −0.007 | −0.062 | −0.387 |
| VF A | −0.386 | −0.064 | 0.023 | −0.374 |
| VF S | −0.398 | −0.037 | −0.021 | −0.389 |
| Block design | −0.370 | 0.090 | 0.069 | −0.371 |
| EYO | 0.343 | −0.089 | 0.026 | 0.298 |
Abbreviations: CBI‐R, Cambridge Behavioural Inventory Revised version; DS B, Digit Span backward; DS F, Digit Span forward; EYO, estimated years to symptom onset; MMSE, Mini‐Mental State Examination; TMTA, Trail Making Test Part A; TMTB, Trail Making Test Part B; VF, verbal fluency.
Significant differences in disease scores were found for disease status (F = 270.9, p < .001), with symptomatic subjects having higher disease scores than both asymptomatic carriers and noncarriers and asymptomatic carriers having higher disease scores than noncarriers (p < .001, Figure 1c). Differences were not driven by a single genetic group. Disease scores were also significantly correlated with the EYO for all gene mutation carriers, with a higher disease score associated with a shorter expected time to symptom onset (r = .334, p < .001, Figure 1d). See Table 2 for all correlations. Figure 3 shows the association between disease scores and age, by disease status.
FIGURE 3.
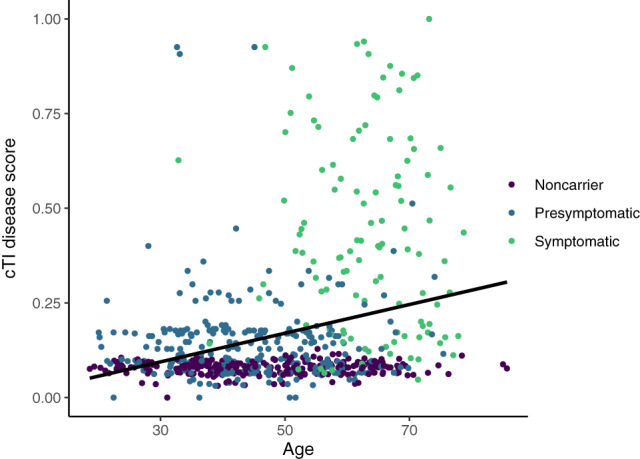
Association between cTI identified disease scores and age, by disease status
3.2. Feature contributions
We summed the feature weights across modalities and regions to determine the total contribution of each modality (Figure 4) and the total contribution of each brain region (Figure 5) to the obtained disease scores. DTI metrics provide the highest contribution (MD followed by FA), while fALFF provides the lowest. Gray matter density and T1/T2 ratio had similar contributions. Total regional contributions indicate the highest values for frontal, temporal, and subcortical regions.
FIGURE 4.
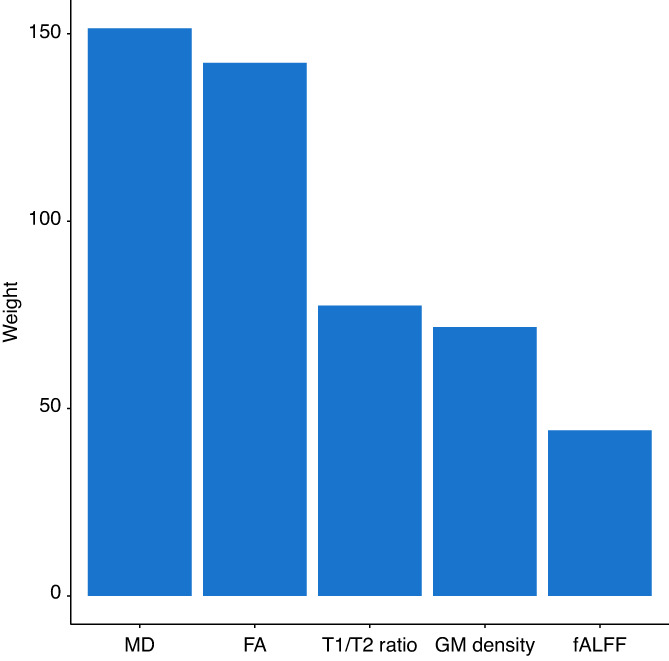
Total contribution of each modality to the cTI identified disease scores. FA, fractional anisotropy; fALFF, fractional amplitude of low frequency fluctuations; GM, gray matter; MD, mean diffusivity
FIGURE 5.
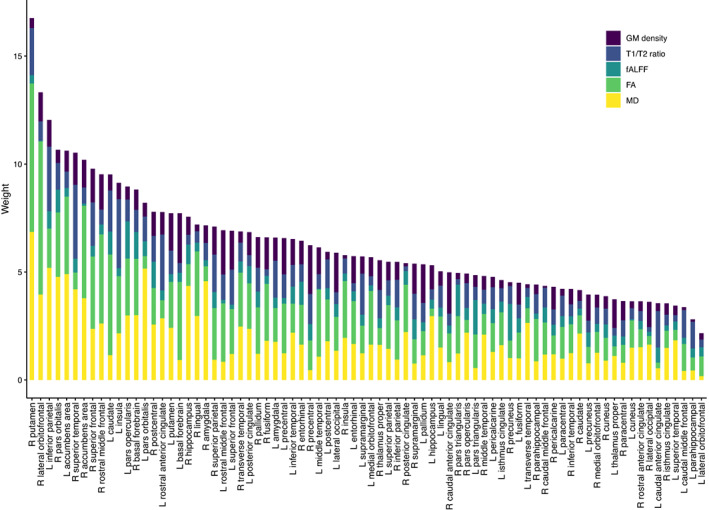
Total contribution of each brain region to the cTI identified disease scores. FA, fractional anisotropy; fALFF, fractional amplitude of low frequency fluctuations; GM, gray matter; L, left; MD, mean diffusivity; R, right
3.3. Individual modalities
When obtained using each imaging metric individually, the cTI identified disease scores in all gene mutation carriers were significantly correlated with MMSE (Table 3; gray matter density: r = −.368, fALFF: r = −.355, p < .001), CBI‐R (Table 3; gray matter density: r = .391, fALFF: r = .377, T1/T2 ratio: r = .373, p < .001), and all neuropsychological tests for all modalities (Table 3; gray matter density: |r| = .281–.447, fALFF: |r| = .277–.442, p < .001), with a higher disease score being associated with greater impairment on all tests. Significant differences in disease scores were found for disease status, with symptomatic subjects having higher disease scores than both asymptomatic carriers and noncarriers (p < .001). Differences between asymptomatic carriers and noncarriers were not significant (fALFF, p = .15; FA, p = .1; T1/T2 ratio, p = .07; MD, p = .06; gray matter density, p = .97). A significant correlation was found with the EYO for all modalities (Table 3; |r| = .192–.349, p < .005) except MD (r = .090, p = .0792), with a higher disease score associated with a shorter time to symptom onset among gene carriers.
TABLE 3.
Correlation (r) between cTI disease scores for each modality and each clinical/neuropsychological test (in all gene carriers)
| GM density | T1/T2 ratio | fALFF | FA | MD | |
|---|---|---|---|---|---|
| MMSE | −0.368 | −0.188 | −0.355 | −0.093 | −0.24 |
| CBI‐R | 0.391 | 0.373 | 0.377 | 0.28 | 0.261 |
| DS F score | −0.306 | −0.237 | −0.277 | −0.107 | −0.258 |
| DS B score | −0.281 | −0.258 | −0.289 | −0.177 | −0.243 |
| TMTA time | 0.358 | 0.160 | 0.376 | 0.210 | 0.238 |
| TMTB time | 0.447 | 0.275 | 0.442 | 0.225 | 0.265 |
| Digit symbol | −0.442 | −0.261 | −0.372 | −0.264 | −0.237 |
| Boston naming | −0.415 | −0.244 | −0.362 | −0.247 | −0.216 |
| VF animals | −0.433 | −0.296 | −0.355 | −0.210 | −0.239 |
| VF F | −0.358 | −0.285 | −0.374 | −0.248 | −0.266 |
| VF A | −0.336 | −0.269 | −0.322 | −0.229 | −0.258 |
| VF S | −0.357 | −0.236 | −0.318 | −0.220 | −0.269 |
| Block design | −0.360 | −0.217 | −0.350 | −0.211 | −0.233 |
| EYO | 0.353 | 0.225 | 0.286 | 0.205 | 0.107 |
Abbreviations: CBI‐R, Cambridge Behavioural Inventory Revised version; DS B, Digit Span backward; DS F, Digit Span forward; EYO, estimated years to symptom onset; MMSE, Mini‐Mental State Examination; TMTA, Trail Making Test Part A; TMTB, Trail Making Test Part B; VF, verbal fluency.
3.4. Sensitivity analysis
Overall results of the analysis in the subset of subjects with full baseline imaging are similar to those in the full dataset; cTI disease scores were significantly correlated with all clinical and neuropsychological tests, and with the EYO (Figures S1 and S2). All correlations were equal to or stronger than in the full analysis. Significant differences in disease scores were found for disease status (F = 318.6, p < .001; Figure S1c). Symptomatic subjects had higher disease scores than both asymptomatic carriers and noncarriers (p < .001), but differences between asymptomatic carriers and noncarriers were not significant (p = .15). The feature contribution analysis indicated a higher contribution of gray matter density (Figure S3). The ordering of regional contributions were also somewhat altered (Figure S4), but the highest values were again found for frontal, temporal, and subcortical regions.
4. DISCUSSION
In this study, we show that the cTI, a data‐driven staging model, can identify the cross‐sectional progression of disease in a heterogeneous sample of genetic FTD using only neuroimaging metrics without clinical information. As a proof of validity, significant correlations were found between the data‐driven cTI identified disease scores and the estimated years to symptom onset and to all the tested measures of clinical performance. In addition, higher mean cTI scores were found in presymptomatic carriers compared to noncarriers, suggesting that the staging system may be able to detect subtle pre‐dementia changes in mutation carriers. Gray matter DTI measures, particularly MD, provided the largest contribution to the model. Disease scores derived from individual metrics were also significantly correlated with clinical performance. Differences in disease scores between presymptomatic carriers and noncarriers did not reach statistical significance in individual metrics, suggesting a combination of metrics may be important to differentiate presymptomatic carriers from asymptomatic subjects.
This study is a proof of concept that it is possible to generate a data‐driven unified staging system across genetic and phenotypical variations that correlate strongly with the most relevant clinical and cognitive measures in FTD. Previous application of the cTI model has shown strong associations between the model‐derived disease scores and clinical and neuropathological disease severity in both Alzheimer's and Huntington's diseases, as well as a cohort encompassing the spectrum of both diseases (Iturria‐Medina et al., 2020). Our results corroborate the use of cTI‐derived disease scores as a marker of neurodegenerative diseases, showing that the individual scores reflect a combination of subtle clinical differences in the presymptomatic stage and disease severity in symptomatic patients. We further show that the model can accurately identify disease stages in a heterogeneous population including the wide variety of clinical presentations and genetic mutations found in genetic FTD, factoring the presymptomatic and symptomatic spectrum. This association is found despite a large number of subjects in the early presymptomatic stage (i.e., more than 30–40 years prior to probable symptom onset). The association was largely driven by differences between presymptomatic and symptomatic stages, as correlations in the individual subgroups were mostly not significant; this is likely due to the fact that most presymptomatic subjects will have normal to very mild impairment on these tests, while symptomatic subjects are impaired. It also may reflect the inability of the clinical and cognitive scales to reflect specific aspects of each individual's subtle clinical decline.
The cTI has previously been applied to gene expression data. Here we show the utility of this model derived using neuroimaging features. The feature contributions analysis indicates that DTI metrics, in particular MD, are the biggest contributors to the model. These measures have rarely been studied in gray matter, although increases in MD have been reported in symptomatic FTD (Whitwell et al., 2010). This finding may warrant further investigation of gray matter microstructural changes. Of note, both DTI metrics indicate strong contributions to the model from similar brain regions. While FA and MD measure different processes, it is likely that multiple inter‐related microstructural changes are occurring in the same brain regions.
Our results indicate moderate association between disease scores derived individually from gray matter atrophy, fALFF and T1/T2 ratio, and clinical performance. Gray matter atrophy is the most frequently studied imaging biomarker in FTD, and atrophy has been consistently reported across phenotypes and genetics, symptomatically and presymptomatically (Cash et al., 2018; Rohrer et al., 2015; Staffaroni et al., 2020). T1/T2 ratio and fALFF have been much less frequently studied. Alterations in functional connectivity have been reported in both presymptomatic and symptomatic FTD (Dopper et al., 2014; Lee et al., 2017; Premi et al., 2016). T1/T2 ratio, as a marker of intracortical myelin, has not been investigated in FTD to our knowledge; results here indicate a change in myelin content along with FTD progression. We obtained the highest correlations with clinical measures when using a combination of all modalities, and all modalities providing some level of contribution to the model, indicating an added benefit of combining information from multiple modalities which provide complementary information. Our results suggest that the combination of metrics may be particularly important to differentiate presymptomatic carriers from controls. The regional contributions analysis indicated that along with frontal and temporal regions, subcortical involvement was an important contributor to the model, while the left inferior parietal region also showed a high contribution. Subcortical involvement has also been reported in genetic FTD, while parietal involvement has been reported most commonly in GRN mutations (Rohrer et al., 2015).
The sensitivity analysis suggests that the observed associations between disease scores and the estimated years to symptom onset and to all the tested measures of clinical performance are fairly robust, while the differences between presymptomatic carriers and controls, the contribution of GM density to the disease scores are more sensitive to missing data. These findings should therefore be validated in a larger dataset with more complete data.
The development of data‐driven biologically based staging would be useful for clinical trials. This study provides initial evidence supporting the potential usefulness of this type of modeling as a unified measure to track disease progression and monitor treatment effectiveness in a highly heterogeneous population. A main advantage of the cTI is that it is an unsupervised data‐driven model, determined by cross‐sectional data, which does not rely on a priori phenotypical information. The clinical variables are not used to train a predictive model, removing concerns of circularity or overfitting. Furthermore, the cTI can incorporate various features from high dimensional data, and data‐driven feature selection, eliminating the necessity of choosing select biomarkers or brain regions, seen in existing data‐driven models (Panman et al., 2021; Young et al., 2018). It therefore provides unbiased biomarkers based solely on biological metrics. Further work is needed to evaluate the usefulness of this type of measure clinically and as a validated outcome for clinical trials.
A limitation of this study is the modalities used. All neuroimaging features used here are in the gray matter; including DWI metrics from white matter in future models may provide increased benefit to the model, as white matter microstructure changes may be an early feature of FTD (Feis et al., 2018; Jiskoot et al., 2018). Future models would likely also benefit from non‐imaging neurodegeneration biomarkers like neurofilament light chain, which has good potential as a prognostic biomarker in clinical FTD (Benussi et al., 2020; Rohrer et al., 2016) and presymptomatic mutation carriers (Meeter et al., 2016; van der Ende et al., 2019). Our model suggests that while single biomarkers may perform reasonably well on their own and have high clinical feasibility, the inclusion of other advanced imaging metrics may increase precision, particularly in presymptomatic subjects, and therefore could be valuable in a clinical trial setting. Ultimately, a select number of biomarkers providing distinct information to the model, such as a combination of imaging and non‐imaging metrics, may provide the best staging system. Future work could also analyze each genetic group separately, as larger datasets become available. Finally, we used EYO as a measure of disease severity, which has been shown to be imprecise as a predictor of actual onset (Moore et al., 2020). However, EYO remains the only predictive estimate of time to symptom onset other than age.
In summary, this study provides promising evidence for the development of unifying staging of heterogeneous neurodegenerative disorders using data‐driven, unsupervised methods. Neuroimaging features show promise as potential biomarkers of disease progression but would most likely benefit from being combined with complementary clinical and biological information for optimal staging. While further validation work is required, biologically based staging systems are a promising tool to monitor monitoring disease progression and treatment outcomes in future clinical trials of genetic FTD.
CONFLICT OF INTEREST
The authors declare no conflicts of interest.
Supporting information
FIGURE S1 Association between cTI identified disease scores and (a) MMSE, (b) CBI‐R, (c) disease status, and (d) EYO in a subset of subjects with all imaging modalities at baseline (n = 282). In c, points are laid over a 1.96 SEM (95% confidence interval) in red and at 1 SD in blue. CBI, Cambridge Behavioural Inventory; EYO, estimated years to symptom onset; MMSE, Mini‐Mental State Examination
FIGURE S2 Association between cTI identified disease scores and neuropsychological tests in a subset of subjects with all imaging modalities at baseline (n = 282). TMTA, Trail Making Test Part A; TMTB, Trail Making Test Part B; VF, verbal fluency
FIGURE S3 Total contribution of each modality to the cTI identified disease scores in a subset of subjects with all imaging modalities at baseline (n = 282). FA, fractional anisotropy; fALFF, fractional amplitude of low frequency fluctuations; GM, gray matter; MD, mean diffusivity
FIGURE S4 Total contribution of each brain region to the cTI identified disease scores in a subset of subjects with all imaging modalities at baseline (n = 282). FA, fractional anisotropy; fALFF, fractional amplitude of low frequency fluctuations; GM, gray matter; L, left; MD, mean diffusivity; R, right.
ACKNOWLEDGMENTS
Jillian McCarthy and Simon Ducharme receive funding from the Fonds de Recherche du Québec – Santé. Brain scan acquisition at the McConnell Brain Imaging Centre was supported by the Brain Canada Foundation with support from Health Canada and the Canada Foundation for Innovation (CFI Project 34874).
List of other GENFI consortium members: Sónia Afonso, Instituto Ciencias Nucleares Aplicadas a Saude, Universidade de Coimbra, Coimbra, Portugal. Maria Rosario Almeida, Centre of Neurosciences and Cell Biology, Universidade de Coimbra, Coimbra, Portugal. Sarah Anderl‐Straub, Department of Neurology, Ulm University, Ulm, Germany. Christin Andersson, Department of Clinical Neuroscience, Karolinska Institutet, Stockholm, Sweden. Anna Antonell, Alzheimer's Disease and Other Cognitive Disorders Unit, Neurology Department, Hospital Clinic, Institut d'Investigacions Biomèdiques, Barcelona, Spain. Silvana Archetti, Biotechnology Laboratory, Department of Diagnostics, ASST Brescia Hospital, Brescia, Italy. Andrea Arighi, Fondazione IRCSS Ca’ Granda, Ospedale Maggiore Policlinico, Neurodegenerative Diseases Unit, Milan, Italy. Mircea Balasa, Alzheimer's disease and other cognitive disorders unit, Neurology Department, Hospital Clinic, Institut d'Investigacions Biomèdiques, Barcelona, Spain. Myriam Barandiaran, Neuroscience Area, Biodonostia Health Research Institute, Paseo Dr Begiristain sn, CP 20014, San Sebastian, Gipuzkoa, Spain. Nuria Bargalló, Radiology Department, Image Diagnosis Center, Hospital Clínic and Magnetic Resonance Image core facility, IDIBAPS, Barcelona, Spain. Robart Bartha, Department of Medical Biophysics, Robarts Research Institute, University of Western Ontario, London, Ontario, Canada. Benjamin Bender, Department of Diagnostic and Interventional Neuroradiology, University of Tuebingen, Tuebingen, Germany. Alberto Benussi, Centre for Neurodegenerative Disorders, Department of Clinical and Experimental Sciences, University of Brescia, Italy. Luisa Benussi, Istituto di Ricovero e Cura a Carattere Scientifico Istituto Centro San Giovanni di Dio Fatebenefratelli, Brescia, Italy. Valentina Bessi, Department of Neuroscience, Psychology, Drug Research, and Child Health, University of Florence, Florence, Italy. Giuliano Binetti, Istituto di Ricovero e Cura a Carattere Scientifico Istituto Centro San Giovanni di Dio Fatebenefratelli, Brescia, Italy. Sandra Black, LC Campbell Cognitive Neurology Research Unit, Sunnybrook Research Institute, Toronto, Canada. Martina Bocchetta, Dementia Research Centre, Department of Neurodegenerative Disease, UCL Institute of Neurology, Queen Square London, UK. Sergi Borrego‐Ecija, Alzheimer's Disease and Other Cognitive Disorders Unit, Neurology Department, Hospital Clinic, Institut d'Investigacions Biomèdiques, Barcelona, Spain. Jose Bras, Dementia Research Institute, Department of Neurodegenerative Disease, UCL Institute of Neurology, Queen Square, London, UK. Rose Bruffaerts, Laboratory for Cognitive Neurology, Department of Neurosciences, KU Leuven, Leuven, Belgium. Marta Cañada, CITA Alzheimer, San Sebastian, Gipuzkoa, Spain. Valentina Cantoni, Centre for Neurodegenerative Disorders, Neurology Unit, Department of Clinical and Experimental Sciences, University of Brescia, Brescia, Italy. Paola Caroppo, Fondazione Istituto di Ricovero e Cura a Carattere Scientifico Istituto Neurologico Carlo Besta, Milan, Italy. David Cash, Dementia Research Centre, Department of Neurodegenerative Disease, UCL Institute of Neurology, Queen Square, London, UK. Miguel Castelo‐Branco, Neurology Department, Centro Hospitalar e Universitário de Coimbra, Instituto de Ciências Nucleares Aplicadas à Saúde (ICNAS), Coimbra, Portugal. Rhian Convery, Dementia Research Centre, Department of Neurodegenerative Disease, UCL Institute of Neurology, Queen Square, London, UK. Thomas Cope, Department of Clinical Neuroscience, University of Cambridge, Cambridge, UK. Maura Cosseddu, Neurology, ASST Brescia Hospital, Brescia, Italy. María de Arriba, Neuroscience Area, Biodonostia Health Research Institute, Paseo Dr Begiristain sn, CP 20014, San Sebastian, Gipuzkoa, Spain. Giuseppe Di Fede, Fondazione Istituto di Ricovero e Cura a Carattere Scientifico Istituto Neurologico Carlo Besta, Milan, Italy. Zigor Díaz, CITA Alzheimer, San Sebastian, Spain. Alina Díez, Neuroscience Area, Biodonostia Health Research Insitute, San Sebastian, Gipuzkoa, Spain. Diana Duro, Faculty of Medicine, Universidade de Coimbra, Coimbra, Portugal. Chiara Fenoglio, University of Milan, Centro Dino Ferrari, Milan, Italy. Camilla Ferrari, Department of Neuroscience, Psychology, Drug Research, and Child Health, University of Florence, Florence, Italy. Carlos Ferreira, Instituto Ciências Nucleares Aplicadas à Saúde, Universidade de Coimbra, Coimbra, Portugal. Catarina B. Ferreira, Faculty of Medicine, University of Lisbon, Lisbon, Portugal. Toby Flanagan, Faculty of Biology, Medicine, and Health, Division of Neuroscience and Experimental Psychology, University of Manchester, Manchester, UK. Nick Fox, Dementia Research Centre, Department of Neurodegenerative Disease, UCL Institute of Neurology, Queen Square, London, UK. Morris Freedman, Division of Neurology, Baycrest Centre for Geriatric Care, University of Toronto, Toronto, Canada. Giorgio Fumagalli, Fondazione IRCSS Ca’ Granda, Ospedale Maggiore Policlinico, Neurodegenerative Diseases Unit, Milan, Italy; Department of Neuroscience, Psychology, Drug Research, and Child Health, University of Florence, Florence, Italy. Alazne Gabilondo, Neuroscience Area, Biodonostia Health Research Institute, Paseo Dr Begiristain sn, CP 20014, San Sebastian, Gipuzkoa, Spain. Roberto Gasparotti, Neuroradiology Unit, University of Brescia, Brescia, Italy. Serge Gauthier, Department of Neurology and Neurosurgery, McGill University, Montreal, Québec, Canada. Stefano Gazzina, Neurology, ASST Brescia Hospital, Brescia, Italy. Giorgio Giaccone, Fondazione Istituto di Ricovero e Cura a Carattere Scientifico Istituto Neurologico Carlo Besta, Milan, Italy. Ana Gorostidi, Neuroscience Area, Biodonostia Health Research Institute, Paseo Dr Begiristain sn, CP 20014, San Sebastian, Gipuzkoa, Spain. Caroline Greaves, Dementia Research Centre, Department of Neurodegenerative Disease, UCL Institute of Neurology, Queen Square London, UK. Rita Guerreiro, Dementia Research Institute, Department of Neurodegenerative Disease, UCL Institute of Neurology, London, UK. Carolin Heller, Dementia Research Centre, Department of Neurodegenerative Disease, UCL Institute of Neurology, Queen Square, London, UK. Tobias Hoegen, Department of Neurology, Ludwig‐Maximilians‐University of Munich, Munich, Germany. Begoña Indakoetxea, Cognitive Disorders Unit, Department of Neurology, Donostia University Hospital, Paseo Dr Begiristain sn, CP 20014, San Sebastian, Gipuzkoa, Spain. Vesna Jelic, Division of Clinical Geriatrics, Karolinska Institutet, Stockholm, Sweden. Hans‐Otto Karnath, Section of Neuropsychology, Department of Cognitive Neurology, Center for Neurology & Hertie‐Institute for Clinical Brain Research, Tübingen, Germany. Ron Keren, University Health Network Memory Clinic, Toronto Western Hospital, Toronto, Canada. Tobias Langheinrich, Division of Neuroscience and Experimental Psychology, Wolfson Molecular Imaging Centre, University of Manchester, Manchester, UK; Manchester Centre for Clinical Neurosciences, Department of Neurology, Salford Royal NHS Foundation Trust, Manchester, UK. Maria João Leitão, Centre of Neurosciences and Cell Biology, Universidade de Coimbra, Coimbra, Portugal. Albert Lladó, Alzheimer's Disease and Other Cognitive Disorders Unit, Neurology Department, Hospital Clinic, Institut d'Investigacions Biomèdiques, Barcelona, Spain. Gemma Lombardi, Department of Neuroscience, Psychology, Drug Research and Child Health, University of Florence, Florence, Italy. Sandra Loosli, Department of Neurology, Ludwig‐Maximilians‐University of Munich, Munich, Germany. Carolina Maruta, Lisbon Faculty of Medicine, Language Research Laboratory, Lisbon, Portugal. Simon Mead, MRC Prion Unit, Department of Neurodegenerative Disease, UCL Institute of Neurology, Queen Square, London, UK. Lieke Meeter, Department of Neurology, Erasmus Medical Center, Rotterdam, Netherlands. Gabriel Miltenberger, Faculty of Medicine, University of Lisbon, Lisbon, Portugal. Rick van Minkelen, Department of Clinical Genetics, Erasmus Medical Center, Rotterdam, The Netherlands. Sara Mitchell, LC Campbell Cognitive Neurology Research Unit, Sunnybrook Research Institute, Toronto, Canada. Katrina M Moore, Dementia Research Centre, Department of Neurodegenerative Disease, UCL Institute of Neurology, Queen Square, London, UK. Benedetta Nacmias, Department of Neuroscience, Psychology, Drug Research and Child Health, University of Florence, Florence, Italy. Mollie Neason, Dementia Research Centre, Department of Neurodegenerative Disease, UCL Institute of Neurology, Queen Square, London, UK. Jennifer Nicholas, Department of Medical Statistics, London School of Hygiene and Tropical Medicine, London, UK. Linn Öijerstedt, Department of Geriatric Medicine, Karolinska Institutet, Stockholm, Sweden. Jaume Olives, Alzheimer's disease and other cognitive disorders unit, Neurology Department, Hospital Clinic, Institut d'Investigacions Biomèdiques, Barcelona, Spain. Sebastien Ourselin, School of Biomedical Engineering & Imaging Sciences, King's College London, London, UK. Alessandro Padovani, Centre for Neurodegenerative Disorders, Department of Clinical and Experimental Sciences, University of Brescia, Italy. Jessica Panman, Department of Neurology, Erasmus Medical Center, Rotterdam, The Netherlands. Janne Papma, Department of Neurology, Erasmus Medical Center, Rotterdam, The Netherlands. Georgia Peakman, Department of Neurodegenerative Disease, Dementia Research Centre, UCL Institute of Neurology, Queen Square, London, UK. Irene Piaceri, Department of Neuroscience, Psychology, Drug Research and Child Health, University of Florence, Florence. Michela Pievani, Istituto di Ricovero e Cura a Carattere Scientifico Istituto Centro San Giovanni di Dio Fatebenefratelli, Brescia, Italy. Yolande Pijnenburg, VUMC, Amsterdam, The Netherlands. Cristina Polito, Department of Biomedical, Experimental and Clinical Sciences “Mario Serio”, Nuclear Medicine Unit, University of Florence, Florence, Italy. Enrico Premi, Stroke Unit, ASST Brescia Hospital, Brescia, Italy. Sara Prioni, Fondazione Istituto di Ricovero e Cura a Carattere Scientifico Istituto Neurologico Carlo Besta, Milan, Italy. Catharina Prix, Department of Neurology, Ludwig‐Maximilians‐University Munich, Germany. Rosa Rademakers, Department of Neurosciences, Mayo Clinic, Jacksonville, Florida, USA. Veronica Redaelli, Fondazione Istituto di Ricovero e Cura a Carattere Scientifico Istituto Neurologico Carlo Besta, Milan, Italy. Tim Rittman, Department of Clinical Neurosciences, University of Cambridge, Cambridge, UK. Ekaterina Rogaeva, Tanz Centre for Research in Neurodegenerative Diseases, University of Toronto, Toronto, Canada. Pedro Rosa‐Neto, Translational Neuroimaging Laboratory, McGill University Montreal, Québec, Canada. Giacomina Rossi, Fondazione Istituto di Ricovero e Cura a Carattere Scientifico Istituto Neurologico Carlo Besta, Milan, Italy. Martin Rossor, Dementia Research Centre, Department of Neurodegenerative Disease, UCL Institute of Neurology, Queen Square, London, UK. Beatriz Santiago, Neurology Department, Centro Hospitalar e Universitário de Coimbra, Coimbra, Portugal. Elio Scarpini, University of Milan, Centro Dino Ferrari, Milan, Italy; Fondazione IRCSS Ca’ Granda, Ospedale Maggiore Policlinico, Neurodegenerative Diseases Unit, Milan, Italy. Sonja Schönecker, Neurologische Klinik, Ludwig‐Maximilians‐Universität München, Munich, Germany. Elisa Semler, Department of Neurology, Ulm University, Ulm, Germany. Rachelle Shafei, Dementia Research Centre, Department of Neurodegenerative Disease, UCL Institute of Neurology, Queen Square, London, UK. Christen Shoesmith, Department of Clinical Neurological Sciences, University of Western Ontario, London, Ontario, Canada. Miguel Tábuas‐Pereira, Centre of Neurosciences and Cell Biology, Universidade de Coimbra, Coimbra, Portugal. Mikel Tainta, Neuroscience Area, Biodonostia Health Research Institute, Paseo Dr Begiristain sn, CP 20014, San Sebastian, Gipuzkoa, Spain. Ricardo Taipa, Neuropathology Unit and Department of Neurology, Centro Hospitalar do Porto, Hospital de Santo António, Oporto, Portugal. David Tang‐Wai, University Health Network Memory Clinic, Toronto Western Hospital, Toronto, Canada. David L Thomas, Neuroradiological Academic Unit, UCL Institute of Neurology, London, UK. Paul Thompson, Division of Neuroscience and Experimental Psychology, Wolfson Molecular Imaging Centre, University of Manchester, Manchester, UK. Hakan Thonberg, Center for Alzheimer Research, Division of Neurogeriatrics, Karolinska Institutet, Stockholm, Sweden. Carolyn Timberlake, Department of Clinical Neurosciences, University of Cambridge, Cambridge, UK. Pietro Tiraboschi, Fondazione Istituto di Ricovero e Cura a Carattere Scientifico Istituto Neurologico Carlo Besta, Milano, Italy. Emily Todd, Department of Neurodegenerative Disease, Dementia Research Centre, UCL Institute of Neurology, Queen Square, London, UK. Philip Vandamme, Neurology Service, University Hospitals Leuven, Belgium; Laboratory for Neurobiology, VIB‐KU Leuven Centre for Brain Research, Leuven, Belgium. Mathieu Vandenbulcke, Geriatric Psychiatry Service, University Hospitals Leuven, Belgium; Neuropsychiatry, Department of Neurosciences, KU Leuven, Leuven, Belgium. Michele Veldsman, Nuffield Department of Clinical Neurosciences, Medical Sciences Division, University of Oxford, UK. Ana Verdelho, Department of Neurosciences, Santa Maria Hospital, University of Lisbon, Portugal. Jorge Villanua, OSATEK Unidad de Donostia, San Sebastian, Gipuzkoa, Spain. Jason Warren, Dementia Research Centre, Department of Neurodegenerative Disease, UCL Institute of Neurology, Queen Square, London, UK. Carlo Wilke, Hertie Institute for Clinical Brain Research, University of Tuebingen, Tuebingen, Germany. Ione Woollacott, Dementia Research Centre, Department of Neurodegenerative Disease, UCL Institute of Neurology, Queen Square, London, UK. Elisabeth Wlasich, Neurologische Klinik, Ludwig‐Maximilians‐Universität München, Munich, Germany. Henrik Zetterberg, Department of Neurodegenerative Disease, UCL Institute of Neurology, London, UK. Miren Zulaica, Neuroscience Area, Biodonostia Health Research Institute, Paseo Dr Begiristain sn, CP 20014, San Sebastian, Gipuzkoa, Spain.
McCarthy, J. , Borroni, B. , Sanchez‐Valle, R. , Moreno, F. , Laforce, R. Jr , Graff, C. , Synofzik, M. , Galimberti, D. , Rowe, J. B. , Masellis, M. , Tartaglia, M. C. , Finger, E. , Vandenberghe, R. , de Mendonça, A. , Tagliavini, F. , Santana, I. , Butler, C. , Gerhard, A. , Danek, A. , Levin, J. , Otto, M. , Frisoni, G. , Ghidoni, R. , Sorbi, S. , Jiskoot, L. C. , Seelaar, H. , van Swieten, J. C. , Rohrer, J. D. , Iturria‐Medina, Y. , Ducharme, S. , & GENetic Frontotemporal Dementia Initiative (GENFI) (2022). Data‐driven staging of genetic frontotemporal dementia using multi‐modal MRI . Human Brain Mapping, 43(6), 1821–1835. 10.1002/hbm.25727
Yasser Iturria‐Medina and Simon Ducharme equally shared the senior authorship.
Funding information Fondation Brain Canada; Fonds de Recherche du Québec ‐ Santé; Canada Foundation for Innovation, Grant/Award Number: CFI Project 34874; Health Canada; Brain Canada Foundation
Contributor Information
Simon Ducharme, Email: simon.ducharme@mcgill.ca.
GENetic Frontotemporal Dementia Initiative (GENFI):
Sónia Afonso, Maria Rosario Almeida, Sarah Anderl‐Straub, Christin Andersson, Anna Antonell, Silvana Archetti, Andrea Arighi, Mircea Balasa, Myriam Barandiaran, Nuria Bargalló, Robart Bartha, Benjamin Bender, Alberto Benussi, Luisa Benussi, Valentina Bessi, Giuliano Binetti, Sandra Black, Martina Bocchetta, Sergi Borrego‐Ecija, Jose Bras, Rose Bruffaerts, Marta Cañada, Valentina Cantoni, Paola Caroppo, David Cash, Miguel Castelo‐Branco, Rhian Convery, Thomas Cope, Maura Cosseddu, María de Arriba, Giuseppe Di Fede, Zigor Díaz, Alina Díez, Diana Duro, Chiara Fenoglio, Camilla Ferrari, Carlos Ferreira, Catarina B. Ferreira, Toby Flanagan, Nick Fox, Morris Freedman, Giorgio Fumagalli, Alazne Gabilondo, Roberto Gasparotti, Serge Gauthier, Stefano Gazzina, Giorgio Giaccone, Ana Gorostidi, Caroline Greaves, Rita Guerreiro, Carolin Heller, Tobias Hoegen, Begoña Indakoetxea, Vesna Jelic, Hans‐Otto Karnath, Ron Keren, Tobias Langheinrich, Maria João Leitão, Albert Lladó, Gemma Lombardi, Sandra Loosli, Carolina Maruta, Simon Mead, Lieke Meeter, Gabriel Miltenberger, Rick van Minkelen, Sara Mitchell, Katrina M Moore, Benedetta Nacmias, Mollie Neason, Jennifer Nicholas, Linn Öijerstedt, Jaume Olives, Sebastien Ourselin, Alessandro Padovani, Jessica Panman, Janne Papma, Georgia Peakman, Irene Piaceri, Michela Pievani, Yolande Pijnenburg, Cristina Polito, Enrico Premi, Sara Prioni, Catharina Prix, Rosa Rademakers, Veronica Redaelli, Tim Rittman, Ekaterina Rogaeva, Pedro Rosa‐Neto, Giacomina Rossi, Martin Rossor, Beatriz Santiago, Elio Scarpini, Sonja Schönecker, Elisa Semler, Rachelle Shafei, Christen Shoesmith, Miguel Tábuas‐Pereira, Mikel Tainta, Ricardo Taipa, David Tang‐Wai, David L Thomas, Paul Thompson, Hakan Thonberg, Carolyn Timberlake, Pietro Tiraboschi, Emily Todd, Philip Vandamme, Mathieu Vandenbulcke, Michele Veldsman, Ana Verdelho, Jorge Villanua, Jason Warren, Carlo Wilke, Ione Woollacott, Elisabeth Wlasich, Henrik Zetterberg, and Miren Zulaica
DATA AVAILABILITY STATEMENT
The data used in this study are part of the Genetic Frontotemporal dementia Initiative (GENFI). The senior author (S. Ducharme) had full access to all the data in the study and takes responsibility for the integrity of the data and the accuracy of the data analysis. Information on GENFI data availability can be obtained by contacting genfi@ucl.ac.uk.
REFERENCES
- Abid, A. , Zhang, M. J. , Bagaria, V. K. , & Zou, J. (2018). Exploring patterns enriched in a dataset with contrastive principal component analysis. Nature Communications, 9(1), 2134. 10.1038/s41467-018-04608-8 [DOI] [PMC free article] [PubMed] [Google Scholar]
- Ashburner, J. (2007). A fast diffeomorphic image registration algorithm. NeuroImage, 38, 95–113. 10.1016/j.neuroimage.2007.07.007 [DOI] [PubMed] [Google Scholar]
- Benussi, A. , Karikari, T. K. , Ashton, N. , Gazzina, S. , Premi, E. , Benussi, L. , … Borroni, B. (2020). Diagnostic and prognostic value of serum NfL and p‐tau 181 in frontotemporal lobar degeneration. Journal of Neurology, Neurosurgery and Psychiatry, 91, 960–967. 10.1136/jnnp-2020-323487 [DOI] [PubMed] [Google Scholar]
- Bisenius, S. , Neumann, J. , & Schroeter, M. L. (2016). Validating new diagnostic imaging criteria for primary progressive aphasia via anatomical likelihood estimation meta‐analyses. European Journal of Neurology, 23, 704–712. 10.1111/ene.12902 [DOI] [PubMed] [Google Scholar]
- Cash, D. M. , Bocchetta, M. , Thomas, D. L. , Dick, K. M. , van Swieten, J. C. , Borroni, B. , … Rohrer, J. D. (2018). Patterns of gray matter atrophy in genetic frontotemporal dementia: Results from the GENFI study. Neurobiology of Aging, 62, 191–196. 10.1016/j.neurobiolaging.2017.10.008 [DOI] [PMC free article] [PubMed] [Google Scholar]
- Dopper, E. G. P. , Rombouts, S. A. R. B. , Jiskoot, L. C. , Den Heijer, T. , De Graaf, J. R. A. , De Koning, I. , … Van Swieten, J. C. (2014). Structural and functional brain connectivity in presymptomatic familial frontotemporal dementia. Neurology, 83, e19–e26. 10.1212/WNL.0000000000000583 [DOI] [PubMed] [Google Scholar]
- Feis, R. A. , Bouts, M. J. R. J. , Panman, J. L. , Jiskoot, L. C. , Dopper, E. G. P. , Schouten, T. M. , … Rombouts, S. A. R. B. (2018). Single‐subject classification of presymptomatic frontotemporal dementia mutation carriers using multimodal MRI. NeuroImage: Clinical, 20, 188–196. [DOI] [PMC free article] [PubMed] [Google Scholar]
- Folch‐Fortuny, A. , Arteaga, F. , & Ferrer, A. (2016). Missing data imputation toolbox for MATLAB. Chemometrics and Intelligent Laboratory Systems, 154, 93–100. 10.1016/j.chemolab.2016.03.019 [DOI] [Google Scholar]
- Fortin, J. P. , Cullen, N. , Sheline, Y. I. , Taylor, W. D. , Aselcioglu, I. , Cook, P. A. , … Shinohara, R. T. (2018). Harmonization of cortical thickness measurements across scanners and sites. NeuroImage, 167, 104–120. 10.1016/j.neuroimage.2017.11.024 [DOI] [PMC free article] [PubMed] [Google Scholar]
- Fortin, J. P. , Parker, D. , Tunç, B. , Watanabe, T. , Elliott, M. A. , Ruparel, K. , … Shinohara, R. T. (2017). Harmonization of multi‐site diffusion tensor imaging data. NeuroImage, 161, 149–170. 10.1016/j.neuroimage.2017.08.047 [DOI] [PMC free article] [PubMed] [Google Scholar]
- Gorno‐Tempini, M. , Hillis, A. , Weintraub, S. , Kertesz, A. , Mendez, M. , Cappa, S. , … Grossman, M. (2011). Classification of primary progressive aphasia and its variants. Neurology, 76, 1006–1014. 10.1212/WNL.0b013e31821103e6 [DOI] [PMC free article] [PubMed] [Google Scholar]
- Iturria‐Medina, Y. , Carbonell, F. , Assadi, A. , Adewale, Q. , Khan, A. F. , Baumeister, T. R. , & Sanchez‐Rodriguez, L. (2021). Integrating molecular, histopathological, neuroimaging and clinical neuroscience data with NeuroPM‐box. Communications Biology, 4, 614. 10.1038/s42003-021-02133-x [DOI] [PMC free article] [PubMed] [Google Scholar]
- Iturria‐Medina, Y. , Carbonell, F. M. , Sotero, R. C. , Chouinard‐Decorte, F. , & Evans, A. C. (2017). Multifactorial causal model of brain (dis)organization and therapeutic intervention: Application to Alzheimer's disease. NeuroImage, 152, 60–77. 10.1016/j.neuroimage.2017.02.058 [DOI] [PubMed] [Google Scholar]
- Iturria‐Medina, Y. , Khan, A. F. , Adewale, Q. , & Shirazi, A. H. (2020). Blood and brain gene expression trajectories mirror neuropathology and clinical deterioration in neurodegeneration. Brain, 143(2), 661–673. 10.1093/brain/awz400 [DOI] [PMC free article] [PubMed] [Google Scholar]
- Jiskoot, L. C. , Bocchetta, M. , Nicholas, J. M. , Cash, D. M. , Thomas, D. , Modat, M. , … Rohrer, J. D. (2018). Presymptomatic white matter integrity loss in familial frontotemporal dementia in the GENFI cohort: A cross‐sectional diffusion tensor imaging study. Annals of Clinical Translational Neurology, 5(9), 1025–1036. 10.1002/acn3.601 [DOI] [PMC free article] [PubMed] [Google Scholar]
- Jiskoot, L. C. , Panman, J. L. , Meeter, L. H. , Dopper, E. G. P. , Donker Kaat, L. , Franzen, S. , … Van Swieten, J. C. (2019). Longitudinal multimodal MRI as prognostic and diagnostic biomarker in presymptomatic familial frontotemporal dementia. Brain, 142, 193–208. 10.1093/brain/awy288 [DOI] [PMC free article] [PubMed] [Google Scholar]
- Johnson, W. E. , Li, C. , & Rabinovic, A. (2007). Adjusting batch effects in microarray expression data using empirical Bayes methods. Biostatistics, 8(1), 118–127. 10.1093/biostatistics/kxj037 [DOI] [PubMed] [Google Scholar]
- Klein, A. , & Tourville, J. (2012). 101 labeled brain images and a consistent human cortical labeling protocol. Frontiers in Neuroscience, 6, 171. 10.3389/fnins.2012.00171 [DOI] [PMC free article] [PubMed] [Google Scholar]
- Lam, B. Y. K. , Halliday, G. M. , Irish, M. , Hodges, J. R. , & Piguet, O. (2014). Longitudinal white matter changes in frontotemporal dementia subtypes. Human Brain Mapping, 35, 3547–3557. 10.1002/hbm.22420 [DOI] [PMC free article] [PubMed] [Google Scholar]
- Lashley, T. , Rohrer, J. D. , Mead, S. , & Revesz, T. (2015). Review: An update on clinical, genetic and pathological aspects of frontotemporal lobar degenerations. Neuropathology and Applied Neurobiology, 41, 858–881. 10.1111/nan.12250 [DOI] [PubMed] [Google Scholar]
- Lee, S. E. , Sias, A. C. , Mandelli, M. L. , Brown, J. A. , Brown, A. B. , Khazenzon, A. M. , … Seeley, W. W. (2017). Network degeneration and dysfunction in presymptomatic C9ORF72 expansion carriers. NeuroImage: Clinical, 14, 286–297. 10.1016/j.nicl.2016.12.006 [DOI] [PMC free article] [PubMed] [Google Scholar]
- Meeter, L. H. , Dopper, E. G. , Jiskoot, L. C. , Sanchez‐Valle, R. , Graff, C. , Benussi, L. , … van Swieten, J. C. (2016). Neurofilament light chain: A biomarker for genetic frontotemporal dementia. Annals of Clinical Translational Neurology, 3(8), 623–636. 10.1002/acn3.325 [DOI] [PMC free article] [PubMed] [Google Scholar]
- Meeter, L. H. , Kaat, L. D. , Rohrer, J. D. , & van Swieten, J. C. (2017). Imaging and fluid biomarkers in frontotemporal dementia. Nature Reviews Neurology, 13(7), 406–419. 10.1038/nrneurol.2017.75 [DOI] [PubMed] [Google Scholar]
- Moore, K. M. , Nicholas, J. , Grossman, M. , McMillan, C. T. , Irwin, D. J. , Massimo, L. , … Geschwind, D. (2020). Age at symptom onset and death and disease duration in genetic frontotemporal dementia: An international retrospective cohort study. The Lancet Neurology, 19, 145–156. 10.1016/S1474-4422(19)30394-1 [DOI] [PMC free article] [PubMed] [Google Scholar]
- Olney, N. T. , Ong, E. , Goh, S. Y. M. , Bajorek, L. , Dever, R. , Staffaroni, A. M. , … Rosen, H. J. (2020). Clinical and volumetric changes with increasing functional impairment in familial frontotemporal lobar degeneration. Alzheimer's & Dementia, 16(1), 49–59. 10.1016/j.jalz.2019.08.196 [DOI] [PMC free article] [PubMed] [Google Scholar]
- Pan, P. L. , Song, W. , Yang, J. , Huang, R. , Chen, K. , Gong, Q. Y. , … Shang, H. F. (2012). Gray matter atrophy in behavioral variant Frontotemporal dementia: A meta‐analysis of voxel‐based morphometry studies. Dementia and Geriatric Cognitive Disorders, 33, 141–148. 10.1159/000338176 [DOI] [PubMed] [Google Scholar]
- Panman, J. L. , Jiskoot, L. C. , Bouts, M. J. R. J. , Meeter, L. H. H. , van der Ende, E. L. , Poos, J. M. , … Papma, J. M. (2019). Gray and white matter changes in presymptomatic genetic frontotemporal dementia: A longitudinal MRI study. Neurobiology of Aging, 76, 115–124. 10.1016/j.neurobiolaging.2018.12.017 [DOI] [PubMed] [Google Scholar]
- Panman, J. L. , Venkatraghavan, V. , Van Der Ende, E. L. , Steketee, R. M. E. , Jiskoot, L. C. , Poos, J. M. , … Klein, S. (2021). Modelling the cascade of biomarker changes in GRN‐related frontotemporal dementia. Journal of Neurology, Neurosurgery and Psychiatry, 92(5), 494–501. 10.1136/jnnp-2020-323541 [DOI] [PMC free article] [PubMed] [Google Scholar]
- Premi, E. , Cauda, F. , Costa, T. , Diano, M. , Gazzina, S. , Gualeni, V. , … Borroni, B. (2016). Looking for neuroimaging markers in frontotemporal lobar degeneration clinical trials: A multi‐voxel pattern analysis study in Granulin disease. Journal of Alzheimer's Disease, 51(1), 249–262. 10.3233/JAD-150340 [DOI] [PubMed] [Google Scholar]
- Rademakers, R. , Neumann, M. , & Mackenzie, I. R. (2012). Advances in understanding the molecular basis of frontotemporal dementia. Nature Reviews Neurology, 8, 423–434. 10.1038/nrneurol.2012.117 [DOI] [PMC free article] [PubMed] [Google Scholar]
- Rascovsky, K. , Hodges, J. R. , Knopman, D. , Mendez, M. F. , Kramer, J. H. , Neuhaus, J. , … Miller, B. L. (2011). Sensitivity of revised diagnostic criteria for the behavioural variant of frontotemporal dementia. Brain, 134, 2456–2477. 10.1093/brain/awr179 [DOI] [PMC free article] [PubMed] [Google Scholar]
- Rohrer, J. D. , Nicholas, J. M. , Cash, D. M. , van Swieten, J. , Dopper, E. , Jiskoot, L. , … Rossor, M. N. (2015). Presymptomatic cognitive and neuroanatomical changes in genetic frontotemporal dementia in the genetic Frontotemporal dementia initiative (GENFI) study: A cross‐sectional analysis. The Lancet Neurology, 14, 253–262. 10.1016/S1474-4422(14)70324-2 [DOI] [PMC free article] [PubMed] [Google Scholar]
- Rohrer, J. D. , Woollacott, I. O. C. , Dick, K. M. , Brotherhood, E. , Gordon, E. , Fellows, A. , … Zetterberg, H. (2016). Serum neurofilament light chain protein is a measure of disease intensity in frontotemporal dementia. Neurology, 87(13), 1329–1336. 10.1212/WNL.0000000000003154 [DOI] [PMC free article] [PubMed] [Google Scholar]
- Seeley, W. W. , Crawford, R. K. , Zhou, J. , Miller, B. L. , & Greicius, M. D. (2009). Neurodegenerative diseases target large‐scale human brain networks. Neuron, 62, 42–52. 10.1016/j.neuron.2009.03.024 [DOI] [PMC free article] [PubMed] [Google Scholar]
- Staffaroni, A. M. , Cobigo, Y. , Goh, S. Y. M. , Kornak, J. , Bajorek, L. , Chiang, K. , … Rosen, H. J. (2020). Individualized atrophy scores predict dementia onset in familial frontotemporal lobar degeneration. Alzheimer's & Dementia, 16(1), 37–48. 10.1016/j.jalz.2019.04.007 [DOI] [PMC free article] [PubMed] [Google Scholar]
- Tournier, J. D. , Smith, R. , Raffelt, D. , Tabbara, R. , Dhollander, T. , Pietsch, M. , … Connelly, A. (2019). MRtrix3: A fast, flexible and open software framework for medical image processing and visualisation. NeuroImage, 202, 116137. 10.1016/j.neuroimage.2019.116137 [DOI] [PubMed] [Google Scholar]
- Tsai, R. M. , & Boxer, A. L. (2016). Therapy and clinical trials in frontotemporal dementia: Past, present, and future. Journal of Neurochemistry, 138(Suppl 1), 211–221. 10.1111/jnc.13640 [DOI] [PMC free article] [PubMed] [Google Scholar]
- van der Ende, E. L. , Meeter, L. H. , Poos, J. M. , Panman, J. L. , Jiskoot, L. C. , Dopper, E. G. P. , … van Swieten, J. C. (2019). Serum neurofilament light chain in genetic frontotemporal dementia: A longitudinal, multicentre cohort study. The Lancet Neurology, 18, 1103–1111. 10.1016/S1474-4422(19)30354-0 [DOI] [PubMed] [Google Scholar]
- Whitwell, J. L. , Avula, R. , Senjem, M. L. , Kantarci, K. , Weigand, S. D. , Samikoglu, A. , … Jack, C. R. (2010). Gray and white matter water diffusion in the syndromic variants of frontotemporal dementia. Neurology, 74(16), 1279–1287. 10.1212/WNL.0b013e3181d9edde [DOI] [PMC free article] [PubMed] [Google Scholar]
- Young, A. L. , Marinescu, R. V. , Oxtoby, N. P. , Bocchetta, M. , Yong, K. , Firth, N. C. , … Furst, A. J. (2018). Uncovering the heterogeneity and temporal complexity of neurodegenerative diseases with subtype and stage inference. Nature Communications, 9, 4273. 10.1038/s41467-018-05892-0 [DOI] [PMC free article] [PubMed] [Google Scholar]
- Zou, Q. H. , Zhu, C. Z. , Yang, Y. , Zuo, X. N. , Long, X. Y. , Cao, Q. J. , … Zang, Y. F. (2008). An improved approach to detection of amplitude of low‐frequency fluctuation (ALFF) for resting‐state fMRI: Fractional ALFF. Journal of Neuroscience Methods, 172, 137–141. 10.1016/j.jneumeth.2008.04.012 [DOI] [PMC free article] [PubMed] [Google Scholar]
Associated Data
This section collects any data citations, data availability statements, or supplementary materials included in this article.
Supplementary Materials
FIGURE S1 Association between cTI identified disease scores and (a) MMSE, (b) CBI‐R, (c) disease status, and (d) EYO in a subset of subjects with all imaging modalities at baseline (n = 282). In c, points are laid over a 1.96 SEM (95% confidence interval) in red and at 1 SD in blue. CBI, Cambridge Behavioural Inventory; EYO, estimated years to symptom onset; MMSE, Mini‐Mental State Examination
FIGURE S2 Association between cTI identified disease scores and neuropsychological tests in a subset of subjects with all imaging modalities at baseline (n = 282). TMTA, Trail Making Test Part A; TMTB, Trail Making Test Part B; VF, verbal fluency
FIGURE S3 Total contribution of each modality to the cTI identified disease scores in a subset of subjects with all imaging modalities at baseline (n = 282). FA, fractional anisotropy; fALFF, fractional amplitude of low frequency fluctuations; GM, gray matter; MD, mean diffusivity
FIGURE S4 Total contribution of each brain region to the cTI identified disease scores in a subset of subjects with all imaging modalities at baseline (n = 282). FA, fractional anisotropy; fALFF, fractional amplitude of low frequency fluctuations; GM, gray matter; L, left; MD, mean diffusivity; R, right.
Data Availability Statement
The data used in this study are part of the Genetic Frontotemporal dementia Initiative (GENFI). The senior author (S. Ducharme) had full access to all the data in the study and takes responsibility for the integrity of the data and the accuracy of the data analysis. Information on GENFI data availability can be obtained by contacting genfi@ucl.ac.uk.