

Abstract
Objective
To update the prevalence of eating disorders in the general population before 2021 and to analyze the distribution characteristics at different times and in different regions and sexes, as well as the diagnostic criteria.
Methods
Based on the method from a previous report by the authors, studies were identified from the following databases: PubMed/Medline, PsycINFO, ISI Web of Knowledge, Ovid and the 4 most important Chinese databases. Articles in English and Chinese before 2021 were retrieved. The data retrieved at this time were pooled with the data from a previous report for analyses.
Results
Thirty-three studies were identified, which included 18 studies supplemented in this retrieval. The pooled lifetime and 12-month prevalence of eating disorders were 0.91% (95% CI, 0.48–1.71) and 0.43% (95% CI, 0.18–0.78), respectively. The pooled lifetime and 12-month prevalence of the subgroup EDs (any), which covers all types of eating disorders, were 1.69% and 0.72%, respectively. The lifetime prevalence of AN, BN and BED was 0.16% (95% CI, 0.06–0.31), 0.63% (95% CI, 0.33–1.02) and 1.53% (95% CI, 1.00–2.17), respectively. The lifetime prevalence of EDs in Western countries was 1.89%, and was high at 2.58% in females. Prevalence studies using DSM-5 criteria were scarce.
Conclusions
The prevalence of eating disorders might be underestimated thus far. Not all types of EDs were included in a majority of epidemiological surveys, and the prevalence rates of the new types of EDs were significantly higher. Eating disorders were especially common in Western countries and in females. New diagnostic criteria should be used to comprehensively assess all types of eating disorders.
Level of evidence
1, systematic review and meta-analysis.
Keywords: Eating disorders (EDs), Anorexia nervosa (AN), Bulimia nervosa (BN), Binge eating disorder (BED), Prevalence, General population
Introduction
Eating disorders (EDs) are a group of syndromes characterized by eating behaviors and psychological disorders accompanied by weight changes and/or social disorders that have a significant influence on quality of life and social function [1, 2]. Moreover, individuals with eating disorders may develop severe somatic complications that can cause a higher risk of suicide [3] and increased mortality rates, especially anorexia nervosa (AN) [4], one of the main types, with a fatality rate as high as 5–20% [5].
The criteria of eating disorders evolved over time. In the Diagnostic and statistical Manual of Mental Disorders, 4th edition (DSM-IV) [6], eating disorders include anorexia nervosa (AN), bulimia nervosa (BN), and eating disorder not otherwise specified (EDNOS). EDNOS is a complex diagnosis recognized as all eating disorders that do not meet the diagnostic criteria of AN or BN or cannot be categorized into either of the two. Binge eating disorder (BED) is also classified into EDNOS and is listed in appendix. However, recent studies found that the impact of physical and psychological damage caused by EDNOS is no less than that caused by the classic eating disorder types AN or BN [7]. In the DSM-5 issued in 2013 [8], the diagnostic categories of eating disorders were expanded to “feeding and eating disorders”, in which feeding and eating disorders first seen in infants and early childhood were included. Binge eating disorder (BED) was listed individually in the diagnostic criteria. Exclusive of AN, BN and BED, the rest are classified as other specified feeding and eating disorder (OSFED) and unspecified feeding and eating disorder (UFED). OSFED refers to eating disorders that can lead to patients' clinical suffering or damage to social function, such as atypical AN, atypical BN, atypical BED, purging disorder, and night eating syndrome, which do not meet the criteria for AN, BN or BED. Other eating disorders that cause clinical suffering or impaired social function in patients but do not meet the diagnostic conditions listed above are classified as UFED. Apart from the changes in classification, the diagnostic criteria of all types of eating disorders were relaxed in DSM-5. The weight loss requirement has been relaxed, and the requirement of “amenorrhea” has been removed in AN. In the diagnosis of BN, the frequency of binge eating or unduly compensational behavior was lowered from twice a week to once a week. Similarly, the frequency of binge eating in BED diagnostic criteria has also been lowered to once a week (Table 1).
Table 1.
Differences in the diagnostic criteria for eating disorders between DSM-IV and DSM-5
| Types of EDs | Diagnostic items | DSM-IV | DSM-5 |
|---|---|---|---|
| AN | Weight | Lower than 85% of normal weight/body mass index (BMI) ≤ 17.5 kg/m2 | Lower than the lowest value of normal weight/ / lower than the lowest predictive value of children or juvenile |
| Amenorrhea | Specified | N/A | |
| Course | Not mentioned | 3 months | |
| BN | Frequency of bulimia nervosa and compensation behavior | Twice a week | Once a week |
| BED | Diagnosis | Listed in the appendix | Listed formally in the diagnostic classification |
| Frequency of binge eating disorder | Twice a week | Once a week | |
| EDNOS | Diagnosis | Specified | N/A |
| OSFED | Diagnosis | N/A | Specified |
| UFED | Diagnosis | N/A | Specified |
Eating disorders had been claimed to be represented predominantly in Western countries and women in the past, which may be due to cultural beliefs and attitudes in some aspect [9]. With industrialization and globalization, many regions reported increasing incidence rates of eating disorders [10, 11]. What’s more, the reported prevalence of eating disorders in the general population varied widely all along, which ranges from 0.1% [12] to 3.8% [13]. To address these issues, a systematic review on the prevalence of eating disorders in the general population was performed in 2013 by the author [14]. It showed that there were serious limitations in the available epidemiological data, especially from low- and middle-income countries, including China. Only 15 studies were included during the past 30 years since 2013. The pooled lifetime prevalence of eating disorders was 1.01%, but the specific types of eating disorders varied among the studies included. The prevalence of eating disorders was higher in women, and in Western than Asian countries, but South Korea was the only Asian country. The prevalence tended to increase over time but may also be caused by changes in the diagnostic criteria.
With the increasing attention to eating disorders in recent years, more and more related studies have emerged. Epidemiological studies have also increased, with many from the Asia countries and some even reporting high prevalence rates [15, 16]. More researches in men have also been reported, and the view that women are dominant seems to have wavered [4, 17]. In the meantime, some studies have indicated that the resulting prevalence by using DSM-5 is different from that by using DSM-IV [17–20]. In order to better understand the prevalence and the distribution characteristics of eating disorders, this study updated the systematic review on the prevalence of eating disorders in the general population. Thus, the main objectives of this study are (1) to update the prevalence of eating disorders and various types in the general population before 2021; (2) to analyze the distribution characteristics at different times and in different regions and sexes, as well as the diagnostic criteria between DSM-IV and DSM-5.
Method
Literature retrieval strategies
Previous research methods were followed in this study. The retrieved databases included PubMed/Medline, PsycINFO, ISI Web of Knowledge, Ovid and the Chinese Databases Chinese National Knowledge Infrastructure, Chongqing VIP database for Chinese Technical Periodicals, WANFANG DATA, and China BioMedical Literature Services System (SinoMed). The dates of retrieval were from 1 May 2013 to 31 January 2021. Only English and Chinese articles are included.
Other than the key words ‘eating disorders’, ‘anorexia nervosa’, ‘bulimia nervosa’, ‘prevalence’, and ‘epidemiology’ in both English and Chinese used in our previous study, we added a new key word ‘mental’ in Chinese in this study. Furthermore, articles before May 2013 were additionally retrieved by using the key words 'mental' and ‘prevalence/epidemiology’. All references in the included literature were then retrieved manually.
After all duplicated studies retrieved from the databases were removed automatically by EndnoteX7, preliminary screening based on the title and abstract was carried out by two authors (Jie Qian & Ying Wu) independently. The full texts of the literature above were downloaded and reviewed, followed by screening on the basis of the pre-established inclusion and exclusion criteria. For those studies for which consensus was not reached, even after discussion by both authors, a third member (Wan Yumei) decided whether to include the study or not.
Inclusion and exclusion criteria
Inclusion criteria: (1) the epidemiological survey of the eating disorder evaluated a general population; (2) the diagnostic criteria of the eating disorder conformed to that of DSM or the ICD or the CCMD; (3) tools for screening were admitted; and (4) information such as prevalence and sample size in literatures could be extracted.
Exclusion criteria: (1) nonhuman studies, reviews, case reports and redundant published studies; and (2) studies on special populations, such as women, students, juveniles, hospitals and armies.
Data extraction
For the included literature, data were extracted by Jie Qian and Ying Wu. The extracted items included first author; study year; study region; sampling method; diagnostic criteria; overall sample size; the number of cases; lifetime, 12-month, 3-month and 4-week prevalence rates; and sex.
Evaluation of study quality
Similar to a previous study, the evaluation of the included literature followed the standards of the necessary items listed in Strengthening the Reporting of Observational Studies in Epidemiology (STROBE). Every item counted as a score of 1, with the total score ranging from 0 to 22.
Statistical analysis
The Metaprop package in R version 3.6.2 software was applied, and Logit was used to perform rate conversion for consolidation computation. A heterogeneity test was performed. If I2 (statistics of effect value variation caused by heterogeneity) was less than 50% and the heterogeneity test p > 0.10, the fixed-effects model was adopted for rate consolidation; otherwise, the random-effects model was adopted. When there was significant heterogeneity among studies, sensitivity analysis was conducted. The funnel chart method was used to evaluate the publication bias of the included studies.
Results
A total of 29,201 unduplicated articles were retrieved at this time, 18,713 of which were in Chinese. After secondary screening, 18 studies were included according to the inclusion and exclusion criteria (Fig. 1).
Fig. 1.

Identification of studies included in the analysis
Characteristics of the included studies
Thirty-three studies were identified, which included 15 studies reported in the systematic review in 2013 [14]. Among the 18 included studies in this retrieval, 3 studies offered 2 or 3 groups of data: Hay 2017’s study [1] was performed in 2014 and 2015, respectively; Choi 2015’s study [21] was divided into KECR-R (performed in 2006–2007) and KECA-2011 (performed in 2011); and Shi 2015’s study [12] showed three groups of data from Shanxi Province, Gansu Province and Henan Province in China. Hence, there were 22 groups of data in total. The publication times of all studies ranged from 2002 to 2021, and the study times ranged from 2001 to 2017; however, the study time of one article published in 2014 was not specified [22]. There were 6 Chinese articles (including 3 dissertations [12, 23, 24]) and 13 separate English articles. Three studies were conducted in America [13, 18, 25]; 3 in Australia [1, 26]; 1 each in Italy [22], Switzerland [17], Korea [21] and Saudi Arabia [15, 16]; and 8 in China [12, 23, 24, 27–31], in which only 1 was national research [31], while the remaining 7 were regional studies limited to provinces or cities. DSM-IV and DSM-5 were used as newer diagnostic criteria than DSM-III and ICD. DSM-5 alone was applied in 4 studies, DSM-IV alone was applied in 11 studies, and DSM-IV and DSM-5 were both applied in the remaining 3 studies [22]. The cumulative total sample size of all studies was 242,917, with no subjects under the age of 15 years. There were only three studies involving EDs, of which one encompassed all types of eating disorders [13]; one included AN, BN and BED [17]; and the other did not specify the details of the eating disorders [12]. There were 15 studies referring to AN, 13 to BN and 10 to BED; other than that, there were two involving UFED, a new type in DSM-5, and one involving OSFED (Fig. 2).
Fig. 2.
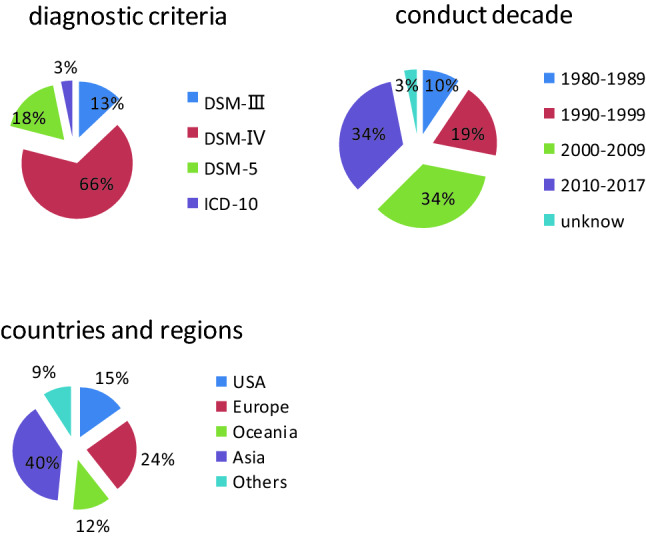
The proportion of different diagnostic criteria, conduct decade, countries and regions
The 33 studies included 315,877 participants. The studies were conducted from 1984 to 2017, with diagnostic criteria including DSM-III, DSM-IV, DSM-5 and ICD. The studies were conducted in the United States; European countries, including Germany, the Netherlands, Norway, Italy, Switzerland, Belgium, France, and Spain; Asian countries, including South Korea, China and Saudi Arabia; Oceanic countries, including Australia and New Zealand; and Latin countries, including Mexico [32] and Brazil [33]. In addition, there was an included study organized by the WHO involving 14 countries [34]. The specific percentages of study year, region and diagnostic criteria are shown in Table 2.
Table 2.
Characteristics of the 18 Supplementary included studies
| Study | Region | Sampling methoda | Study time | Diagnostic criteriab | Sample size | Diagnosisc | Lifetime | Eventsd | ||
|---|---|---|---|---|---|---|---|---|---|---|
| 12-m | 3-m | 4-w | ||||||||
| Shi 2005 | China (Zhejiang) | M,S,C | 2001 | DSM-IV | 14,639 | AN | – | – | – | 2 |
| Li 2008 | China (Hebei) | R, M,S,C | 2004–2005 | DSM-IV | 20,716 | AN | 3 | – | – | 3 |
| BN | 1 | 1 | ||||||||
| Yu 2010 | China (Guangzhou) | R,S,C | 2009–2010 | DSM-IV | 2707 | AN | 1 | 1 | – | 1 |
| Fang 2011 | China (Fujian) | M,S,C | 2009 | DSM-IV | 9986 | AN | 1 | – | – | – |
| BN | 0 | |||||||||
| BED | 0 | |||||||||
| Liu 2012 | China (Zhengzhou) | M,S,C | 2011 | DSM-IV | 2 066 | ED | 37 | 14 | – | – |
| Carta 2014 | Italian | R | – | DSM-IV | 3398 | AN | 24 | – | – | – |
| BN | 20 | |||||||||
| BED | 16 | |||||||||
| Hay 2015 | Australia | R |
2008- 2009 |
DSM-5 | 6041 | AN | – | – | 28 | – |
| BN | 40 | |||||||||
| BED | 337 | |||||||||
| UFED | 85 | |||||||||
| Chio 2015 | South Korea | M,S,C | Keca-R | DSM-IV | 6510 | AN | 0* | – | – | – |
| 2006–2007 | BN | 7* | ||||||||
| Keca 2011 | 6027 | AN | 0* | |||||||
| 2011 | BN | 6* | ||||||||
| Shi 2015 | China(Shanxi) | M,S | 2013–2014 | DSM-IV | 901 | ED | 1 | 0 | – | 0 |
| (Gansu) | 1014 | ED | 4 | 2 | 1 | |||||
| (Henan) | 1693 | ED | 4 | 4 | 3 | |||||
| Mohler-Kuo 2016 | Switzerland | M,R,S | 2010 | DSM-IV | 10,038 | AN | 72 | 5 | – | – |
| DSM-IV | BN | 167 | 51 | |||||||
| DSM-IV | BED | 162 | 59 | |||||||
| DSM-IV | ED | 361 | 113 | |||||||
| DSM-5 | AN | 109 | 5 | |||||||
| Cossrow 2016 | USA | 2013 | DSM-IV | 22,397 | BED | 340* | 258* | – | – | |
| DSM-5 | BED | 455* | 344 | 267* | ||||||
| Duncan 2017 | USA | S | 2001–2003 | DSM-IV | 12,337 | ED | 466 | 225 | – | |
| AN | 31 | 2 | – | |||||||
| BN | 186 | 78 | – | |||||||
| BED | 278 | 145 | ||||||||
| Wang 2017 | China (Liaoning) | M,S,C | 2014–2015 | DSM-IV | 19,733 | AN | – | – | 2 | |
| BN | 1 | |||||||||
| BED | 0 | |||||||||
| Hay 2017 | Australia | S | 2014 | DSM-5 | 2732 | AN | – | – | 0 | – |
| BN | 30 | |||||||||
| OSFED | 0 | |||||||||
| UFED | 0 | |||||||||
| 2015 | 3005 | AN | 0 | |||||||
| BN | 37 | |||||||||
| OSFED | 96 | |||||||||
| UFED | 311 | |||||||||
| Udo 2018 | USA | M | 2012–2013 | DSM-5 | 36,309 | AN | 276 | 13 | – | – |
| BN | 92 | 14 | ||||||||
| BED | 318 | 166 | ||||||||
| Huang 2019 | China | M,C | 2013–2015 | DSM-IV | 28,140 | AN | 8 | 1 | – | – |
| BN | 5 | 4 | ||||||||
| Altwaijri 2020 | Saudi | M,S,C | 2011–2016 | DSM-IV | 1981 | AN | – | 0 | – | – |
| BN | 57* | 42* | ||||||||
| BED | 63* | 20* | ||||||||
| Bagaric 2020 | Australia | S,R | 2017 | DSM-5 | 2977 | BN | 104* | – | 33* | – |
| BED | – | 6* | ||||||||
*The article did not provide the specific number of patients, but the prevalence, which was calculated according to
aR random, C cluster, S stratified, M multiphase
bDSM diagnostic and statistical manual, ICD International Classification of Diseases
cED eating disorders, AN anorexia nervosa, BN bulimia nervosa, BED binge eating disorder
Dlifetime lifetime prevalence, 12-m 12-month prevalence, 4-w 4-week prevalence
Evaluation of study quality and the assessment of publication bias
The mean (sd) quality score for the reports of the 19 studies based on the STROBE items was 17.97 (1.71), and the range in this score varied from 15.5 to 22.0. Ten studies scored over 18.0, accounting for 52.6%, indicating high general quality of the literature. The most common problems in the reports of these studies were inadequate descriptions of the numbers of individuals in every phase, the reason for nonparticipation, and the numbers of individuals with missing data.
The assessment of publication bias on the prevalence of eating disorders and the three main types of EDs was conducted using the funnel chart method. The publication bias levels of eating disorders (t = − 1.97, p = 0.077), AN (t = − 0.21, p = 0.839), BN (t = 1.12, p = 0.278) and BED (t = 0.1, p = 0.921) were not statistically significant.
Prevalence rates of eating disorders and the various types
The lifetime, 12-month and 4-week prevalence rates of eating disorders were 0.91% (95% CI, 0.48–1.71), 0.43% (95% CI, 0.18–0.78), and 0.2% (95% CI, 0.09–0.36), respectively. As described above, the specific types of eating disorders in the 11 studies involving eating disorders were not completely the same. Hence, the 11 studies were categorized into 4 groups: ED (any), ED (AN + BN + BED), ED (AN + BN), and ED (unknown), representing the 4 studies including all types of eating disorders [13, 35–37]; 1 study including AN, BN and BED [17]; 4 studies [38–41] including only AN and BN; and 2 others without specific content [12, 42]. A lifetime prevalence of 3.60% and a 12-month prevalence of 1.1% were reported in the only study from the ED (AN + BN + BED) group. The lifetime prevalence rates of the remaining groups were 1.69% (95% CI, 0.75–3.76) for ED (any), 0.83% (95% CI, 0.35–1.93) for ED (AN + BN), and 0.25% (95% CI, 0.13–0.48) for ED (unknown). The lifetime and 12-month prevalence rates of ED (any) were over twice those of ED (AN + BN), and over 1.5 times those of eating disorders (shown in Table 3 and Fig. 3).
Table 3.
Overall and subgroup prevalence of EATING DISORDERS
| Number of studies (number of datasets) | n | Number of cases | I2 (p-value) | Prevalence (%) | 95% CI | p-value | |
|---|---|---|---|---|---|---|---|
| Lifetime prevalence | 10 (12) | 61,230 | 1280 | 98.7 (< 0.001) | (R) 0.91 | 0.48–1.71 | – |
| ED(any) | 4 (4) | 24,732 | 682 | 98.9 (< 0.001) | (R) 1.69 | 0.75–3.76 | < 0.001 |
| ED(AN + BN) | 4 (4) | 22,852 | 228 | 97.5 (< 0.001) | (R) 0.83 | 0.35–1.93 | |
| ED(unknown) | 1 (3) | 3608 | 9 | 0.0 (0.435) | (F) 0.25 | 0.13–0.48 | |
| DSM-IV | 8 (10) | 52,088 | 1194 | 98.8 (< 0.001) | (R) 1.17 | 0.46–2.20 | – |
| DSM-5 | 0 | – | – | – | – | – | |
| Studies conducted 1990–1999 | 4 (4) | 17,398 | 147 | 87.5 (< 0.001) | (R) 0.91 | 0.59–1.31 | 0.005 |
| Studies conducted 2000–2009 | 4 (4) | 30,186 | 763 | 99.3 (< 0.001) | (R) 2.00 | 0.54–4.37 | |
| Studies conducted 2010–2017 | 2 (4) | 13,646 | 370 | 98.6 (< 0.001) | (R) 0.71 | 0.00–3.15 | |
| Studies in Western countries | 8 (8) | 51,347 | 1258 | 98.5 (< 0.001) | (R) 1.89 | 1.03–3.01 | < 0.001 |
| Studies in Asia | 2 (4) | 9883 | 22 | 0 (0.623) | (F) 0.22 | 0.14–0.32 | |
| Males | 7 (7) | 21,626 | 241 | 96.7 (< 0.001) | (R) 0.74 | 0.24 -1.52 | 0.034 |
| Females | 7 (7) | 24,380 | 869 | 98.8 (< 0.001) | (R) 2.58 | 1.06–4.74 | |
| 12-month prevalence | 10 (12) | 61,230 | 489 | 96.9 (< 0.001) | (R) 0.43 | 0.18–0.78 | – |
| ED(any) | 4 (4) | 24,732 | 290 | 98.0 (< 0.001) | 0.72 | 0.15–1.71 | < 0.001 |
| ED(AN + BN) | 4 (4) | 22,852 | 80 | 92.8 (< 0.001) | 0.34 | 0.11–0.69 | |
| ED(unknown) | 1 (3) | 3608 | 6 | 66.8 (0.049) | 0.10 | 0.00–0.38 | |
| DSM-IV | 8 (10) | 52,088 | 448 | 97.4 (< 0.001) | (R) 0.41 | 0.13–0.83 | – |
| DSM-5 | 0 | – | – | – | – | – | |
| Studies conducted 1990–1999 | 4 (4) | 17,398 | 62 | 69.3 (0.021) | (R) 0.36 | 0.59–1.31 | 0.776 |
| Studies conducted 2000–2009 | 4 (4) | 30,186 | 308 | 98.7 (< 0.001) | (R) 0.68 | 0.54–4.37 | |
| Studies conducted 2010–2017 | 2 (4) | 13,646 | 119 | 95.0 (< 0.001) | (R) 0.26 | 0.00–3.15 | |
| Studies in Western countries | 8 (8) | 51,347 | 480 | 96.6 (< 0.001) | (R) 0.68 | 0. 34–1.13 | < 0.001 |
| Studies in Asia | 2 (4) | 9883 | 9 | 61.0 (0.053) | (F) 0.08 | 0.01–0.23 | |
| Males | 7 (7) | 21,626 | 103 | 95.0 (< 0.001) | (R) 0.22 | 0.03–0.59 | 0.045 |
| Females | 7 (7) | 24,380 | 330 | 96.7 (< 0.001) | (R) 0.93 | 0.37–1.74 | |
| 4-week prevalence | 6 (8) | 27,072 | 61 | 81.4 (< 0.001) | (R) 0.20 | 0.09–0.36 | — |
Fig. 3.

The lifetime prevalence of eating disorders
The lifetime prevalence rates of AN, BN and BED were 0.16% (95% CI, 0.06–0.31), 0.63% (95% CI, 0.33–1.02) and 1.53% (95% CI, 1.00–2.17), respectively. The lifetime prevalence of BN was nearly 4 times that of AN, and that of BED was nearly 10 times that of AN, with a ratio of approximately 1:4:10. The 12-month prevalence rates were also with great disparity, with a ratio of approximately 1:16:46. BED prevalence was markedly higher than the prevalence of the other two classic types, whereas AN prevalence was the lowest (Tables 4, 5 and 6).
Table 4.
Overall and subgroup prevalence of ANOREXIA NERVOSA
| Number of studies (number of datasets) | n | Number of cases | I2 (p-value) | Prevalence (%) | 95% CI | p-value | |
|---|---|---|---|---|---|---|---|
| Lifetime prevalence | 19 (21) | 214,386 | 638 | 98.1 (< 0.001) | (R) 0.16 | 0.06–0.31 | – |
| DSM-IV | 14 (14) | 148,372 | 245 | 97.0 (< 0.001) | (R )0.10 | 0.04–0.25 | < 0.001 |
| DSM-5 | 1 (2) | 46,374 | 385 | 89.1 (0.002) | (R) 0.89 | 0.70–1.14 | |
| Studies conducted 1980–1989 | 2 (2) | 5100 | 1 | 35.2 (0.214) | (F) 0.01 | 0.00–0.06 | 0.200 |
| Studies conducted 1990–1999 | 3 (3) | 12,615 | 11 | 60.8 (0.078) | (R) 0.06 | 0.03–0.30 | |
| Studies conducted 2000–2009 | 9 (10) | 79,112 | 132 | 96.3 (< 0.001) | (R) 0.13 | 0.03–0.30 | |
| Studies conducted 2010–2017 | 5 (6) | 117,559 | 494 | 99.3 (< 0.001) | (R) 0.42 | 0.09–0.98 | |
| Studies in Western countries | 10 (11) | 99,289 | 609 | 95.2 (< 0.001) | (R) 0.42 | 0.25–0.65 | 0.566 |
| Studies in Asia | 9 (10) | 115,097 | 29 | 70.6 (< 0.001) | (R) 0.02 | 0.01–0.04 | |
| Males | 9 (10) | 46,953 | 48 | 79.9 (< 0.001) | (R) 0.04 | 0.01–0.10 | 0.001 |
| Females | 9 (10) | 49,866 | 508 | 96.6 (< 0.001) | (R) 0.62 | 0.29–1.08 | |
| 12-month prevalence | 13 (14) | 133,013 | 38 | 68.9 (< 0.001) | (R) 0.02 | 0.01–0.04 | – |
| DSM-IV | 10 (10) | 80,107 | 20 | 58.2 (0.001) | (R) 0.02 | 0.01–0.05 | 0.187 |
| DSM-5 | 2 (2) | 46,347 | 18 | 0.0 (0.547) | (F) 0.04 | 0.02–0.06 | |
| Studies conducted 1990–1999 | 3 (3) | 12,615 | 0 | – | – | – | 0.591 |
| Studies conducted 2000–2009 | 6 (6) | 35,873 | 14 | 52.4 (0.062) | (R) 0.03 | 0.01–0.06 | |
| Studies conducted 2010–2017 | 4 (5) | 86,506 | 24 | 77.2 (0.002) | (R) 0.02 | 0.01–0.05 | |
| Studies in Western countries | 9 (10) | 95,891 | 33 | 67.0 (0.001) | (R) 0.02 | 0.01–0.04 | 0.309 |
| Studies in Asia | 4 (4) | 39,103 | 5 | 56.9 (0.073) | (R) 0.01 | 0.00–0.05 | |
| Males | 8 (9) | 45,065 | 6 | 0 (0.493) | (F) 0.01 | 0.00–0.02 | 0.029 |
| Females | 8 (9) | 47,203 | 23 | 70.1 (0.001) | (R) 0.03 | 0.00–0.06 | |
| 4-week prevalence | 6 (6) | 91, 506 | 10 | 0.0 (0.633) | (F) 0.01 | 0.00–0.02 | – |
Table 5.
Overall and subgroup prevalence of BULIMIA NERVOSA
| Number of studies (number of datasets) | n | Number of cases | I2 (p-value) | Prevalence (%) | 95% CI | p-value | |
|---|---|---|---|---|---|---|---|
| Lifetime prevalence | 19 (20) | 198,102 | 1151 | 98.9 (< 0.001) | (R) 0.63 | 0.33–1.02 | – |
| DSM-IV | 13 (13) | 135,624 | 855 | 99.2 (< 0.001) | (R)0.57 | 0.21–1.12 | 0.221 |
| DSM-5 | 2 (2) | 39,286 | 196 | 99.5 (< 0.001) | (R)1.41 | 0.00–6.30 | |
| Studies conducted 1990–1999 | 3 (3) | 12,615 | 66 | 60.8 (< 0.001) | (R) 0.53 | 0.06–1.49 | 0.476 |
| Studies conducted 2000–2009 | 9 (10) | 100,529 | 617 | 99.0 (< 0.001) | (R) 0.41 | 0.10–0.93 | |
| Studies conducted 2010–2017 | 6 (6) | 82,843 | 445 | 99.3 (< 0.001) | (R) 1.08 | 0.33–2.25 | |
| Studies in Western countries | 13 (13) | 110,715 | 990 | 97.9 (< 0.001) | (R) 1.02 | 0.63–1.49 | < 0.001 |
| Studies in Asia | 6 (7) | 79,635 | 79 | 97.3 (< 0.001) | (R) 0.14 | 0.02–0.36 | |
| Males | 12 (12) | 46,760 | 178 | 95.7 (< 0.001) | (R) 0.38 | 0.15 -0.73 | 0.008 |
| Females | 12 (12) | 49,917 | 596 | 97.0 (< 0.001) | (R) 1.22 | 0.69–1.88 | |
| 12-month prevalence | 13 (13) | 146,373 | 408 | 97.4 (< 0.001) | (R) 0.31 | 0.15–0.53 | – |
| DSM-IV | 11 (11) | 117,896 | 380 | 97.7 (< 0.001) | (R)0.29 | 0.12–0.54 | – |
| DSM-5 | 1 (1) | 36,309 | 44 | – | 0.14 | – | |
| Studies conducted 1990–1999 | 3 (3) | 12,615 | 42 | 96.6 (< 0.001) | (R) 0.29 | 0.00–1.11 | 0.942 |
| Studies conducted 2000–2009 | 6 (6) | 57,290 | 225 | 95 (< 0.001) | (R) 0.28 | 0.10–0.54 | |
| Studies conducted 2010–2017 | 4 (4) | 76,468 | 141 | 98.6 (< 0.001) | (R) 0.41 | 0.10–0.94 | |
| studies in Western countries | 10 (10) | 102,225 | 324 | 94.5 (< 0.001) | (R) 0.33 | 0.19–0.51 | 0.294 |
| Studies in Asia | 3 (3) | 36,396 | 46 | 98.6 (< 0.001) | (R) 0.27 | 0.00–1.20 | |
| Males | 8 (8) | 40,488 | 52 | 90.0 (< 0.001) | (R) 0.09 | 0.02–0.22 | 0.113 |
| Females | 8 (8) | 42,741 | 168 | 94.5 (< 0.001) | (R) 0.29 | 0.10–0.57 | |
| 4-week prevalence | 5 (5) | 53,064 | 30 | 94.8 (< 0.001) | (R) 0.07 | 0.00–0.23 | — |
Table 6.
Overall and subgroup prevalence of BING EATING DISORDER
| Number of studies (number of datasets) | n | Number of cases | I2 (p-value) | Prevalence (%) | 95% CI | p-value | |
|---|---|---|---|---|---|---|---|
| BING EATING DISORDER | |||||||
| Lifetime prevalence | 11 (12) | 151,320 | 2284 | 98.8 (< 0.001) | (R) 1.53 | 1.00–2.17 | – |
| DSM-IV | 9 (9) | 89,216 | 1495 | 98.9 (< 0.001) | (R) 1.72 | 0.97–2.67 | 0.725 |
| DSM-5 | 3 (3) | 62,104 | 789 | 98.7 (< 0.001) | (R) 1.04 | 0.39–2.01 | |
| Studies conducted 2000–2009 | 6 (6) | 54,800 | 930 | 99.3 (< 0.001) | (R) 1.58 | 0.52–3.19 | 0.611 |
| Studies conducted 2010–2017 | 5 (6) | 96,520 | 1354 | 97.6 (< 0.001) | (R) 1.48 | 1.00–2.06 | |
| Studies in Western countries | 9 (10) | 131,601 | 2048 | 96.8 (< 0.001) | (R) 1.57 | 0.82–2.55 | 0.358 |
| Studies in Asia | 2 (2) | 11,967 | 63 | 99.5 (< 0.001) | (R) 0.80 | 0.00–6.86 | |
| Males | 9 (10) | 54,720 | 481 | 96.1 (< 0.001) | (R) 1.17 | 0.73–1.73 | 0.037 |
| Females | 9 (10) | 62,490 | 1357 | 94.2 (< 0.001) | (R) 2.42 | 1.91–2.99 | |
| 12-month prevalence | 8 (9) | 136,702 | 1250 | 96.5 (< 0.001) | (R) 0.93 | 0.66–1.24 | – |
| DSM-IV | 7 (7) | 77,996 | 740 | 86.6 (< 0.001) | (R) 0.93 | 0.74–1.14 | 0.863 |
| DSM-5 | 2 (2) | 58,706 | 510 | 99.4 (< 0.001) | (R) 0.92 | 0.16–2.27 | |
| Studies conducted 2000–2009 | 4 (4) | 43,580 | 403 | 83.2 (< 0.001) | (R) 0.95 | 0.71–1.22 | 0.690 |
| Studies conducted 2010–2017 | 4 (5) | 93,122 | 847 | 98.1 (< 0.001) | (R) 0.90 | 0.49–1.44 | |
| Studies in Western countries | 7 (8) | 126,969 | 1177 | 96.9 (< 0.001) | (R) 0.93 | 0.64–1.26 | – |
| Studies in Asia | 1 | 1981 | 20 | – | 1.00 | – | |
| Males | 6 (7) | 51,871 | 276 | 94.0 (< 0.001) | (R) 0.51 | 0.28–0.82 | < 0.001 |
| Females | 6 (7) | 58,726 | 761 | 94.9 (< 0.001) | (R) 0.93 | 0.89–1.73 |
Three studies involved the 3-month prevalence of AN, BN and BED, all conducted in Australia by Hay et al., with DSM-5 as the diagnostic criteria used. The 3-month prevalence rates of AN were 0.46% during 2008–2009 and 0 in both 2014 and 2015. The 3-month prevalence of BN was 0.99% based on pooled data of 4 groups from the 3 studies. The 3-month prevalence of BED was 1.71% based on pooled data from 3 studies.
The 3-month prevalence of OSFED and UFED was seen only in the report conducted by Hay et al. The 3-month prevalence rates of OSFED were 0 in 2014 and 3.2% in 2015. The 3-month prevalence of UFED was 2.2% based on the pooled data from the 2 studies.
Sensitivity analysis of the main results was conducted, and no study with a significant change in heterogeneity was found.
Subgroup analysis
Diagnostic criteria
Subgroup analysis using the diagnostic criteria of DSM-5 and DSM-IV was added in this report. No study involving EDs used DSM-5 diagnostic criteria. The pooled lifetime prevalence of AN using DSM-5 was 0.89%, which was 8.9 times that using DSM-IV (p < 0.001); the pooled 12-month prevalence was 2 times that using DSM-5 than that using DSM-IV. For BN, the pooled lifetime prevalence using DSM-5 was 1.41%, which was 2.5 times that using DSM-IV. However, for BED, the lifetime and 12-month prevalence rates diagnosed by DSM-5 were slightly lower than those diagnosed by DSM-IV, but the differences were not statistically significant.
Years of study
The lifetime prevalence rates of EDs in the 1990s, 2000s and 2010s were 0.91%, 2.0% and 0.71%, respectively, while the 12-month prevalence rates were 0.36%, 0.68% and 0.26%, respectively. The highest prevalence was in the 2000s for both conditions, with a lower prevalence in the 2010s. The lifetime prevalence rates of AN in the 1980s, 1990s, 2000s and 2010s were 0.01%, 0.06%, 0.13% and 0.42%, respectively, with an upward trend. The lifetime prevalence rates of BN in the 1990s, 2000s and 2010s were 0.53%, 0.41% and 1.08%, respectively, and the 12-month prevalence rates were 0.29%, 0.28% and 0.41%, respectively. The lifetime prevalence rates of BED in the 2000s and the 2010s were 1.58% and 1.48%, respectively, and the 12-month prevalence rates were 0.95% and 0.90%; the prevalence rates in the 2010s were both lower than those in the 2000s for both conditions (shown in Fig. 4).
Fig. 4.

The lifetime prevalence of eating disorders over time
Geographic region
We used the same method for comparing Western and Asian countries as in a previous report. The lifetime and 12-month prevalence rates of EDs in Western countries were 1.89% and 0.68%, respectively, both over 8.5 times those in Asian countries (p < 0.01). The lifetime prevalence of AN in Western countries was 21 times that in Asian countries, 7.3-fold for BN and 2-fold for BED. The 12-month prevalence rates were 2-fold and 1.2-fold higher in Western countries than in Asian countries for AN and BN, respectively. The prevalence in Western countries was significantly higher than that in Asia for any type of eating disorder. Furthermore, the pooled lifetime prevalence rates of AN were subdivided by region of South Korea, China, Western Europe and America, with results of 0.01%, 0.02%, 0.47% and 0.52%, respectively (shown in Fig. 5).
Fig. 5.
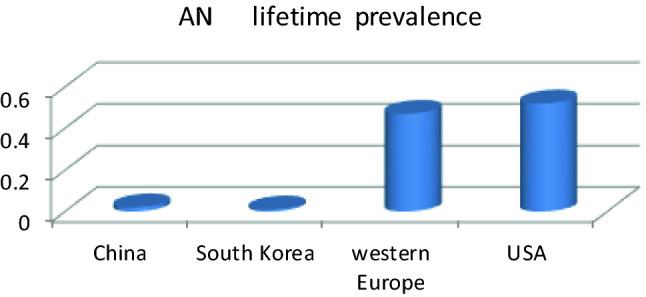
The lifetime prevalence of AN in different countries or regions
Sex
The lifetime prevalence rates of eating disorders in females reached 2.58% (95% CI, 1.06–4.74) and 0.74% (95% CI, 0.24–1.52) in males. Regardless of overall eating disorders or various types, the prevalence in females was evidently several times that in males. The lifetime eating disorder prevalence rates at 12 months and 4 weeks in females were 3.5, 4.2 and 3.1 times those in males, respectively. The ratios of females to males in the lifetime prevalence of AN, BN and BED were 15.5, 3.2 and 2.1, respectively, and 3, 3.2 and 1.8 in the 12-month prevalence. Compared with the classic types AN and BN, the ratio was lower for BED.
Discussion
Main finding
This study updated the prevalence of eating disorders in the general population before 2021, and analyzed the different conditions included among eating disorders to obtain closer-to-real-level prevalence data. The differences in sex, region, decades and diagnostic criteria were analyzed.
After this update, the pooled lifetime and 12-month prevalence rates of eating disorders were 0.9% and 0.43%, respectively. However, the pooled lifetime and 12-month prevalence rates of ED (any), the subgroup of which covers all types of eating disorders, were 1.69% and 0.72%, respectively, both over 1.5 times those of the eating disorders among all 12 groups of data. Many studies on the prevalence of eating disorders included only the 2 classic types, AN and BN, whereas their prevalence rates were comparatively lower among various types. This reflected the situation in which the prevalence of eating disorders in the general population was underestimated. Another factor that needs to be considered is that the 4 studies of EDs (any) all come from Western high-income countries (Germany, the United States and six other European countries).
The lifetime prevalence rates of AN, BN and BED were 0.16%, 0.63% and 1.53%, respectively, which were all lower than the results in a previous report from 2013. This may be related to the fact that only three studies were from South Korea, the only Asian country included in the previous report, whereas a large number of Asian country studies, especially China, were included in this report.
To date, few studies have used DSM-5 to study the prevalence of eating disorders. Thus, studies that use DSM-5 diagnostic criteria to conduct comprehensive investigations of all types of eating disorders are still lacking. The prevalence of AN using the diagnostic criteria of DSM-5 was much higher than that using DSM-IV, in accord with other study results [19, 20, 43]. This was also in line with the fact that the standards of AN experienced the greatest alteration in DSM-5 diagnostic criteria. For BN, the lifetime prevalence using DSM-5 was higher than that using DSM-IV, in accord with others studied by Lindvall Dahlgren [43] and Flament [19], which could be because the frequency of the diagnosis was reduced. However, Mancuso [20] showed that the prevalence of BN was not different using the two diagnostic criteria and used only self-report questionnaires for diagnosis in adolescents. For BED, although the standards of the frequency of binge eating were relaxed in DSM-5, there was no obvious evidence that the prevalence using DSM-5 was higher than that using DSM-IV. Thus, the conclusions in other studies were in discordance. Lindvall Dahlgren [43] reported that there had been early evidence indicating a higher prevalence of BED using DSM-5. Flament [19] found that the prevalence of BED had no change in juveniles. More research using DSM-5 is needed for comparison in the future.
Except for AN, the prevalence of other types of EDs did not significantly increase with time until the 2010s. The prevalence of EDs in the 2000s showed an increase compared with that in the 1990s, which was in accordance with Mitchison's [44] and Hay's [11] studies on the prevalence trends of eating disorders. However, the prevalence declined instead of growing in the 2010s. Nevertheless, more studies need to be included, as only 2 studies were included after 2010 [12, 17]. The upward trend in AN and the slight downward trend in BN were in line with most other studies [4, 45, 46], but studies of new types of eating disorders are still lacking.
In terms of the distributions of geographic region and sex, the results in this report were consistent with those of a previous study by the authors and others, in which the prevalence rates in Western countries and in females were higher. The lifetime prevalence rates were up to 2.58% in females and 1.89% in Western countries, higher than the prevalence rates of schizophrenia and other mental illnesses. The real prevalence rates in Western countries and in females might be even higher due to underestimation, as mentioned above. Although the prevalence was higher in females, male patients showed a slightly higher proportion of BED than of the classic types AN and BN, consistent with the results of Smink's study [4].
Strengths and limitations
There have been few reviews about the prevalence rates of eating disorders in the general population. Of the 15 studies included in our former meta-analysis, only 3 studies of one country (South Korea) were from Asia. However, 8 Chinese studies, accounting for 50% of all newly included studies, were included in this report. As the specific contents of eating disorders varied greatly in different studies, subgroup analysis was conducted based on the specific contents, which might provide more authentic data. The number of studies was more than double, and most of the main results were calculated based on more than 10 studies, with publication bias assessed by the funnel chart method, which essentially resolved the limitations of previous reports.
However, the number of studies on the prevalence of eating disorders is still small, concentrated in Europe, America, Australia, New Zealand and a few Asian countries, such as China and South Korea. Studies from other countries were not retrieved, probably due to language limitations, and the distribution of geographic regions cannot be analyzed in a larger scope. The number of studies using DSM-5 was small, with no study covering all types of eating disorders found in DMS-5. Likewise, those of AN, BN and other types were also very small; thus, it is impossible to conduct a comprehensive analysis on the impact of the new diagnostic criteria on the prevalence of eating disorders.
Conclusion
The prevalence of eating disorders may be underestimated thus far. A large number of previous epidemic studies did not include all types of eating disorders, whereas the prevalence in new types was apparently higher. The prevalence of eating disorders was high, especially in Western countries and in females. In addition, we should pay more attention to new types of eating disorders in males. In future epidemic investigations, new diagnostic criteria should be used more often to comprehensively evaluate all types of eating disorders.
Supplementary information
What is already known on this subject?
Only one systematic review on the prevalence of EDs in general population which was done by us in 2013. There have been some epidemiological studies of EDs in recent years with mixed results.
What this study adds?
The prevalence of eating disorders might be underestimated. Not all types of EDs were included in epidemiological surveys. New diagnostic criteria shall be used more to access EDs comprehensively.
Author contributions
JQ, YW, CBL and DHY conceived and designed the study; JQ, YW and YMW conducted data search, data extraction and data election. JQ, YW and FXL performed statistical analyses and wrote the manuscript; YKZ, HJ and HMZ help to revise the manuscript; CBL and DHY help to strengthen the manuscript; all authors have read and approved the final manuscript.
Funding
This study was funded by the Shanghai Leading Talents Program (YDH-20170627) and the Project of Shanghai Municipal Health Committee (20194Y0027).
Availability of data and material
All data generated or analyzed during this study are included in this published article (and its supplementary information files).
Declarations
Conflict of interest
Authors declare no conflict of interest related to this article.
Ethical approval
This article does not contain any studies with human participants or animals.
Informed consent
As this study is a systematic review, formal consent is not required.
Footnotes
Publisher's Note
Springer Nature remains neutral with regard to jurisdictional claims in published maps and institutional affiliations.
Jie Qian and Ying Wu contributed equally to this work.
References
- 1.Hay P, Mitchison D, Collado AEL, González-Chica DA, Stocks N, Touyz S. Burden and health-related quality of life of eating disorders, including Avoidant/Restrictive Food Intake Disorder (ARFID), in the Australian population. J Eat Disord. 2017;5(1):21. doi: 10.1186/s40337-017-0149-z. [DOI] [PMC free article] [PubMed] [Google Scholar]
- 2.Pohjolainen V, Koponen S, Rsnen P, Roine RP, Sintonen H, Karlsson H. Long-term health-related quality of life in eating disorders. Qual Life Res. 2016;25(9):2341–2346. doi: 10.1007/s11136-016-1250-5. [DOI] [PubMed] [Google Scholar]
- 3.Keski-Rahkonen A, Mustelin L. Epidemiology of eating disorders in Europe: prevalence, incidence, comorbidity, course, consequences, and risk factors. CurrOpin Psychiatry. 2016;29(6):340–345. doi: 10.1097/YCO.0000000000000278. [DOI] [PubMed] [Google Scholar]
- 4.Smink FR, van Hoeken D, Hoek HW. Epidemiology of eating disorders: incidence, prevalence and mortality rates. Curr Psychiatry Rep. 2012;14(4):406–414. doi: 10.1007/s11920-012-0282-y. [DOI] [PMC free article] [PubMed] [Google Scholar]
- 5.陈珏. 进食障碍诊疗新进展及其对全科医生的启示. 中国全科医学. (2019)
- 6.Association AP (2009) Diagnostic and statistical manual of mental disorders, Fourth Edition (DSM-IV). Am Psych Ass 2009:42
- 7.Thomas JJ, Vartanian LR, Brownell KD. The relationship between eating disorder not otherwise specified (EDNOS) and officially recognized eating disorders: meta-analysis and implications for DSM. Psychol Bull. 2009;135(3):407–433. doi: 10.1037/a0015326. [DOI] [PMC free article] [PubMed] [Google Scholar]
- 8.Organization AP (2013) Diagnostic and statistical manual of mental disorders (5th ed.). American Psychiatric Association, Hoboken
- 9.Makino M, Tsuboi K, Dennerstein L. Prevalence of eating disorders: a comparison of Western and non-Western countries. MedGenMed. 2004;6(3):49. [PMC free article] [PubMed] [Google Scholar]
- 10.Hoek A, Wijbrand H. Incidence, prevalence and mortality of anorexia nervosa and other eating disorders. CurrOpin Psychiatry. 2006;19(4):389–394. doi: 10.1097/01.yco.0000228759.95237.78. [DOI] [PubMed] [Google Scholar]
- 11.Hay PJ, Mond J, Buttner P, Darby A. Eating disorder behaviors are increasing: findings from two sequential community surveys in South Australia. PLoS ONE. 2008;3(2):e1541–e1541. doi: 10.1371/journal.pone.0001541. [DOI] [PMC free article] [PubMed] [Google Scholar]
- 12.石锦娟. 陕西,河南甘肃三省精神障碍流行病学调查及对比分析. 第四军医大学; (2015)
- 13.Duncan AE, Ziobrowski HN, Nicol G. The prevalence of past 12-month and lifetime DSM-IV eating disorders by BMI category in US men and women. Eur Eat Disord Rev. 2017;25(3):165–171. doi: 10.1002/erv.2503. [DOI] [PubMed] [Google Scholar]
- 14.Qian J, Hu Q, Wan Y, Li T, Yu D. Prevalence of eating disorders in the general population: a systematic review. Shanghai Arch Psychiatry. 2013;25(4):212–223. doi: 10.3969/j.issn.1002-0829.2013.04.003. [DOI] [PMC free article] [PubMed] [Google Scholar]
- 15.Altwaijri YA, Al-Subaie AS, Al-Habeeb A, et al. Lifetime prevalence and age-of-onset distributions of mental disorders in the Saudi National Mental Health Survey. Int J Methods Psychiatr Res. 2020;29(3):e1836. doi: 10.1002/mpr.1836. [DOI] [PMC free article] [PubMed] [Google Scholar]
- 16.Altwaijri YA, Al-Habeeb A, Al-Subaie AS, et al. Twelve-month prevalence and severity of mental disorders in the Saudi National Mental Health Survey. Int J Methods Psychiatr Res. 2020;29(3):e1831. doi: 10.1002/mpr.1831. [DOI] [PMC free article] [PubMed] [Google Scholar]
- 17.Mohler-Kuo M, Schnyder U, Dermota P, Wei W, Milos G. The prevalence, correlates, and help-seeking of eating disorders in Switzerland. Psychol Med. 2016;46(13):2749–2758. doi: 10.1017/S0033291716001136. [DOI] [PubMed] [Google Scholar]
- 18.Cossrow N, Pawaskar M, Witt EA, Ming EE, Erder MH. Estimating the prevalence of binge eating disorder in a community sample from the united states: comparing DSM-IV-TR and DSM-5 criteria. J Clin Psychiatry. 2016;77:8. doi: 10.4088/JCP.15m10059. [DOI] [PubMed] [Google Scholar]
- 19.Flament MF, Buchholz A, Henderson K, et al. Comparative distribution and validity of DSM-IV and DSM-5 diagnoses of eating disorders in adolescents from the community. Eur Eat Disord Rev. 2015;23(2):100–110. doi: 10.1002/erv.2339. [DOI] [PubMed] [Google Scholar]
- 20.Mancuso SG, Newton JR, Bosanac P, Rossell SL, Nesci JB, Castle DJ. Classification of eating disorders: comparison of relative prevalence rates using DSM-IV and DSM-5 criteria. Br J Psychiatry. 2015;206(6):519–520. doi: 10.1192/bjp.bp.113.143461. [DOI] [PubMed] [Google Scholar]
- 21.Choi M, Lee DW, Cho MJ, Park JE, Gim M. Disease network of mental disorders in Korea. Soc Psychiatry PsychiatrEpidemiol. 2015;50(12):1905–1914. doi: 10.1007/s00127-015-1106-2. [DOI] [PubMed] [Google Scholar]
- 22.Carta MG, Preti A, Moro MF, et al. Eating disorders as a public health issue: prevalence and attributable impairment of quality of life in an Italian community sample. Int Rev Psychiatry. 2014;26(4):486–492. doi: 10.3109/09540261.2014.927753. [DOI] [PubMed] [Google Scholar]
- 23.刘军. 郑州市15岁及以上人群精神障碍流行病学调查, 郑州大学; (2012)
- 24.郁俊昌. 广州地区城乡居民精神疾病流行病学调查, 广州医学院; (2010)
- 25.Udo T, Grilo CM. Prevalence and Correlates of DSM-5–Defined Eating Disorders in a Nationally Representative Sample of U.S. Adults. Biological Psychiatry. 2018;84(5):345–354. [DOI] [PMC free article] [PubMed]
- 26.Hay P, Girosi F, Mond J. Prevalence and sociodemographic correlates of DSM-5 eating disorders in the Australian population. J Eat Disord. 2015;3:1. doi: 10.1186/s40337-015-0037-3. [DOI] [PMC free article] [PubMed] [Google Scholar]
- 27.Keqing L, Ze C, Lijun C, et al. Epidemiological survey of mental disorders in the people aged 18 and older in Hebei Province. Asian J Psychiatr. 2008;1(2):51–55. doi: 10.1016/j.ajp.2008.09.010. [DOI] [PubMed] [Google Scholar]
- 28.方向, 陈元生, 陈旭先, et al (2011) 福建省精神障碍流行病学调查. 中华精神科杂志. 44(2):103–107
- 29.王哲, 孟宪锋, 任金涛, et al (2017) 辽宁省成人精神障碍流行病学调查. 中国公共卫生. (33):1684
- 30.石其昌, 张滢, 俞敏, et al (2005) 浙江省15岁及以上人群精神疾病流行病学调查. 中华预防医学杂志. 39(004):229–236
- 31.Huang Y, Wang Y, Wang H, et al. Prevalence of mental disorders in China: a cross-sectional epidemiological study. Lancet Psychiatry. 2019;6(3):211–224. doi: 10.1016/S2215-0366(18)30511-X. [DOI] [PubMed] [Google Scholar]
- 32.Swanson SA, Saito N, Borges G, et al. Change in binge eating and binge eating disorder associated with migration from Mexico to the US. J Psychiatr Res. 2012;46(1):31–37. doi: 10.1016/j.jpsychires.2011.10.008. [DOI] [PMC free article] [PubMed] [Google Scholar]
- 33.Andrade L, Walters EE, Gentil V, Laurenti R. Prevalence of ICD-10 mental disorders in a catchment area in the city of So Paulo, Brazil. Soc Psychiatry Psychiatric Epidemiol. 2002;37(7):316–325. doi: 10.1007/s00127-002-0551-x. [DOI] [PubMed] [Google Scholar]
- 34.Kessler RC, et al. The prevalence and correlates of Binge Eating Disorder in the World Health Organization World Mental Health Surveys. Biol Psychiatry N Y. 2013;73:904–913. doi: 10.1016/j.biopsych.2012.11.020. [DOI] [PMC free article] [PubMed] [Google Scholar]
- 35.Meyer C, Rumpf HJ, Hapke U, John U. Prevalence of DSM-IV psychiatric disorders including nicotine dependence in the general population: results from the Northern German TACOS study. Neurol Psychiatry Brain Res. 2001;9(2):75–80. [Google Scholar]
- 36.A Preti, G Vilagut, J Alonso, R. de Graaf, R. Bruffaerts, K. Demyttenaere, A. Pinto-Meza, J.M. Haro, P. Morosini, ESEMeD-WMH Investigators (2009) The epidemiology of eating disorders in six European countries: results of the ESEMeD-WMH project. J Psychiatric Res 14:43 [DOI] [PubMed]
- 37.Jacobi F, Wittchen HU, Holting C, et al. Prevalence, co-morbidity and correlates of mental disorders in the general population: results from the German Health Interview and Examination Survey (GHS) Psychol Med. 2004;34(4):597–611. doi: 10.1017/S0033291703001399. [DOI] [PubMed] [Google Scholar]
- 38.Wells JE, Browne MA, Scott KM, McGee MA, Baxter J, Kokaua J. Prevalence, interference with life and severity of 12 month DSM-IV disorders in Te Rau Hinengaro: the New Zealand Mental Health Survey. Aust N Z J Psychiatry. 2006;40(10):845–854. doi: 10.1080/j.1440-1614.2006.01903.x. [DOI] [PubMed] [Google Scholar]
- 39.Bijl RV, Ravelli A, van Zessen G. Prevalence of psychiatric disorder in the general population: results of The Netherlands Mental Health Survey and Incidence Study (NEMESIS) Soc Psychiatry PsychiatrEpidemiol. 1998;33(12):587–595. doi: 10.1007/s001270050098. [DOI] [PubMed] [Google Scholar]
- 40.Cho MJ, Kim JK, Jeon HJ, et al. Lifetime and 12-month prevalence of DSM-IV psychiatric disorders among Korean adults. J NervMent Dis. 2007;195(3):203–210. doi: 10.1097/01.nmd.0000243826.40732.45. [DOI] [PubMed] [Google Scholar]
- 41.Kringlen ETS, Cramer V. A Norwegian psychiatric epidemiological study. Am J Psychiatry. 2001;158(7):1091–1098. doi: 10.1176/appi.ajp.158.7.1091. [DOI] [PubMed] [Google Scholar]
- 42.Roca-Bennasar M, Gili-Planas M, Ferrer-Pérez V, Bernardo-Arroyo M. Mental disorders and medical conditions. A community study in a small island in Spain. J Psychosom Res. 2001;50(1):39–44. doi: 10.1016/S0022-3999(00)00215-4. [DOI] [PubMed] [Google Scholar]
- 43.Lindvall-Dahlgren C, Wisting L, Ro Y. Feeding and eating disorders in the DSM-5 era: a systematic review of prevalence rates in non-clinical male and female samples. J Eat Disord. 2017;5(1):56. doi: 10.1186/s40337-017-0186-7. [DOI] [PMC free article] [PubMed] [Google Scholar]
- 44.Mitchison D, Hay P, Slewa-Younan S, Mond J. Time trends in population prevalence of eating disorder behaviors and their relationship to quality of life. PLoS ONE. 2012;7(11):e48450. doi: 10.1371/journal.pone.0048450. [DOI] [PMC free article] [PubMed] [Google Scholar]
- 45.Steinhausen HC, Jensen CM. Time trends in lifetime incidence rates of first-time diagnosed anorexia nervosa and bulimia nervosa across 16 years in a Danish nationwide psychiatric registry study. Int J Eat Disord. 2015;48(7):845–850. doi: 10.1002/eat.22402. [DOI] [PubMed] [Google Scholar]
- 46.Keel PK, Heatherton TF, Dorer DJ, Joiner TE, Zalta AK. Point prevalence of bulimia nervosa in 1982, 1992, and 2002. Psychol Med. 2006;36(1):119–127. doi: 10.1017/S0033291705006148. [DOI] [PubMed] [Google Scholar]
Associated Data
This section collects any data citations, data availability statements, or supplementary materials included in this article.
Data Availability Statement
All data generated or analyzed during this study are included in this published article (and its supplementary information files).