

Abstract
Irinotecan (IRI), a topoisomerase I inhibitor blocking DNA synthesis, is a widely used chemotherapy drug for metastatic colorectal cancer. Despite being an effective chemotherapy drug, its clinical effectiveness is limited by both intrinsic and acquired drug resistance. Previous studies indicate IRI induces cancer stemness in irinotecan-resistant (IRI-resistant) cells. Metformin, an oral antidiabetic drug, was recently reported for anticancer effects, likely due to its selective killing of cancer stem cells (CSCs). Given IRI-resistant cells exhibiting high cancer stemness, we hypothesize metformin can sensitize IRI-resistant cells and rescue the therapeutic effect. In this work, we utilized the Single-probe mass spectrometry technique to analyze live IRI-resistant cells under different treatment conditions. We discovered that metformin treatment was associated with the downregulation of lipids and fatty acids, potentially through the inhibition of fatty acid synthase (FASN). Importantly, certain species can be only detected from cells in their living status. The level of synergistic effect of metformin and IRI in their co-treatment of IRI-resistant cells was evaluated using Chou-Talalay combinational index. Using enzymatic activity assay, we determined that the co-treatment exhibit the highest FASN inhibition compared with the mono-treatment of IRI or metformin. To our knowledge, this is the first single-cell MS metabolomics study demonstrating metformin-IRI synergistic effect overcoming drug resistance in IRI-resistant cells.
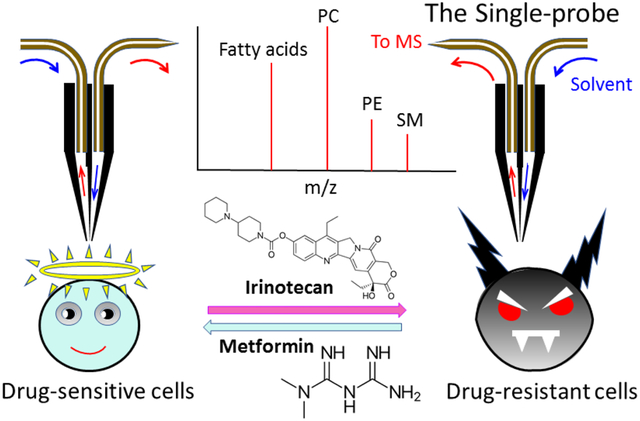
Graphical Abstract
Introduction
Drug resistance, classified as intrinsic resistance (pre-existent) and acquired resistance (induced by drug), occurs in almost all cancer patients in chemotherapy, decreasing the therapeutic effect of the treatment.[1] Acquired drug resistance is one of the major challenges of treating metastatic colorectal cancer (mCRC) patients. Among all cancers, colorectal cancer is the third most common cancer diagnosed and the fourth leading cause of cancer death worldwide.[2] GLOBOCAN estimates colorectal cancer accounted for 6.1% of all cancer incidence and 9.2% of all cancer deaths in 2018.[3] It is estimated approximately 60% of patients will ultimately develop into mCRC,[4] whereas more than 30% of patients were first diagnosed with mCRC in their early stages without showing any symptoms.[4]
Irinotecan (IRI) is a widely used chemotherapy drug for the treatment of mCRC. Chemotherapy regimens using IRI (e.g., FOLFIRI and FOLFOXIRI) are standard first-line therapies for mCRC. As an effective chemotherapy drug, IRI containing regimens give an average response rate of 31–65% and overall median survival of 14–31 months.[5–7] However, the effectiveness of IRI treatment suffers from small populations of cancer cells with acquired drug resistance, which is a common reason for treatment failure. Numerous studies have been performed to explain the mechanisms of IRI drug resistance. The proposed theories include drug inactivation by IRI glucuronidation[8], reduced drug accumulation in subcellular localization caused by active drug efflux[9], drug-target interaction reduction by decreased topoisomerase I expression[10], DNA damage minimization by decreasing topo I-DNA interaction[11], and the induction of cancer stem-like cells to escape cytotoxic effect.[12, 13] To gain an insight into the cellular mechanism of IRI resistance in colorectal cancer cells, we studied the changes in metabolites and proteins of IRI-resistant cells, which were derived from colorectal cancer cell line HCT-116 through low-does (1 μM) IRI treatment.[14] Compared with the parental HCT-116 cells, the resistance index () increased from 1.9 to 3.6 after HCT-116 cells were exposed to IRI for 10 and 20 days, respectively.[14] Further studies found the IRI-resistant cells exhibited certain levels of similarities of lipid compositions as cancer stem cells. In addition, we discovered that IRI-resistant cells possess cancer stemness, including the enriched proteins and overexpressed mRNAs of cancer stem cells (CSCs) biomarkers such as CD133, CD24, and ALDH1A1.
Metformin is a classical biguanide antidiabetic drug. Recently, it was reported that the chemotherapy involving metformin showed enhanced anticancer effects,[15] arising from its ability of selectively killing CSCs.[16–18] Metformin exhibits pharmacological activities on CSCs by disrupting their energy metabolism (e.g., glycolysis, TCA cycle, and electron transport chain) to inhibit oxidative phosphorylation and ATP synthesis.[19] Eventually, metformin induces energy crisis to CSCs by preventing cellular metabolism shifting from mitochondrial-dependent metabolism to aerobic glycolysis.[19] In fact, the antitumor capability of metformin was reflected from the decreased expression of CSCs biomarkers, such as CD44, EZH2, Oct4, in cells treated by this compound.[20]
The combined treatment of metformin and IRI in mCRC patients has been previously proposed, and Phase 2 clinical trial of this combination showed improved disease control and better overall survival for patients.[21] However, studies of the combined treatment of IRI-resistant cells have not been performed, and the molecular mechanisms of the synergistic effect remain unclear. Based on the facts that metformin targeting CSCs and IRI-resistant cells exhibiting high cancer stemness, we predict metformin can rescue the therapeutic effect of IRI in IRI-resistant cells.
Metabolites are the end products of cellular activities, and they directly and sensitively reflect the genetic and environmental changes of cells. Cellular metabolomics studies have become an indispensable approach to determining alterations in metabolic pathways induced by environmental stimuli, including physical and chemical changes. Owing to its high sensitivity and accuracy, mass spectrometry (MS) has become a powerful tool for metabolomics studies. MS metabolomics studies have been generally performed using samples prepared from populations of cells. However, this strategy becomes ineffective when analyzing specific types of cells among heterogeneous populations. Tumor heterogeneity in cancer is characterized by the diversity of cancer cells consisting of a broad spectrum of morphologies, gene expression profiles, and functional features.[22, 23] Cancer cell heterogeneity is driven by both intrinsic (e.g., epigenetic mutation) and extrinsic factors (e.g., drug-related stimuli during treatment).[23] Because metabolites have rapid turnover rates, they promptly reflect the status of live cells, and any environment perturbation may affect their native compositions.[24, 25] Thus, traditional HPLC-MS based methods requiring multi-step sample preparation (e.g., cell pellet preparation, cell lysis, and metabolite extraction) cannot accurately reflect intrinsic compositions of metabolites in live cells. An obvious choice to use ambient single cell MS (SCMS) techniques to measure of individual cells in their living status.
A variety of ambient single cell MS (SCMS) techniques have been developed and utilized in numerous studies. Example of these techniques include Live single-cell MS[26], capillary microsampling ESI-IMS-MS[27], patch clamp technique combined nano-ESI-MS[28], nano-DESI single cell MS[29], and laser ablation based single cell MS[30]. In this work, we utilized the Single-probe SCMS technique to study the metabolomic changes of IRI-resistant cells upon metformin treatment and metformin-IRI co-treatment. The Single-probe SCMS technique is a versatile tool that can be used to study cellular metabolism of individual cells and to quantify drug compounds inside live single cells in ambient conditions.[31–35] To further verify the mechanisms of the synergistic effect, enzymatic activity assay of fatty acid synthase (FASN) was performed to compare the inhibition levels of FASN between the mono-treatment (IRI or metformin) and co-treatment (IRI combined with metformin).
Experimental section
Cell culture
The establishment of IRI-resistant cells followed our previously published protocols.[14] Briefly, HCT-116 cells were cultured with 1 μM IRI in McCoy’s 5a Medium (Fisher Scientific Company LLC, IL, USA) supplemented with 10% fetal bovine serum (FBS, GE Healthcare Bio-science Corp, Marlborough, MA, USA) and 1% penicillin streptomycin (Life Technologies Corporation, Grand Island, NY, USA). HCT-116 cells were split when their confluency reached 80%. For the cell passaging, 2 mL trypsin–EDTA (Life Technologies Corporation, Grand Island, NY, USA) was incubated into a petri dish at 37°C for 3 minutes, and then 8 mL cell culture medium was added to quench trypsin enzymatic activity. Sub-culture was performed by pipetting 1 mL cell suspending solution into 9 mL fresh culture medium. IRI-resistant cells were harvested after culturing HCT-116 cells in the culture medium containing 1 μM IRI for 30 days.
The Single-probe SCMS analysis
The Single-probe was fabricated according to the previously established protocols.[33] The Single-probe is composed of three major parts: a nano-ESI emitter, a dual-bore quartz needle, and a fused silica capillary. A dual-bore quartz tubing (O.D. 500 μm; I.D. 127 μm, Friedrich & Dimmock, Millville, NJ) was pulled into needle with a sharp needle (tip size is approximately 10 μm) using a laser micropipette puller (Sutter P-2000, Sutter Instrument, Novato, CA). The Nano-ESI emitter was produced by pulling the fused silica capillary (O.D. 105μm; I.D. 40 μm, Polymicro Technologies, Phoenix, AZ) using a butane micro torch. Fabrication of the Single-probe requires inserting the fused silica capillary and nano-ESI emitter into the dual-bore quartz needle. To conveniently conduct experiment, the Single-probe was attached to a microscope glass slide using epoxy glue. The Single-probe was then attached to an XYZ-stage system coupled to the Thermo LTQ Orbitrap XL mass spectrometer (Thermo Scientific, Waltham, MA) for the SCMS analysis. Acetonitrile (1% formic acid) was used as the solvent for the SCMS experiments. The mass range of the mass spectrometer was set as m/z 150–2000 and m/z 50–800 in the positive and negative ion mode, respectively. Other mass spectrometer parameter settings are mass resolution 60,000, ionization voltage 4.5kV (positive ion mode)/− 4.5kV (negative ion mode), 1 microscan, 100 ms max injection time, and AGC on (target 5E5).
Cell viability analysis
The cell viability measurements of IRI-resistant cells were performed using the MTT (3-(4,5-dimethylthoazol-2-yl)-2,5-diphenyltetrazolium bromide) assay. The assay was conducted according to the previous publication with a few modifications.[36] Briefly, after settling down the IRI-resistant cells (cell density ~ 10,000 cells/well) into 96-well plates, drug treatments were carried out using different concentrations of IRI (1.0, 4.0, 8.0, 16, 64, and 128 μM) combined with metformin (2.0, 4.0, and 8.0 mM). MTT (BIOTIUM Inc., Hayward, CA) was added into each well of 96-well plates, and then absorbance signal at 570 nm and background absorbance at 630 nm were measured using a microplate reader (Synergy H1, BioTek, Winooski, VE). Five replicates were measured for each drug treatment, and the cell viability values are summarized in Fig. 1A. MTT assay was used to measure cell viability of IRI-resistant cells under metformin and IRI mono-treatments, and the IC50 values of these two drugs were determined using Prism (GraphPad Software Inc.).
Fig. 1.
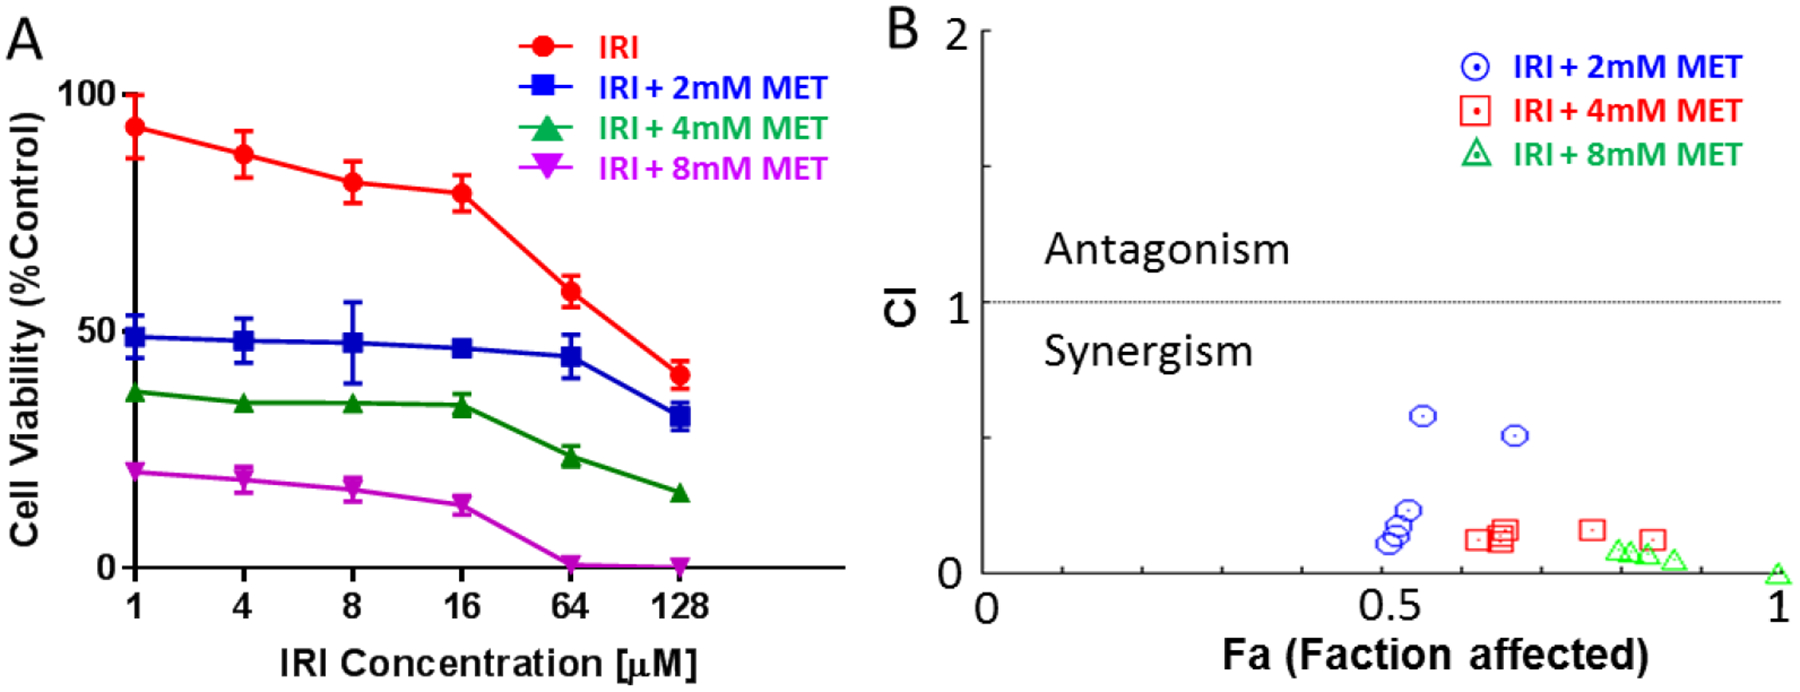
Measurements of cell viability and combinational index (CI). (A) Cell viability plot of IRI-resistant cells treated using combined irinotecan (IRI) and metformin (MET). Cell viabilities in co-treatments are corelative to the measurements from IRI monotreatment. (B) The CI-Fa (faction affected) plot for IRI and metformin in IRI-resistant cell.
Enzymatic activity analysis
There are two major steps in measuring enzymatic activities of IRI-resistant cells in the current studies. First, we extracted enzyme from the IRI-resistant cells. Cells under different treatment conditions were harvested and washed with cold PBS. To obtain the protein fraction, cells were mixed with ice-cold enzyme lysis buffer (20 mM Tris-HCl, pH = 7.5, 1mM dithiothreitol, and 1mM EDTA) and sonicated at 4 °C for 10 min. Cell lysates were centrifuged for 10 min at 100,000g, and the supernatants were collected. Second, we conducted NADPH absorbance assay of the supernatant to measure FASN activity following the published protocols.[37–39] Briefly, the concentrations of cellular proteins in the supernatant were measured using Piece BCA protein assay (Thermo Scientific, Waltham, MA). The supernatant was added in to 96-well plate and diluted by the assay buffer (25 mM K2HPO4-KH2PO4, pH = 7, 250 μM EDTA, and 250 μM dithiothreitol) to reach the final concentration of 100 μg protein/well (with 300 μL total volume). The background oxidation rate of NADPH was obtained from the absorbance (at 340 nm for 3 min) after the addition of 30 μM Acetyl-CoA (Sigma-Aldrich, St. Louis, MO) and 350 μM NADPH (Sigma-Aldrich, St. Louis, MO) into wells. The oxidation reaction of NADPH was then initiated by adding 100 μM Malonyl-CoA (Sigma-Aldrich, St. Louis, MO), and the absorption was monitored (at 340 nm for 10 min). The net oxidation rate of NADPH was then determined from the decreased rate of absorbance with the correction of background oxidation rate. The results were expressed as one enzymatic unit equals the oxidation for 1 nmol NADPH/min/μg. Statistical analysis of enzymatic activities was conducted with one-way ANOVA (analysis of variance) using GraphPad Prism (GraphPad Software Inc.).
HPLC-MS
HPLC-MS analyses of cell lysates were performed to provide complementary information to identify ions of interest. Cell lysates were prepared using the Folch’s extraction method. Briefly, the IRI-resistant cells were suspended into PBS solution after trypsinization, chloroform and methanol (3:1, v/v) were added, and then the mix was vortexed on ice for 10 mins. After separating two layers by centrifuge, the organic layer was transferred and dried under the vacuum. The samples were then stored in −80°C refrigerator prior to HPLC-MS analysis.
An UltiMate 3000 HPLC system (Thermo Scientific, San Jose, CA) was coupled to the LTQ Orbitrap XL mass spectrometer for metabolites separation and MS2 identification. A Luca 3u C18 column (50 × 2.00 mm, 3 μm, Phenomenex, Torrance, CA) was used for chromatographic separation. The settings of HPLC include injection volume: 5 μL; column oven: 50 °C; Flow rate: 350 μl/min; mobile phase A: acetonitrile/water (60/40, v/v); mobile phase B: isopropanol/acetonitrile/water (90/8/2, v/v). Both mobile phases contain 10 mM ammonium formate and 0.1% formic acid. The total run time was 80 mins, including 5 mins’ equilibrium. The MS2 analyses were carried out in data independent mode, and the normalized collision energy (NCE) was set as 24–25 (factory unit) for collision induced dissociation (CID) experiments.
Data analysis
Adopted from our previous studies,[40] a customized R script was used for data preprocessing, including background signals removal (e.g., from solvent and cell culture medium) and normalization of ion intensities to the total ion current (TIC)[40], followed by peak alignment of MS data from all cells using Geena 2.[41] Multivariate analysis, performed using the partial least squares discriminant analysis (PLS-DA) in MetaboAnalyst 4.0,[42] was carried out to compare the overall metabolic profiles of cells in different groups. Levene’s test was conducted, and the results indicated equal variance of the data across samples. Thus, Student’s t-test (in MetaboAnalyst) was applied to obtain metabolites with significantly different abundances in cells from two groups. One-way ANOVA and post-hoc test (Tukey’s test) were performed to reveal the cellular metabolites changes among three groups.[40] To tentatively label ions, we used three different online databases, METLIN[43], HMDB[44] and GNPS[45], to search for potential metabolites (mass error < 5 ppm). The identification of chemical structures of ions of interest was based on the tandem MS (MS2) results.
Results and Discussion
Co-treatment of metformin and IRI exhibited synergistic effect in IRI-resistant cells.
To quantitatively evaluate the enhanced potency of metformin and IRI in the combined treatment of IRI-resistant cells, we measured the combinational treatment effect of these two compounds. Solutions with different final concentrations of IRI (1.0, 4.0, 8.0, 16, 64, and 128 μM) and metformin (2.0, 4.0, and 8.0 mM) were used to measure cell viability using the MTT assay. As shown in Fig. 1A, both IRI and metformin inhibited cell proliferation in a dose-dependent manner. The combination of IRI and metformin resulted in higher death degrees of IRI-resistant cells. To quantitatively evaluate the synergistic effect between IRI and metformin, we calculated the combinational index (CI) values of these two compounds using Chow-Talalay method integrated in CompuSyn software.[46] The degrees of synergetic effect of any two compounds are reflected from the CI values: synergism (CI < 1), additive effect (CI = 1), or antagonism (CI > 1).[46–48] Our measurements show that the CI values for the co-treatment of IRI and metformin are less than 1 (Fig. 1B), indicating the presence of synergistic effects of these two compounds in the treatment of IRI-resistant cells. The relationships between CI values and Fa (i.e., faction affected) are summarized in Fig. 1B. Although all combinational treatments showed synergetic effects, most of them resulted in strong or very strong synergism (Fig. S2C), according to the previously established standard of assessment (i.e., very strong synergism (CI<0.1), strong synergism (0.1<CI<0.3), and synergism (0.3<CI<0.7)).[49]
Metformin treatment resulted in downregulated fatty acids and lipids.
To study the influence of metformin on metabolites in IRI-resistant cells, 8.7 mM metformin, which is its IC50 determined from the MTT assay (Fig. S2A), was utilized to treat IRI-resistant cells followed by the Single-probe SCMS metabolomic analysis in both the positive and negative ion modes. In the comparison studies, the same measurements were conducted using cells without metformin treatment. As reported in our previous studies, the technical variance of the Single-probe SCMS technique (i.e., ion intensity fluctuation due to technical factors during the SCMS experiments) is insignificant compared with the biological variance (i.e., mass spectra difference due to the variation of heterogeneous cellular metabolites).[14] PLS-DA can be utilized to illustrate the within-group cell heterogeneity (i.e., data point distribution of each group) and difference of cells in different groups (i.e., overlap between different groups). In the positive ion mode, significantly different (p = 0.009 from permutation test) metabolic profiles were observed upon metformin treatment (Fig. 2A). Furthermore, we performed the Student’s t-test and found a large number of cellular lipids significantly downregulated by metformin (e.g., Fig. 2B). Similarly, significantly different (p<0.003 from permutation test) metabolic profiles were obtained between these two groups in the negative ion mode (Fig. 2C). A number of fatty acids, including palmitic acid, stearic acid, palmitoleic acid, myristic acid, arachidic acid, and adrenic acid, were significantly downregulated (Fig. 2D).
Fig. 2.
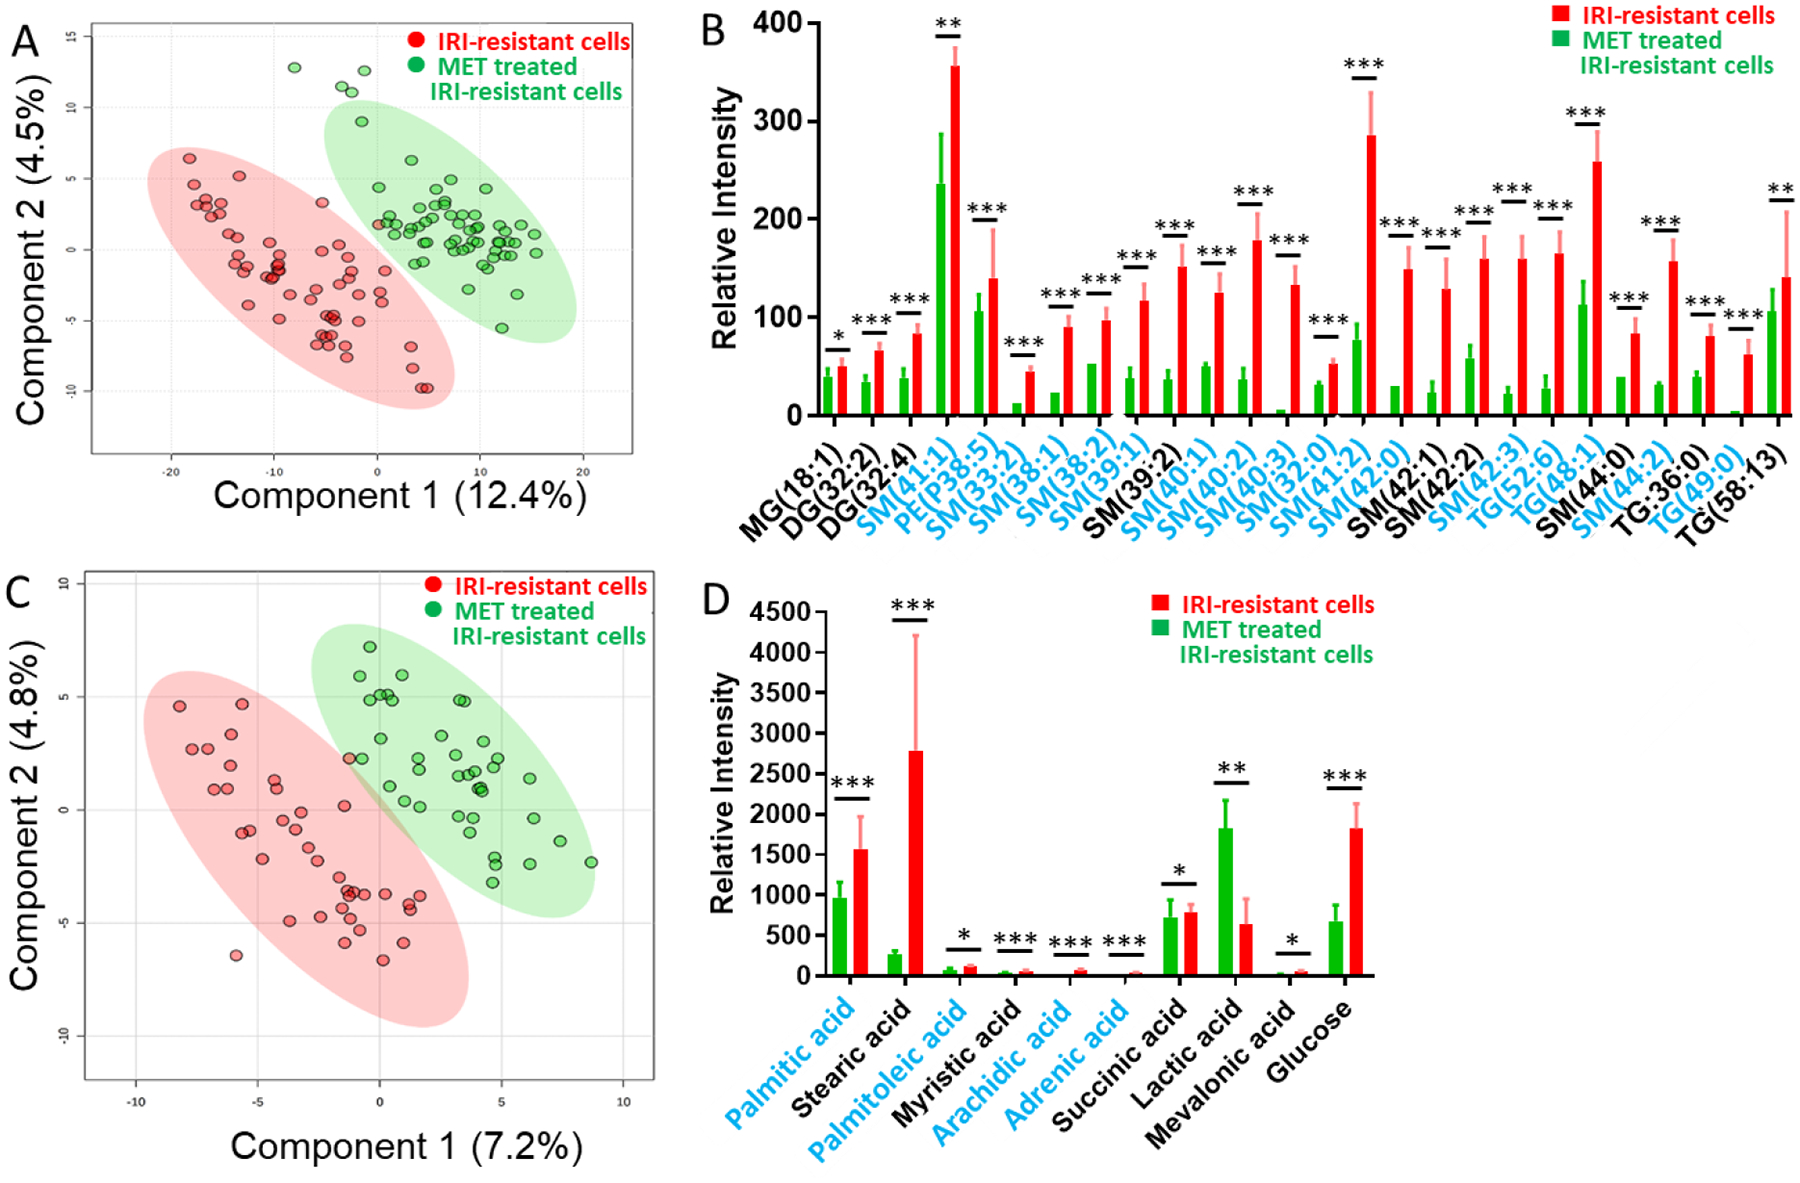
SCMS results revealing the influence of metformin (8.7 mM) mono-treatment on metabolites of IRI-resistant cells. (A) PLS-DA of positive ion mode results shows the metabolomics profiles were significantly changed (p = 0.009 from permutation test), and (B) representative lipids with significant abundance change (p < 0.05 from Student’s t-test). (C) PLS-DA of negative ion mode results shows the metabolomics profiles were significantly changed (p < 0.003 from permutation test), and (D) representative fatty acids with significant abundance change (* p < 0.05, ** p < 0.01, *** p < 0.001 from Student’s t-test). Species labeled in blue font were identified using MS2 analysis both from single cells and cell lysates. (MG: monoglycerides; DG: diglyceride; TG: triglyceride; PI: phosphatidylinositol; PS: Phosphatidylserine; SM: sphingomyelin).
Metformin and IRI co-treatment resulted in downregulated lipids, fatty acids, and ceramide phosphoethanolamine.
To understand the influence of synergistic effect on cell metabolites, the Single-probe SCMS experiments were performed in both the positive and negative ion modes to analyze IRI-resistant cells after mono- and co-treatment. IC50 of IRI (22 μM, Fig. S2B) or metformin (8.7 mM, Fig. S2A) was selected as the monotreatment concentration. In the co-treatment, we selected IRI (0.56 μM) and metformin (4.0 mM) as a representative combination, because a sharply decreased cell viability was observed around these concentrations. In the positive ion mode, significantly different (p < 0.001) metabolic profiles were observed from PLS-DA (Fig. 3A). Furthermore, ANAVO results indicate that metformin-containing treatments, including both the mono- and co-treatment, lead to significant downregulation of lipids in IRI-resistant cells (Fig. 3B). Among all treatment conditions, the co-treatment showed the lowest expression of both polar and nonpolar lipids.
Fig. 3.
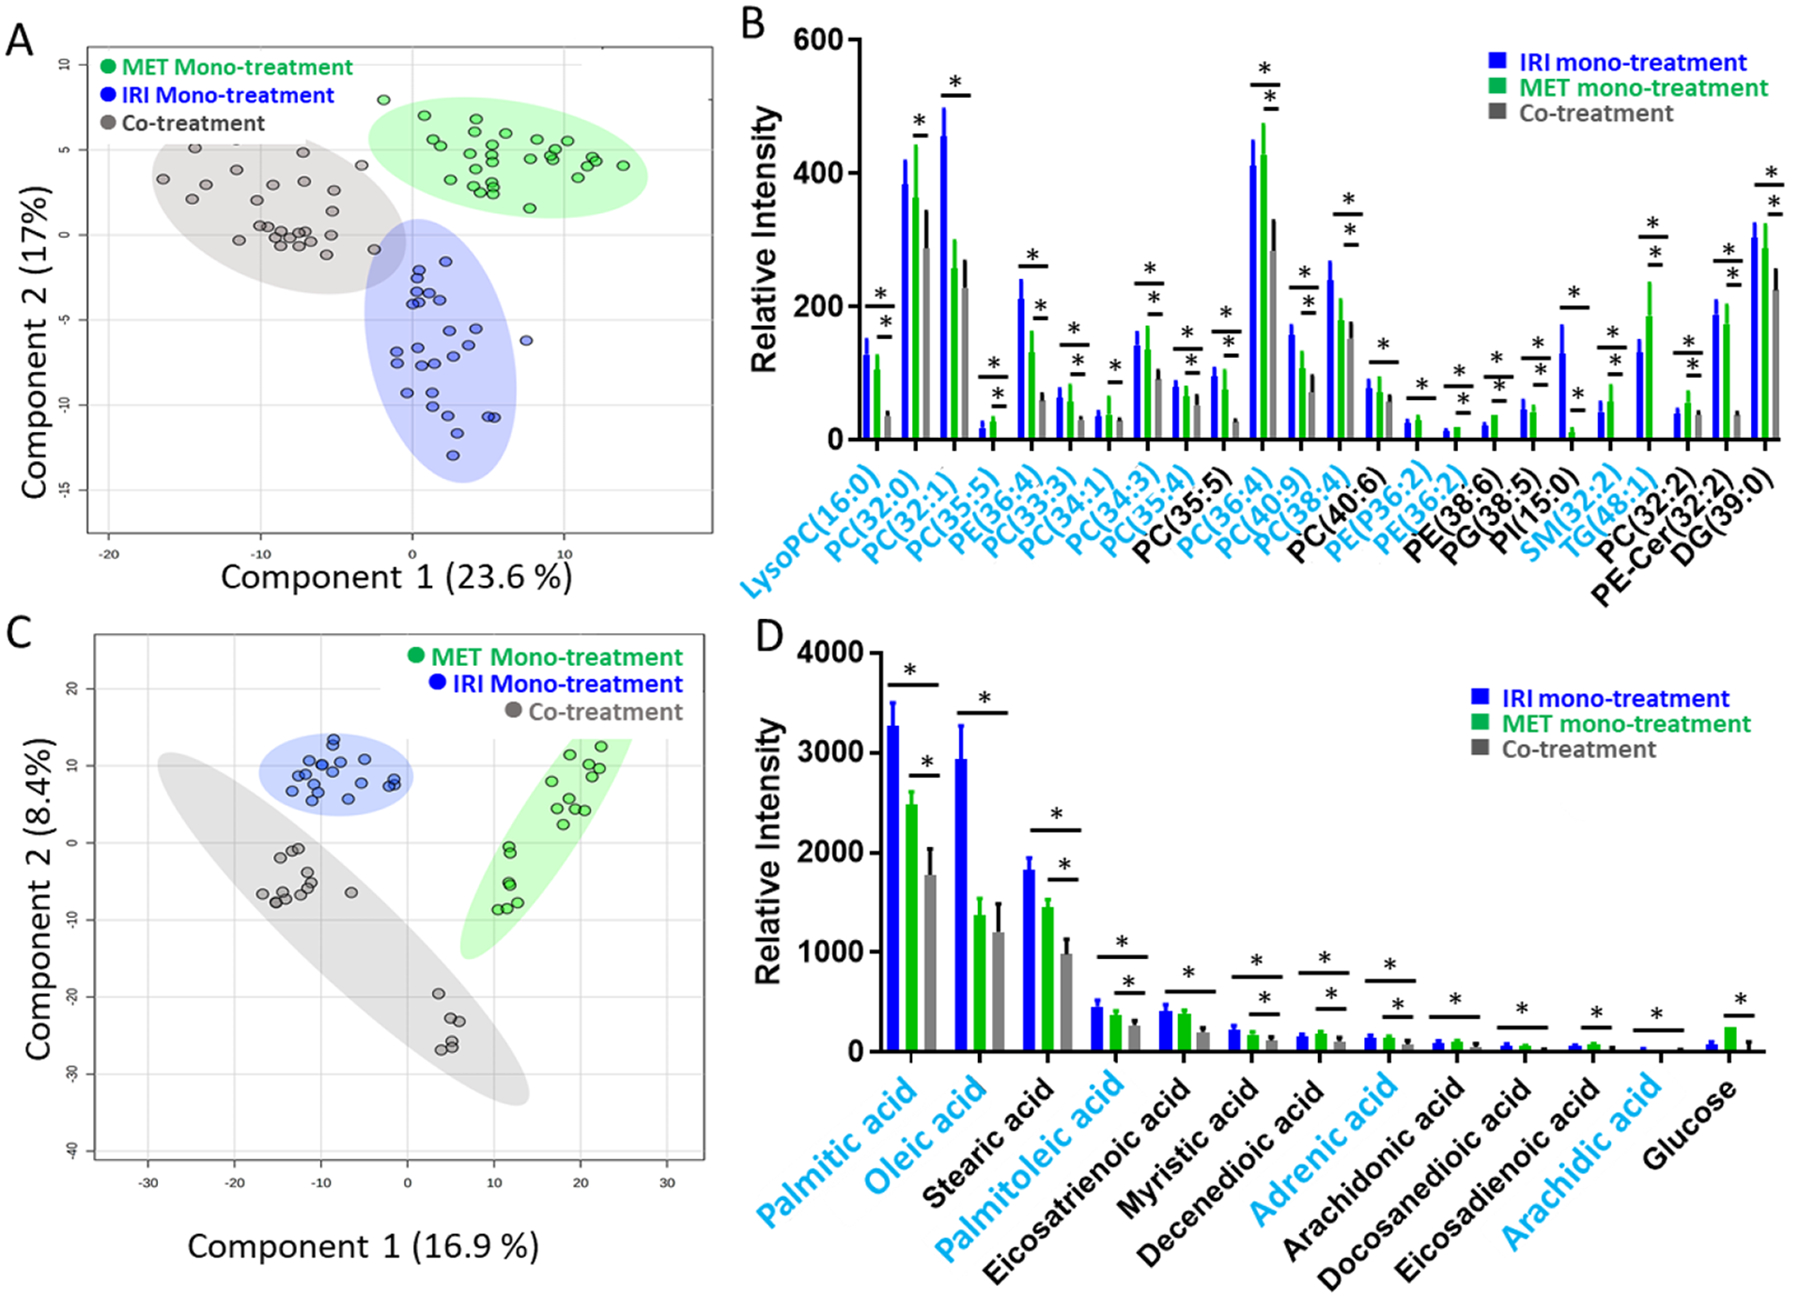
SCMS results of IRI-resistant cells from the co-treatment (0.56 μM IRI + 4.0 mM MET), IRI mono-treatment (22 μM IRI), and metformin mono-treatment (8.7 mM MET). (A) PLS-DA of positive ion mode results shows the metabolomics profiles were significantly changed by three different treatments (p < 0.001 from permutation test), and (B) representative lipids with significant abundance change (* p < 0.05 from both ANOVA and Tukey’s test) among three treatment groups. (C) PLS-DA of negative ion mode results shows metabolomics profiles were significantly changed by three different treatments (p = 0.004 from permutation test), and (D) representative fatty acids with significantly different abundances (* p < 0.05 from both ANOVA and Tukey’s test) among three treatment groups. Species labeled in blue font were identified using MS2 analyses using both single cells and cell lysates. (LysoPC: lysophosphatidylcholine; PC: phosphatidylcholine; PE: phosphatidylethanolamine; PI: phosphatidylinositol; PE-Cer: ceramide phosphoethanolamine; PG: phosphatidylglycerol; DG: diglyceride).
To acquire broader ranges of molecular coverage, we also performed the SCMS measurements in the negative ion mode. Around 30 IRI-resistant cells in the metformin monotreatment, IRI monotreatment, and co-treatment groups were analyzed. PLS-DA results showed significantly distinct (p = 0.004) metabolic features among these three groups (Fig. 3C). Using the combined ANOVA and Tukey’s test, which was demonstrated as a rigorous method to determine metabolite biomarkers in our previous studies[40], we discovered species exhibiting significantly different abundances (i.e., p < 0.05 from both tests) among them. We were able to tentatively label 49 ions based on the accurate mass search the online databases. A number of fatty acids (e.g., palmitic acid, palmitoleic acid, oleic acid, stearic acid, and arachidonic acid) exhibited lower expression levels after metformin mono-treatment compared with those with IRI mono-treatment (Fig. 3D). Particularly, the lowest abundances of fatty acids were found in cells from the co-treatment, and this trend is similar to that of lipids discovered in the positive ion mode (Fig. 3B).
Due to the extremely limited amounts (in picoliter range) and complex compositions of contents in single cells, MS2 analyses at the single-cell level can be only performed for relatively abundant ions. To provide supplementary information for structure identification of lipids, we prepared cell lysates for targeted analysis of ions of interest (i.e., species with significantly different abundances among different groups) using HPLC-MS2 method in the positive ion mode. Because the majority of ions of interest were downregulated in all treatment groups, IRI-resistant cells were used for lysate preparation. The retention time was determined from the full scan mode in the first run (Fig. S5), and then the precursor ions were isolated for the MS2 analysis in the second run. HPLC/MS analyses provided the identification of 9 metabolites that cannot be identified at the single-cell level due to their low abundances. Combining the MS2 mass spectra from single cells and cell lysates, we were able to identify 32 out of 49 tentatively labeled ions as illustrated in Figures 2B and 3B. Importantly, we noticed that 17 ions can only be detected from the SCMS experiments. This likely indicates that these species are fragile or have rapid turnover rate in live cells, and they are potentially lost during the preparation of cell lysate.[40]
Co-treatment of metformin and IRI more efficiently reduced FASN enzymatic activity compared with the mono-treatment.
Our SCMS experimental results indicate that the treatment involving metformin greatly reduced the levels of fatty acids and lipids. It is very likely that these downregulations are related to the inhibition of lipogenic enzymes by metformin. Among all lipogenic enzymes, the overexpressed FASN is generally observed in broad types of cancer cells.[50–52] FASN is a key enzyme controlling de novo fatty acids biosynthesis in cells.[53] FASN utilizes Acetyl-CoA and Malonyl-CoA as the starting materials to synthesize saturated fatty acids through condensation reactions. The major product from FASN is palmitic acid, and the byproducts include saturated fatty acids, which can be further processed to synthesize more functional and complex fatty acids (e.g., unsaturated fatty acids and long-chain fatty acids).[53] De novo lipid synthesis requires fatty acids for the production of glycerophospholipids (e.g., phosphatidylcholine (PC), phosphatidylserine (PS), and phosphatidylinositol (PI)), glycerolipids (e.g., diacylglyceride (DG) and triacylglyceride (TG)), and sphingolipids utilized by cells for energy storage and cellular membrane synthesis.[54] Because FASN synthesizes fatty acids are required for cell divisions, the hyperactivity and overexpression of FASN are tightly related to the malignancy of cancer cells.[55, 56]
Based on our studies of synergetic effect and metabolomics, we hypothesized that metformin inhibits the activities of FASN and further sensitizes IRI-resistant cells to the therapeutic effect of IRI. As one of the most well accepted molecular mechanisms, metformin affects cancer cells by initializing the AMPK (AMP-activated protein kinase) signaling pathway.[57, 58] Metformin induces energy deficiency in cancer cells by promoting ATP depletion mainly through inhibiting glycolysis, TCA cycle, and electron transport chain complex I.[59] The energy crisis stress imposed by metformin activates the AMPK signaling pathway (Fig. 4A). Among all downstream actions of AMPK, one is to regulate cancer cell death by inhibiting the expression of FASN and hindering the biosynthesis of fatty acid and lipids.[60] Eventually, without adequate lipids and fatty acids to provide cellular energy and building blocks, cancer cell proliferation is decreased.
Fig. 4.
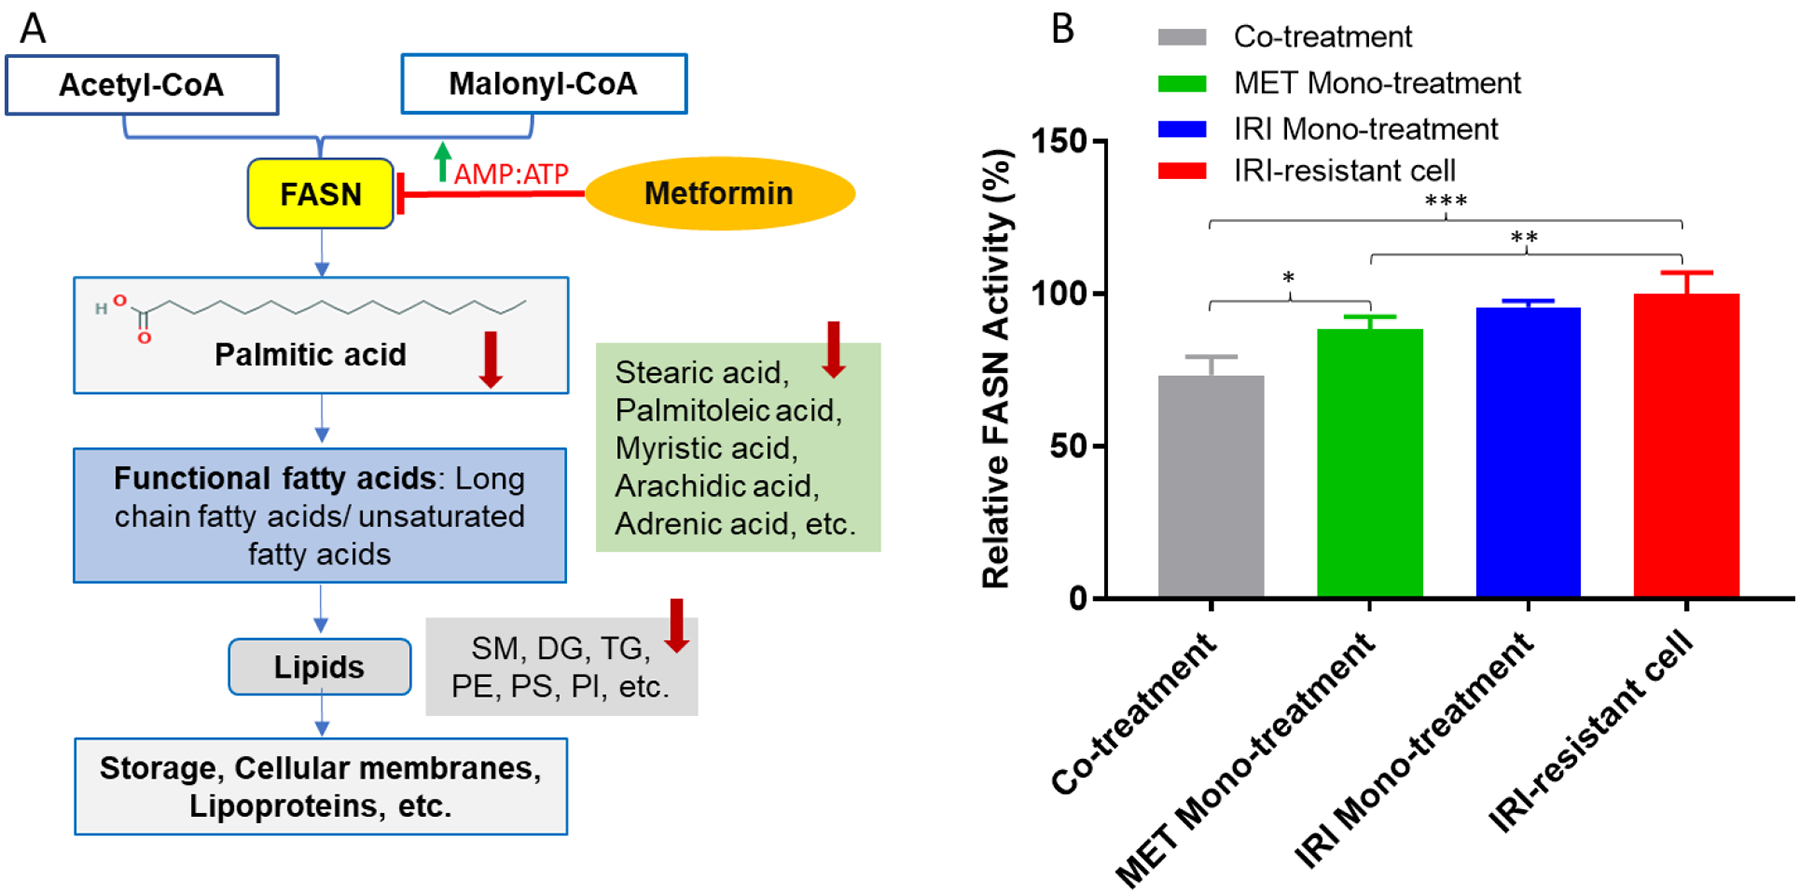
The proposed mechanisms of metformin in the treatment of IRI-resistant cells and results from FASN activity assay. (A) Schematic pharmacological pathways of metformin in IRI-resistant cells. Metformin inhibits FASN by activating AMPK pathway, and the downstream products, including fatty acids and lipids, are decreased. (B) The relative FASN enzymatic activities of IRI-resistant cells in four different treatments. Results represent four replicates in each treatment for FASN enzymatic activity assay. Standard deviations are labeled as error bars in the histogram. (* p < 0.05; ** p < 0.01; *** p < 0.001 from one-way ANOVA).
In order to compare the degree of FASN inhibition in IRI-resistant cells among four different groups (i.e., IRI mono-treatment, metformin mono-treatment, co-treatment using both compounds, and IRI-resistant cells), we studied FASN activities by measuring the Malonyl-CoA-dependent oxidation rate of NADPH (Fig. 4B). We found the FASN activity in the co-treatment (7.5 ± 0.6 nmol NADPH oxidized min−1 mg protein−1) is the lowest among all four different groups (Fig. 4). The FASN activity in metformin mono-treatment (9.0 ± 0.4 nmol NADPH oxidized min−1 mg protein−1) is higher than that in the co-treatment but lower than those in both IRI mono-treatment (9.8 ± 0.2 nmol NADPH oxidized min−1 mg protein−1) and control cells (10.2 ± 0.7 nmol NADPH oxidized min−1 mg protein−1). These findings agree with the above results obtained from the SCMS and cell viability measurements, suggesting higher degrees of FASN inhibition is likely responsible for the enhanced antitumor ability in the co-treatment.
FASN, a key lipogenic enzyme, is an important biomarker, and its overexpression correlates with high malignancy and poor prognosis in cancer pathogenesis.[61] The development of cancer stemness is also associated with FASN overexpression.[62] Suppressing the activity of FASN can induce apoptosis of cancer cells and decrease their viability. Furthermore, the inhibition of FASN was believed to help restore cancer cells membrane to a non-malignant architecture, resulting in enhanced chemotherapy efficacy of treating drug-resistant cell lines.[63] In fact, combining FASN inhibitors with other chemotherapy agents has been proven as an effective strategy to resensitize anticancer drugs.[63] Our studies indicate that the enhanced potency of metformin containing co-treatment is likely due to its capability of suppressing FASN activity.
Although the current studies are performed using the IRI-resistant cells, drug resistance induced by metformin is also clinically relevant. It is known that diabetes (primarily type 2) is associated with increased risk of multiple cancers such as in liver, pancreas, colon, and breast.[64] Because metformin is a commonly used for treatment of diabetes, anti-metformin is generally observed in diabetes treatment for patients, including those with cancers. It has been reported that long-term exposure of cancer cells to metformin can lead to resistance to chemotherapy.[65, 66] It is worth comprehensively studying cancer cells with resistance to both metformin and anticancer drugs; however, these studies are beyond the scope of current work.
Conclusion
The oral antidiabetic drug metformin exhibits anticancer effects for its ability of selectively killing CSCs. To understand its influence on metabolites and synergetic effect with anticancer drug IRI, we conducted both metformin mono-treatment and metformin/IRI co-treatment for IRI-resistant cells, which are used the model system for drug-resistant cells. The Single-probe SCMS metabolomics studies were performed to investigate the influence of metformin on metabolites in IRI-resistant cells. Traditional HPLC/MS analyses of cell lysates were performed to provide complementary information for molecular identification. In addition, we carried out measurements of synergetic effect between metformin and IRI in co-treatment and studied the enzymatic activity of FASN. Our results indicate that metformin mono-treatment induced the downregulation of lipids and fatty acids, whereas the co-treatment resulted in further reduced production of glycosylated ceramides. Importantly, some species can be only detected and identified in live single cells. The measurement of CI demonstrated a synergistic interaction between metformin and IRI in the co-treatment. Enzymatic activity assay confirmed that the co-treatment led to the lowest FASN activity compared with the mono-treatment of metformin or IRI. Collectively, our studies indicate that metformin sensitizes IRI-resistant cells, and its pharmacological action is related to its capability of inhibiting FASN.
Supplementary Material
Highlights.
Ambient single cell mass spectrometry was used to study live cells.
Other analytical techniques (e.g., cytotoxicity assay, enzymatic activity assay, and HPLC/MS) were used to provide complementary information.
Drug-resistant cancer cells’ viabilities and molecular profiles were affected by antidiabetic drug metformin.
Unique lipids and metabolites were observed only in live single cells.
Inhibition of fatty acid synthase (FASN) was discovered as a potential mechanism related to metformin treatment of drug-resistant cancer cells.
ACKNOWLEDGMENT
This research project is partially supported by grants from National Institutes of Health (NIH) R01GM116116 (Z. Y.), National Science Foundation (NSF) OCE-1634630 (Z. Y.), Institutional Development Award (IDeA) from the National Institute of General Medical Sciences (NIGMS) of the NIH P20GM103640, and Research Council of the University of Oklahoma Norman Campus (Z. Y.). We also thank Prof. Paul Sims (University of Oklahoma) for suggestions of studies performed using the microplate reader.
Footnotes
Publisher's Disclaimer: This is a PDF file of an unedited manuscript that has been accepted for publication. As a service to our customers we are providing this early version of the manuscript. The manuscript will undergo copyediting, typesetting, and review of the resulting proof before it is published in its final form. Please note that during the production process errors may be discovered which could affect the content, and all legal disclaimers that apply to the journal pertain.
Declaration of interests
The authors declare that they have no known competing financial interests or personal relationships that could have appeared to influence the work reported in this paper.
Reference
- [1].Zahreddine H, Borden KLB, Mechanisms and insights into drug resistance in cancer, Front Pharmacol 4 (2013). [DOI] [PMC free article] [PubMed] [Google Scholar]
- [2].Favoriti P, Carbone G, Greco M, Pirozzi F, Pirozzi REM, Corcione F, Worldwide burden of colorectal cancer: a review, Updates Surg 68(1) (2016) 7–11. [DOI] [PubMed] [Google Scholar]
- [3].Bray F, Ferlay J, Soerjomataram I, Siegel RL, Torre LA, Jemal A, Global cancer statistics 2018: GLOBOCAN estimates of incidence and mortality worldwide for 36 cancers in 185 countries, Ca-Cancer J Clin 68(6) (2018) 394–424. [DOI] [PubMed] [Google Scholar]
- [4].Van Cutsem E, Twelves C, Cassidy J, Allman D, Bajetta E, Boyer M, Bugat R, Findlay M, Frings S, Jahn M, McKendrick J, Osterwalder B, Perez-Manga G, Rosso R, Rougier P, Schmiegel WH, Seitz JF, Thompson P, Vieitez JM, Weitzel C, Harper P, Grp XCCS, Oral capecitabine compared with intravenous fluorouracil plus leucovorin in patients with metastatic colorectal cancer: Results of a large phase III study, J Clin Oncol 19(21) (2001) 4097–4106. [DOI] [PubMed] [Google Scholar]
- [5].Colucci G, Gebbia V, Paoletti G, Giuliani F, Caruso M, Gebbia N, Carteni G, Agostara B, Pezzella G, Manzione L, Borsellino N, Misino A, Romito S, Durini E, Cordio S, Di Seri M, Lopez M, Maiello E, Phase III randomized trial of FOLFIRI versus FOLFOX4 in the treatment of advanced colorectal cancer: A Multicenter study of the Gruppo Oncologico Dell’Italia Meridionale, J Clin Oncol 23(22) (2005) 4866–4875. [DOI] [PubMed] [Google Scholar]
- [6].Saltz LB, Cox JV, Blanke C, Rosen LS, Fehrenbacher L, Moore MJ, Maroun JA, Ackland SP, Locker PK, Pirotta N, Elfring GL, Miller LL, Group IS, Irinotecan plus fluorouracil and leucovorin for metastatic colorectal cancer., New Engl J Med 343(13) (2000) 905–914. [DOI] [PubMed] [Google Scholar]
- [7].Loupakis F, Cremolini C, Masi G, Lonardi S, Zagonel V, Salvatore L, Cortesi E, Tomasello G, Ronzoni M, Spadi R, Zaniboni A, Tonini G, Buonadonna A, Amoroso D, Chiara S, Carlomagno C, Boni C, Allegrini G, Boni L, Falcone A, Initial Therapy with FOLFOXIRI and Bevacizumab for Metastatic Colorectal Cancer, New Engl J Med 371(17) (2014) 1609–1618. [DOI] [PubMed] [Google Scholar]
- [8].Chen SJ, Yueh MF, Bigo C, Barbier O, Wang KP, Karin M, Nguyen N, Tukey RH, Intestinal glucuronidation protects against chemotherapy-induced toxicity by irinotecan (CPT-11), P Natl Acad Sci USA 110(47) (2013) 19143–19148. [DOI] [PMC free article] [PubMed] [Google Scholar]
- [9].Beretta GL, Perego P, Zunino F, Mechanisms of cellular resistance to camptothecins, Curr Med Chem 13(27) (2006) 3291–3305. [DOI] [PubMed] [Google Scholar]
- [10].Petitprez A, Poindessous V, Ouaret D, Regairaz M, Bastian G, Guerin E, Escargueil AE, Larsen AK, Acquired irinotecan resistance is accompanied by stable modifications of cell cycle dynamics independent of MSI status, Int J Oncol 42(5) (2013) 1644–1653. [DOI] [PubMed] [Google Scholar]
- [11].Saleem A, Edwards TK, Rasheed Z, Rubin EH, Mechanisms of resistance to camptothecins, Ann Ny Acad Sci 922 (2000) 46–55. [DOI] [PubMed] [Google Scholar]
- [12].Yang Y, Wang GX, Zhu DJ, Huang YF, Luo Y, Su PF, Chen XW, Wang Q, Epithelial-mesenchymal transition and cancer stem cell-like phenotype induced by Twist1 contribute to acquired resistance to irinotecan in colon cancer, Int J Oncol 51(2) (2017) 515–524. [DOI] [PubMed] [Google Scholar]
- [13].Emmink BL, Van Houdt WJ, Vries RG, Hoogwater FJ, Govaert KM, Verheem A, Nijkamp MW, Steller EJ, Jimenez CR, Clevers H, Borel Rinkes IH, Kranenburg O, Differentiated human colorectal cancer cells protect tumor-initiating cells from irinotecan, Gastroenterology 141(1) (2011) 269–78. [DOI] [PubMed] [Google Scholar]
- [14].Liu RM, Sun M, Zhang GW, Lan YP, Yang ZB, Towards early monitoring of chemotherapy-induced drug resistance based on single cell metabolomics: Combining single-probe mass spectrometry with machine learning, Anal Chim Acta 1092 (2019) 42–48. [DOI] [PMC free article] [PubMed] [Google Scholar]
- [15].Vancura A, Bu PL, Bhagwat M, Zeng J, Vancurova I, Metformin as an Anticancer Agent, Trends Pharmacol Sci 39(10) (2018) 867–878. [DOI] [PMC free article] [PubMed] [Google Scholar]
- [16].Rattan R, Ali Fehmi R, Munkarah A, Metformin: an emerging new therapeutic option for targeting cancer stem cells and metastasis, J Oncol 2012 (2012) 928127. [DOI] [PMC free article] [PubMed] [Google Scholar]
- [17].Hirsch HA, Iliopoulos D, Tsichlis PN, Struhl K, Metformin selectively targets cancer stem cells, and acts together with chemotherapy to block tumor growth and prolong remission, Cancer Res 69(19) (2009) 7507–7511. [DOI] [PMC free article] [PubMed] [Google Scholar]
- [18].Bao B, Azmi AS, Ali S, Zaiem F, Sarkar FH, Metformin may function as anti-cancer agent via targeting cancer stem cells: the potential biological significance of tumor-associated miRNAs in breast and pancreatic cancers, Ann Transl Med 2(6) (2014) 59–59. [DOI] [PMC free article] [PubMed] [Google Scholar]
- [19].Mayer MJ, Klotz LH, Venkateswaran V, Metformin and prostate cancer stem cells: a novel therapeutic target, Prostate Cancer P D 18(4) (2015) 303–309. [DOI] [PubMed] [Google Scholar]
- [20].Gong J, Kelekar G, Shen J, Shen J, Kaur S, Mita M, The expanding role of metformin in cancer: an update on antitumor mechanisms and clinical development, Target Oncol 11(4) (2016) 447–467. [DOI] [PubMed] [Google Scholar]
- [21].Bragagnoli A, Araujo R, Abdalla K, Comar F, Santos F, Ferraz M, dos Santos LV, Carvalheira J, Lima JPSDN, Final results of a phase II of metformin plus irinotecan for refractory colorectal cancer., J Clin Oncol 36(15) (2018). [Google Scholar]
- [22].Buikhuisen JY, Torang A, Medema JP, Exploring and modelling colon cancer inter-tumour heterogeneity: opportunities and challenges, Oncogenesis 9(7) (2020). [DOI] [PMC free article] [PubMed] [Google Scholar]
- [23].Teeuwssen M, Fodde R, Cell Heterogeneity and Phenotypic Plasticity in Metastasis Formation: The Case of Colon Cancer, Cancers 11(9) (2019). [DOI] [PMC free article] [PubMed] [Google Scholar]
- [24].Muschet C, Moller G, Prehn C, de Angelis MH, Adamski J, Tokarz J, Removing the bottlenecks of cell culture metabolomics: fast normalization procedure, correlation of metabolites to cell number, and impact of the cell harvesting method, Metabolomics 12(10) (2016). [DOI] [PMC free article] [PubMed] [Google Scholar]
- [25].Zhang LW, Vertes A, Energy Charge, Redox State, and Metabolite Turnover in Single Human Hepatocytes Revealed by Capillary Microsampling Mass Spectrometry, Analytical Chemistry 87(20) (2015) 10397–10405. [DOI] [PubMed] [Google Scholar]
- [26].Abouleila Y, Onidani K, Ali A, Shoji H, Kawai T, Lim CT, Kumar V, Okaya S, Kato K, Hiyama E, Yanagida T, Masujima T, Shimizu Y, Honda K, Live single cell mass spectrometry reveals cancer-specific metabolic profiles of circulating tumor cells, Cancer Sci 110(2) (2019) 697–706. [DOI] [PMC free article] [PubMed] [Google Scholar]
- [27].Zhang L, Foreman DP, Grant PA, Shrestha B, Moody SA, Villiers F, Kwak JM, Vertes A, In situ metabolic analysis of single plant cells by capillary microsampling and electrospray ionization mass spectrometry with ion mobility separation, Analyst 139(20) (2014) 5079–85. [DOI] [PubMed] [Google Scholar]
- [28].Zhu HY, Zou GC, Wang N, Zhuang MH, Xiong W, Huang GM, Single-neuron identification of chemical constituents, physiological changes, and metabolism using mass spectrometry, P Natl Acad Sci USA 114(10) (2017) 2586–2591. [DOI] [PMC free article] [PubMed] [Google Scholar]
- [29].Bergman HM, Lanekoff I, Profiling and quantifying endogenous molecules in single cells using nano-DESI MS, Analyst 142(19) (2017) 3639–3647. [DOI] [PubMed] [Google Scholar]
- [30].Shrestha B, Vertes A, In Situ Metabolic Profiling of Single Cells by Laser Ablation Electrospray Ionization Mass Spectrometry, Analytical Chemistry 81(20) (2009) 8265–8271. [DOI] [PubMed] [Google Scholar]
- [31].Pan N, Standke SJ, Kothapalli NR, Sun M, Bensen RC, Burgett AWG, Yang ZB, Quantification of Drug Molecules in Live Single Cells Using the Single-Probe Mass Spectrometry Technique, Analytical Chemistry 91(14) (2019) 9018–9024. [DOI] [PMC free article] [PubMed] [Google Scholar]
- [32].Pan N, Rao W, Yang Z, Single-Probe Mass Spectrometry Analysis of Metabolites in Single Cells, Methods Mol Biol 2064 (2020) 61–71. [DOI] [PubMed] [Google Scholar]
- [33].Pan N, Rao W, Kothapalli NR, Liu R, Burgett AW, Yang Z, The single-probe: a miniaturized multifunctional device for single cell mass spectrometry analysis, Anal Chem 86(19) (2014) 9376–80. [DOI] [PubMed] [Google Scholar]
- [34].Sun M, Yang ZB, Metabolomic Studies of Live Single Cancer Stem Cells Using Mass Spectrometry, Analytical Chemistry 91(3) (2019) 2384–2391. [DOI] [PMC free article] [PubMed] [Google Scholar]
- [35].Standke SJ, Colby DH, Bensen RC, Burgett AWG, Yang ZB, Mass Spectrometry Measurement of Single Suspended Cells Using a Combined Cell Manipulation System and a Single-Probe Device, Analytical Chemistry 91(3) (2019) 1738–1742. [DOI] [PMC free article] [PubMed] [Google Scholar]
- [36].van Meerloo J, Kaspers GJ, Cloos J, Cell sensitivity assays: the MTT assay, Methods Mol Biol 731 (2011) 237–45. [DOI] [PubMed] [Google Scholar]
- [37].Nepokroeff CM, Lakshmanan MR, Porter JW, Fatty-acid synthase from rat liver, Methods Enzymol 35 (1975) 37–44. [DOI] [PubMed] [Google Scholar]
- [38].Lee KH, Lee MS, Cha EY, Sul JY, Lee JS, Kim JS, Park JB, Kim JY, Inhibitory effect of emodin on fatty acid synthase, colon cancer proliferation and apoptosis, Mol Med Rep 15(4) (2017) 2163–2173. [DOI] [PMC free article] [PubMed] [Google Scholar]
- [39].Dils R, Carey EM, Fatty acid synthase from rabbit mammary gland, Methods Enzymol 35 (1975) 74–83. [DOI] [PubMed] [Google Scholar]
- [40].Liu RM, Zhang GW, Sun M, Pan XL, Yang ZB, Integrating a generalized data analysis workflow with the Single-probe mass spectrometry experiment for single cell metabolomics, Anal Chim Acta 1064 (2019) 71–79. [DOI] [PMC free article] [PubMed] [Google Scholar]
- [41].Romano P, Profumo A, Rocco M, Mangerini R, Ferri F, Facchiano A, Geena 2, improved automated analysis of MALDI/TOF mass spectra, Bmc Bioinformatics 17 (2016). [DOI] [PMC free article] [PubMed] [Google Scholar]
- [42].Xia J, Wishart DS, Using MetaboAnalyst 3.0 for Comprehensive Metabolomics Data Analysis, Current Protocols in Bioinformatics 55(1) (2016) 14.10.1–14.10.91. [DOI] [PubMed] [Google Scholar]
- [43].Smith CA, O’Maille G, Want EJ, Qin C, Trauger SA, Brandon TR, Custodio DE, Abagyan R, Siuzdak G, METLIN: a metabolite mass spectral database, Ther Drug Monit 27(6) (2005) 747–51. [DOI] [PubMed] [Google Scholar]
- [44].Wishart DS, Feunang YD, Marcu A, Guo AC, Liang K, Vazquez-Fresno R, Sajed T, Johnson D, Li C, Karu N, Sayeeda Z, Lo E, Assempour N, Berjanskii M, Singhal S, Arndt D, Liang Y, Badran H, Grant J, Serra-Cayuela A, Liu Y, Mandal R, Neveu V, Pon A, Knox C, Wilson M, Manach C, Scalbert A, HMDB 4.0: the human metabolome database for 2018, Nucleic Acids Res 46(D1) (2018) D608–D617. [DOI] [PMC free article] [PubMed] [Google Scholar]
- [45].Wang M, Carver JJ, Phelan VV, Sanchez LM, Garg N, Peng Y, Nguyen DD, Watrous J, Kapono CA, Luzzatto-Knaan T, Porto C, Bouslimani A, Melnik AV, Meehan MJ, Liu WT, Crusemann M, Boudreau PD, Esquenazi E, Sandoval-Calderon M, Kersten RD, Pace LA, Quinn RA, Duncan KR, Hsu CC, Floros DJ, Gavilan RG, Kleigrewe K, Northen T, Dutton RJ, Parrot D, Carlson EE, Aigle B, Michelsen CF, Jelsbak L, Sohlenkamp C, Pevzner P, Edlund A, McLean J, Piel J, Murphy BT, Gerwick L, Liaw CC, Yang YL, Humpf HU, Maansson M, Keyzers RA, Sims AC, Johnson AR, Sidebottom AM, Sedio BE, Klitgaard A, Larson CB, P CAB, Torres-Mendoza D, Gonzalez DJ, Silva DB, Marques LM, Demarque DP, Pociute E, O’Neill EC, Briand E, Helfrich EJN, Granatosky EA, Glukhov E, Ryffel F, Houson H, Mohimani H, Kharbush JJ, Zeng Y, Vorholt JA, Kurita KL, Charusanti P, McPhail KL, Nielsen KF, Vuong L, Elfeki M, Traxler MF, Engene N, Koyama N, Vining OB, Baric R, Silva RR, Mascuch SJ, Tomasi S, Jenkins S, Macherla V, Hoffman T, Agarwal V, Williams PG, Dai J, Neupane R, Gurr J, Rodriguez AMC, Lamsa A, Zhang C, Dorrestein K, Duggan BM, Almaliti J, Allard PM, Phapale P, Nothias LF, Alexandrov T, Litaudon M, Wolfender JL, Kyle JE, Metz TO, Peryea T, Nguyen DT, VanLeer D, Shinn P, Jadhav A, Muller R, Waters KM, Shi W, Liu X, Zhang L, Knight R, Jensen PR, Palsson BO, Pogliano K, Linington RG, Gutierrez M, Lopes NP, Gerwick WH, Moore BS, Dorrestein PC, Bandeira N, Sharing and community curation of mass spectrometry data with Global Natural Products Social Molecular Networking, Nat Biotechnol 34(8) (2016) 828–837. [DOI] [PMC free article] [PubMed] [Google Scholar]
- [46].Chou TC, Drug Combination Studies and Their Synergy Quantification Using the Chou-Talalay Method, Cancer Res 70(2) (2010) 440–446. [DOI] [PubMed] [Google Scholar]
- [47].Chou TC, Theoretical basis, experimental design, and computerized simulation of synergism and antagonism in drug combination studies, Pharmacol Rev 58(3) (2006) 621–681. [DOI] [PubMed] [Google Scholar]
- [48].Chou TC, Preclinical versus clinical drug combination studies, Leukemia Lymphoma 49(11) (2008) 2059–2080. [DOI] [PubMed] [Google Scholar]
- [49].Chou TC, Preclinical versus clinical drug combination studies, Leuk Lymphoma 49(11) (2008) 2059–80. [DOI] [PubMed] [Google Scholar]
- [50].Mashima T, Seimiya H, Tsuruo T, De novo fatty-acid synthesis and related pathways as molecular targets for cancer therapy, Brit J Cancer 100(9) (2009) 1369–1372. [DOI] [PMC free article] [PubMed] [Google Scholar]
- [51].Kuhajda FP, Fatty acid synthase and cancer: New application of an old pathway, Cancer Res 66(12) (2006) 5977–5980. [DOI] [PubMed] [Google Scholar]
- [52].Menendez JA, Lupu R, Fatty acid synthase and the lipogenic phenotype in cancer pathogenesis, Nature Reviews Cancer 7(10) (2007) 763–777. [DOI] [PubMed] [Google Scholar]
- [53].Menendez JA, Lupu R, Fatty acid synthase and the lipogenic phenotype in cancer pathogenesis, Nat Rev Cancer 7(10) (2007) 763–77. [DOI] [PubMed] [Google Scholar]
- [54].Santos CR, Schulze A, Lipid metabolism in cancer, The FEBS Journal 279(15) (2012) 2610–2623. [DOI] [PubMed] [Google Scholar]
- [55].Baron A, Migita T, Tang D, Loda M, Fatty acid synthase: A metabolic oncogene in prostate cancer?, Journal of Cellular Biochemistry 91(1) (2004) 47–53. [DOI] [PubMed] [Google Scholar]
- [56].Flavin R, Peluso S, Nguyen PL, Loda M, Fatty acid synthase as a potential therapeutic target in cancer, Future Oncol 6(4) (2010) 551–562. [DOI] [PMC free article] [PubMed] [Google Scholar]
- [57].Luo ZJ, Zang MW, Guo W, AMPK as a metabolic tumor suppressor: control of metabolism and cell growth, Future Oncology 6(3) (2010) 457–470. [DOI] [PMC free article] [PubMed] [Google Scholar]
- [58].Hadad SM, Hardie DG, Appleyard V, Thompson AM, Effects of metformin on breast cancer cell proliferation, the AMPK pathway and the cell cycle, Clin Transl Oncol 16(8) (2014) 746–752. [DOI] [PubMed] [Google Scholar]
- [59].Cantoria MJ, Boros LG, Meuillet EJ, Contextual inhibition of fatty acid synthesis by metformin involves glucose-derived acetyl-CoA and cholesterol in pancreatic tumor cells, Metabolomics 10(1) (2014) 91–104. [DOI] [PMC free article] [PubMed] [Google Scholar]
- [60].Loubière C, Goiran T, Laurent K, Djabari Z, Tanti J-F, Bost F, Metformin-induced energy deficiency leads to the inhibition of lipogenesis in prostate cancer cells, Oncotarget 6(17) (2015) 15652–15661. [DOI] [PMC free article] [PubMed] [Google Scholar]
- [61].Cao Z, Xu YL, Guo F, Chen X, Ji J, Xu H, He JY, Yu YW, Sun YH, Lu X, Wang FB, FASN Protein Overexpression Indicates Poor Biochemical Recurrence-Free Survival in Prostate Cancer, Dis Markers 2020 (2020). [DOI] [PMC free article] [PubMed] [Google Scholar]
- [62].Yasumoto Y, Miyazaki H, Vaidyan LK, Kagawa Y, Ebrahimi M, Yamamoto Y, Ogata M, Katsuyama Y, Sadahiro H, Suzuki M, Owada Y, Inhibition of Fatty Acid Synthase Decreases Expression of Stemness Markers in Glioma Stem Cells, Plos One 11(1) (2016). [DOI] [PMC free article] [PubMed] [Google Scholar]
- [63].Buckley D, Duke G, Heuer TS, O’Farrell M, Wagman AS, McCulloch W, Kemble G, Fatty acid synthase - Modern tumor cell biology insights into a classical oncology target, Pharmacology & Therapeutics 177 (2017) 23–31. [DOI] [PubMed] [Google Scholar]
- [64].Giovannucci E, Harlan DM, Archer MC, Bergenstal RM, Gapstur SM, Habel LA, Pollak M, Regensteiner JG, Yee D, Diabetes and cancer: a consensus report, Diabetes Care 33(7) (2010) 1674–85. [DOI] [PMC free article] [PubMed] [Google Scholar]
- [65].Scherbakov AM, Sorokin DV, Tatarskiy VV, Prokhorov NS, Semina SE, Berstein LM, Krasil’nikov MA, The phenomenon of acquired resistance to metformin in breast cancer cells: The interaction of growth pathways and estrogen receptor signaling, Iubmb Life 68(4) (2016) 281–292. [DOI] [PubMed] [Google Scholar]
- [66].Andrzejewski S, Siegel PM, St-Pierre J, Metabolic Profiles Associated With Metformin Efficacy in Cancer, Front Endocrinol 9 (2018). [DOI] [PMC free article] [PubMed] [Google Scholar]
Associated Data
This section collects any data citations, data availability statements, or supplementary materials included in this article.