

Abstract
Reduced physical activity and increased sedentary behavior may independently contribute to development of obstructive sleep apnea (OSA) through increased adiposity, inflammation, insulin resistance and body fluid retention. However, epidemiologic evidence remains sparse, and is primarily limited to cross-sectional studies. We prospectively followed 50,332 women from the Nurses’ Health Study (2002-2012), 68,265 women from the Nurses’ Health Study II (1995-2013), and 19,320 men from the Health Professionals Follow-up Study (1996-2012). Recreational physical activity (quantified by metabolic equivalent of task [MET]-hours/week) and sitting time spent watching TV and at work/away from home were assessed by questionnaires every 2-4 years. Physician-diagnosed OSA was identified by validated self-report. Cox models were used to estimate hazard ratios (HRs) and 95% confidence intervals (CIs) for OSA incidence associated with physical activity and sedentary behavior.
During 2,004,663 person-years of follow-up, we documented 8,733 incident OSA cases. After adjusting for potential confounders, the pooled HR for OSA comparing participants with ≥36.0 versus <6.0 MET-hours/week of physical activity was 0.46 (95% CI: 0.43, 0.50; (Ptrend <0.001). Compared with participants spending <4.0 hours/week sitting watching TV, the multivariable-adjusted HR (95% CI) was 1.78 (1.60, 1.98) for participants spending ≥28.0 hours/week (Ptrend <0.001). The comparable HR (95% CI) was 1.49 (1.38, 1.62) for sitting hours at work/away from home (Ptrend <0.001). With additional adjustment for several metabolic factors including BMI and waist circumference, the associations with physical activity and sitting hours at work/away from home were attenuated but remained significant Ptrend <0.001). whereas the association with sitting hours watching TV was no longer statistically significant (Ptrend =0.18).
Higher levels of physical activity and fewer sedentary hours were associated with lower OSA incidence. The potential mediating role of metabolic factors in the association between sedentary behavior and OSA incidence may depend on type of sedentary behavior. Our results suggest that promoting an active lifestyle may reduce OSA incidence.
Summary of the “take home” message:
This large prospective cohort study highlights the potential role of maintaining an active lifestyle in reducing obstructive sleep apnea (OSA) incidence. Higher levels of physical activity and fewer sedentary hours were associated with lower risk of OSA.
Introduction
Obstructive sleep apnea (OSA) affects 10-20% of the US adult population [1], leading to increased morbidity and mortality from cardiovascular disease, diabetes and cancer [2–9]. Over the past decade, physical activity has been studied as a plausible risk factor for OSA [10–14], and exercise interventions have been suggested as beneficial for effectively reducing OSA severity and excessive daytime sleepiness (EDS) [15–18]. Although sedentary behavior is inversely correlated with physical activity, numerous studies have shown that sedentary behavior is associated with various health outcomes independent of levels of physical activity [19]. Low physical activity levels and long sedentary time may increase OSA risk by promoting obesity, systemic inflammation and insulin resistance, which have been implicated in the pathogenesis of OSA [20, 21]. Lower-extremity edema, which is common in inactive/sedentary individuals, could cause a rostral shift of body fluid towards the neck during sleep, narrowing the upper airway, increasing its collapsibility, and resulting in occurrence of OSA [22–26]. However, most prior observational studies on the associations of physical activity [10–14] and sedentary behavior [27, 28] with OSA were cross-sectional, with incomplete exposure assessment and inadequate control for confounding. To address limitations of previous studies and provide further insights into exercise-based strategies for OSA prevention, we examined the independent and the joint associations of physical activity and sedentary behavior with risk of incident OSA in the Nurses’ Health Study (NHS), Nurses’ Health Study II (NHSII), and Health Professionals Follow-up Study (HPFS). We hypothesized that (1) physical activity and sedentary behavior were independently associated with OSA incidence, (2) the observed associations were partly explained by metabolic dysfunction and body fluid retention, and (3) physical inactivity interacted synergistically with sedentary behavior to influence OSA incidence.
Methods
Study Population
NHS, NHSII and HPFS are three ongoing prospective cohort studies of US healthcare professionals. Briefly, NHS began in 1976, when 121,700 female nurses aged 30-55 years were enrolled, and NHSII in 1989, enrolling 116,429 female nurses between 25-42 years of age. HPFS began in 1986, enrolling 51,529 male health professionals aged 40-75 years. At baseline and throughout biennial follow-up, disease diagnoses and other health-related information were assessed via self-administered questionnaires. Participants were excluded from analyses if they did not answer the question on sleep apnea diagnosis, had sleep apnea diagnosed prior to the baseline of this analysis (NHS: 2002, NHSII: 1995, and HPFS: 1996), or had no information on physical activity or sedentary behavior at the study baseline. A total of 50,332 participants in NHS (2002-2012), 68,265 in NHSII (1995-2013), and 19,320 in HPFS (1996-2012) were included in this analysis. The study protocols were approved by the Institutional Review Board of the Brigham and Women’s Hospital (Boston, MA) and the Harvard T. H. Chan School of Public Health (Boston, MA). Informed consent was indicated by the completion of the questionnaires.
Assessment of Physical Activity
Starting from 1986 (NHS and HPFS) and 1989 (NHSII), participants reported their average time spent per week on walking, jogging, running, bicycling (including stationary machine), lap swimming, tennis, squash/racket ball, calisthenics/rowing, outdoor work, and weightlifting every 2-4 years throughout follow-up. For each physical activity type, responses included 10 categories ranging from none to 11-20 hours/week. Participants were also queried about their usual walking pace and the number of flights of stairs climbed per day. Metabolic equivalent of task (MET, the ratio of the energy expenditure for a specific activity to the energy expenditure at rest) scores were then assigned to each type of physical activity, and total physical activity in MET-hours/week was calculated by multiplying exercise duration and summing over all activity types. The validity and reproducibility of this physical activity questionnaire have been assessed previously in 149 NHSII women and 238 HPFS men, with moderate-to-high correlations with past-week recalls or 1-year physical activity diaries [29, 30]. Based on the pooled distribution across three cohorts, we evaluated total physical activity in five categories as <6.0, 6.0-1.9, 12.0-20.9, 21.0-35.9 and ≥36.0 MET-hours/week. Secondarily, we analysed moderate-intensity (including all activities with a MET score ≥3 and <6, plus walking at an easy pace, which had a MET score of 2.5) and vigorous-intensity (including all activities with a MET score ≥6) physical activity separately.
Assessment of Sedentary Behavior
In NHS, sedentary behavior was assessed in 1992, 2004 and 2008; the assessment in NHSII started from 1989, with updates every 2-4 years thereafter (9 response categories, ranging from 0 to >90 hours/week in both cohorts). HPFS participants were first queried about their sedentary behaviour in 1988, which was updated biennially with similar response categories. We considered sedentary time spent watching TV as the primary exposure as it was strongly predictive of multiple adverse health outcomes in prior investigations [19]. We further considered time spent sitting at work/away from home as a secondary exposure. Similar to physical activity, we used common cutoff points to facilitate comparison across cohorts, which were <4.0, 4.0-6.9, 7.0-13.9, 14.0-27.9, and ≥28.0 hours/week for both sedentary exposures.
Assessment of Obstructive Sleep Apnea and Related Symptoms
In 2012, NHS participants reported whether they had sleep apnea diagnosed by a clinician or sleep study, and (if answered yes) the year of first diagnosis (before 2002, 2002-2005, 2006-2007, 2008-2009, 2010-2011, and after 2012) [31, 32]. Therefore, the follow-up period was 2002-2012. Sleep apnea were assessed in a similar manner in 2013 in NHSII and in 2012 in HPFS, with 1995-2013 and 1996-2012 as follow-up periods, respectively. In a previous validation study of self-reported sleep apnea in 108 NHS/NHSII women, all were ascertained to have sleep apnea diagnosed by an objective method according to their medical records (92% diagnosed by in-lab polysomnography, 98% classified as OSA, and 89% considered as moderate-to-severe with Apnea-Hypopnea Index [AHI] ≥15) [31]. The prevalence of self-reported OSA [31] in the NHS, NHSII and HPFS was similar to the projected US prevalence of moderate-to-severe OSA measured by polysomnography [1]. Key OSA symptoms, including snoring and EDS, were assessed repeatedly during follow-up [6]. We considered physician-diagnosed OSA as the primary outcome. The secondary outcome was defined as OSA with EDS (i.e., potentially more severe OSA with ≥4 days/week of sleepiness).
Statistical Analysis
To capture long-term exposure and reduce measurement errors, we used cumulative average levels of physical activity and sedentary behavior in all analyses, which were calculated by averaging all available assessments prior to a specific questionnaire cycle. Person-years of follow-up were calculated from the return date of the baseline questionnaire until the date of OSA diagnosis or the return date of 2012-2013 questionnaire, whichever occurred first.
We first performed separate analyses in each cohort, and then conducted pooled analyses with assessment of potential heterogeneity by cohort using random-effects meta-analysis. Given no evidence for violation of the proportional hazard assumption, we estimated multivariable-adjusted hazard ratios (HR) and 95% CIs for OSA incidence using Cox proportional hazard models across categories of physical activity and sedentary behaviors. Exposures of interest and covariates were modeled as time-varying in the analysis. Tests for linear trend were performed by modeling the midpoint value of each exposure category as a continuous variable.
Multivariable analyses were stratified by cohort, age and questionnaire cycle, and adjusted for race/ethnicity, smoking status, menopausal status, duration of postmenopausal hormone therapy by type, alcohol consumption, Alternate Healthy Eating Index (AHEI) and habitual sleep duration (see Supplementary Methods for details on covariate assessment). To explore hypothesized pathways through which physical activity and sedentary behavior influence OSA incidence, we further considered two separate models, one additionally adjusted for metabolic factors including diabetes, hypertension, body mass index (BMI) and waist circumference, and the other additionally adjusted for venous thromboembolism (VTE), a potential correlate of lower-extremity edema. The final (fully-adjusted) model included all covariates listed above plus mutual adjustment of physical activity or sedentary behavior in the same model. We repeated these analyses to further evaluate (1) whether the associations differed by intensity of physical activity and (2) whether physical activity and sedentary behavior were more strongly associated with incidence of OSA with concurrent EDS.
We performed stratified analyses by age, sex, BMI, waist circumference, diabetic status, VTE, and physical activity/sedentary behavior. Effect modification was assessed by multiplicative cross-product interactions using the likelihood ratio test. We also evaluated the joint association of physical activity and sedentary behavior with OSA incidence. We cross-classified participants into four mutually exclusive groups using dichotomized exposures (≥7.5 versus <7.5 MET-hours/week for physical activity based on the recommendation of 150 minutes of moderate activity per week and ≥28 versus <28 hours/week for sitting hours watching TV based on the average TV watching hours in US adults) [33]. To address potential reverse causation, we conducted latency analyses by using cumulative average exposure assessed 2-4 years prior to OSA diagnosis.
Data analyses were performed using SAS statistical software (version 9.4 for UNIX; SAS Institute Inc., Cary, NC). All tests were 2-sided, with P values <.05 considered statistically significant.
Results
Population Characteristics
Participants who were physically active were more likely to be younger or premenopausal, had lower BMI and waist circumference, consumed more alcohol, had higher AHEI, and were less likely to be current-smokers or users of estrogen-only hormone therapy, or report habitual snoring and EDS. They were also less likely to have diabetes, hypertension, and VTE, but more likely to have physical exams in the past 2 years (Table 1). Similar differences in population characteristics were observed comparing participants with shorter versus longer sitting hours spent watching TV (Supplementary Table 1).
Table 1.
Age-adjusted baseline characteristics by categories of physical activity in the NHS, NHSII and HPFS
| Characteristic | Physical activity, MET-hours/weeka | |||||
|---|---|---|---|---|---|---|
| NHS (2002) | NHSII (1995) | HPFS (1996) | ||||
|
| ||||||
| <6.0 (n=16,278) |
≥36.0 (n=7,372) |
<6.0 (n=19,467) |
≥36.0 (n=11,294) |
<6.0 (n=2,592) |
≥36.0 (n=7,338) |
|
| Age, years, mean (SD) | 66.7 (6.7) | 66.4 (6.5) | 41.4 (4.6) | 40.2 (4.7) | 58.9 (7.1) | 59.2 (7.2) |
| Non-White, % | 6.1 | 5.7 | 5.8 | 5.4 | 6.0 | 3.8 |
| BMI, kg/m2, mean (SD) b | 28.2 (5.8) | 25.0 (4.2) | 26.5 (6.4) | 24.4 (4.9) | 23.2 (10.1) | 22.2 (9.2) |
| Waist circumference, cm, mean (SD) | 89.5 (12.6) | 82.3 (10.9) | 88.9 (14.4) | 83.5 (13.0) | 103.7 (11.5) | 98.0 (9.8) |
| Alcohol intake, g/day, mean (SD) | 4.9 (8.2) | 6.6 (8.8) | 2.8 (5.8) | 4.0 (6.3) | 9.6 (13.4) | 11.0 (12.8) |
| Smoking status, % | ||||||
| Never smoked | 46.8 | 45.5 | 66.7 | 64.6 | 52.7 | 56.5 |
| Past smoker | 44.0 | 48.9 | 22.3 | 26.2 | 39.9 | 39.6 |
| Current smoker | 9.2 | 5.5 | 11.0 | 9.2 | 7.4 | 4.0 |
| Habitual sleep duration, hours, mean (SD) | 7.1 (1.2) | 7.1 (1.1) | 7.0 (1.1) | 6.9 (1.1) | 7.1 (1.1) | 7.2 (1.0) |
| Habitual snoring, ≥4 nights/week, % | 33.8 | 21.7 | 32.2 | 22.8 | 39.8 | 31.0 |
| Excessive daytime sleepiness, ≥4 days/week, % | 4.4 | 1.9 | 12.1 | 8.6 | 11.4 | 8.9 |
| AHEI, mean (SD) | 51.0 (8.9) | 56.9 (9.5) | 45.9 (9.4) | 53.2 (10.3) | 49.5 (10.0) | 55.3 (10.4) |
| History of diabetes, % | 8.1 | 3.2 | 0.6 | 0.3 | 2.9 | 1.3 |
| History of hypertension, % | 54.0 | 42.6 | 10.1 | 7.7 | 32.5 | 25.1 |
| History of venous thromboembolism, % | 8.3 | 6.7 | 3.0 | 2.9 | 1.7 | 1.2 |
| Physical exams in the past 2 years, % | 92.8 | 93.6 | 88.6 | 89.9 | 67.3 | 71.6 |
| Postmenopausal, % | 99.3 | 99.2 | 7.9 | 7.2 | - | - |
| Ever estrogen-only HT use, % | 44.2 | 43.1 | 6.0 | 5.2 | - | - |
| Ever estrogen + progestin HT use, % | 38.7 | 43.8 | 2.3 | 2.2 | - | - |
Abbreviations: NHS, Nurses’ Health Study; NHSII, Nurses’ Health Study II; HPFS, Health Professionals Follow-up Study; MET, metabolic equivalent task; SD, standard deviation; BMI, body mass index; AHEI, Alternate Healthy Eating Index 2010 score; HT, hormone therapy.
Weekly energy expenditure in MET-hours/week from recreational and leisure time physical activity.
Calculated as weight in kilograms divided by height in meters squared.
Physical Activity and Obstructive Sleep Apnea Incidence
We identified 8,733 incident OSA cases (6,652 women, 2,081 men) during 2,004,663 person-years of follow-up. Higher total physical activity was significantly associated with lower OSA incidence across the three cohorts, although the inverse association appeared stronger in NHS/NHSII than HPFS (Table 2; P for heterogeneity by cohort <0.001). In the pooled analyses adjusted for potential confounders, compared with participants with <6.0 MET-hours/week of physical activity, the HR (95% CI) for OSA incidence was 0.78 (0.73, 0.83) for 6.0-11.9 MET-hours/week, 0.67 (0.63, 0.71) for 12.0-20.9 MET-hours/week, 0.57 (0.53, 0.61) for 21.0-35.9 MET-hours/week, and 0.46 (0.43, 0.50) for ≥36.0 MET-hours/week (Ptrend <0.001). The observed association was moderately attenuated after additionally controlling for metabolic factors (particularly BMI and waist circumference), but remained statistically significant (Ptrend <0.001). The HR (95% CI) for OSA associated with a 9.0 MET-hour/week increment in physical activity was 0.87 (0.86, 0.88) before adjusting for metabolic factors and 0.94 (0.93, 0.95) after the adjustment. Further adjustment of VTE or mutual adjustment for sedentary hours did not materially alter the results. When examining moderate and vigorous physical activity separately, both were strongly inversely associated with OSA incidence and no appreciable differences were observed by activity intensity (Supplementary Tables 2 and 3).
Table 2.
Total physical activity and risk of incident obstructive sleep apnea in the NHS, NHSII and HPFS
| Physical activity, MET-hours/week |
Per 9 MET-hours/week increment | P trend | |||||
|---|---|---|---|---|---|---|---|
| <6.0 | 6.0-11.9 | 12.0-20.9 | 21.0-35.9 | ≥36.0 | |||
| NHS | |||||||
| No. of cases (N=1,720) | 609 | 359 | 326 | 260 | 166 | ||
| Person-years | 139,027 | 96,368 | 100,048 | 88,344 | 77,165 | ||
| Multivariable a | 1.00 (Ref) | 0.80 (0.70-0.91) | 0.68 (0.60-0.78) | 0.60 (0.52-0.70) | 0.46 (0.38-0.55) | 0.86 (0.83-0.89) | <.001 |
| Multivariable+metabolic factors b | 1.00 (Ref) | 0.97 (0.85-1.11) | 0.96 (0.83-1.10) | 0.91 (0.78-1.06) | 0.78 (0.65-0.94) | 0.96 (0.93-0.99) | .006 |
| Multivariable+VTE | 1.00 (Ref) | 0.80 (0.70-0.91) | 0.69 (0.60-0.79) | 0.61 (0.52-0.71) | 0.46 (0.39-0.55) | 0.86 (0.83-0.89) | <.001 |
| Fully-adjusted c | 1.00 (Ref) | 0.97 (0.85-1.11) | 0.96 (0.83-1.10) | 0.91 (0.78-1.06) | 0.78 (0.65-0.94) | 0.96 (0.93-0.99) | .007 |
| NHSII | |||||||
| No. of cases (N=4,932) | 1,702 | 1,107 | 987 | 676 | 460 | ||
| Person-years | 300,619 | 240,111 | 248,038 | 218,338 | 200,493 | ||
| Multivariable a | 1.00 (Ref) | 0.76 (0.70-0.82) | 0.64 (0.59-0.70) | 0.51 (0.47-0.56) | 0.43 (0.38-0.47) | 0.84 (0.83-0.86) | <.001 |
| Multivariable+metabolic factors b | 1.00 (Ref) | 0.89 (0.82-0.96) | 0.84 (0.77-0.91) | 0.75 (0.68-0.82) | 0.68 (0.61-0.76) | 0.93 (0.91-0.95) | <.001 |
| Multivariable+VTE | 1.00 (Ref) | 0.76 (0.70-0.82) | 0.64 (0.59-0.70) | 0.51 (0.47-0.56) | 0.43 (0.38-0.48) | 0.84 (0.83-0.86) | <.001 |
| Fully-adjusted c | 1.00 (Ref) | 0.89 (0.82-0.96) | 0.84 (0.77-0.91) | 0.75 (0.68-0.82) | 0.69 (0.61-0.76) | 0.93 (0.91-0.95) | <.001 |
| HPFS | |||||||
| No. of cases (N=2,081) | 255 | 255 | 366 | 493 | 712 | ||
| Person-years | 31,437 | 31,675 | 46,833 | 64,283 | 121,885 | ||
| Multivariable a | 1.00 (Ref) | 0.90 (0.75-1.07) | 0.84 (0.71-0.99) | 0.77 (0.66-0.90) | 0.60 (0.52-0.70) | 0.93 (0.91-0.94) | <.001 |
| Multivariable+metabolic factors b | 1.00 (Ref) | 0.97 (0.81-1.16) | 0.99 (0.84-1.16) | 0.95 (0.81-1.11) | 0.80 (0.69-0.94) | 0.96 (0.94-0.98) | <.001 |
| Multivariable+VTE | 1.00 (Ref) | 0.90 (0.75-1.07) | 0.84 (0.72-0.99) | 0.78 (0.66-0.91) | 0.60 (0.52-0.70) | 0.93 (0.91-0.94) | <.001 |
| Fully-adjusted c | 1.00 (Ref) | 0.97 (0.82-1.16) | 0.99 (0.84-1.17) | 0.95 (0.81-1.11) | 0.81 (0.69-0.94) | 0.96 (0.94-0.98) | .001 |
| Pooled | |||||||
| No. of cases (N=8,733) | 2,566 | 1,721 | 1,679 | 1,429 | 1,338 | ||
| Person-years | 471,082 | 368,154 | 394,919 | 370,965 | 399,543 | ||
| Multivariable a | 1.00 (Ref) | 0.78 (0.73-0.83) | 0.67 (0.63-0.71) | 0.57 (0.53-0.61) | 0.46 (0.43-0.50) | 0.87 (0.86-0.88) | <.001 |
| Multivariable+metabolic factors b | 1.00 (Ref) | 0.90 (0.84-0.95) | 0.86 (0.80-0.91) | 0.79 (0.74-0.85) | 0.69 (0.64-0.75) | 0.94 (0.93-0.95) | <.001 |
| Multivariable+VTE | 1.00 (Ref) | 0.78 (0.73-0.83) | 0.67 (0.63-0.72) | 0.57 (0.54-0.61) | 0.47 (0.43-0.50) | 0.87 (0.86-0.89) | <.001 |
| Fully-adjusted c | 1.00 (Ref) | 0.90 (0.84-0.96) | 0.86 (0.81-0.92) | 0.79 (0.74-0.85) | 0.69 (0.64-0.75) | 0.94 (0.93-0.95) | <.001 |
Abbreviations: NHS, Nurses’ Health Study; NHSII, Nurses’ Health Study II; HPFS, Health Professionals Follow-up Study; BMI, body mass index; VTE, venous thromboembolism.
Multivariate analyses were stratified by cohort (NHS, NHSII, and HPFS, in the pooled analyses only), age (in months) and questionnaire cycle; adjusted for race/ethnicity (White, non-White), smoking (never, past, current), menopausal status (premenopausal, postmenopausal) (women only), duration of postmenopausal hormone therapy by type (never, <5, 5 to <10, ≥10 years for estrogen-only and estrogen+progestin hormone therapy separately) (women only), alcohol consumption (none, 1-4.9, 5-14.9, 15-29.9, ≥30 g/day), Alternate Healthy Eating Index (in quintiles) and habitual sleep duration (≤5, 6, 7, 8, ≥9 hours/day).
Metabolic factors included BMI (continuous, kg/m2), waist circumference (continuous, cm), history of diabetes (yes, no), and history of hypertension (yes, no).
The fully-adjusted model included all above-mentioned covariates plus mutual adjustment of sedentary behavior (sitting watching TV, <4.0, 4.0-6.9, 7.0-13.9, 14.0-27.9, ≥28.0 hours/week).
Sedentary Behavior and Obstructive Sleep Apnea Incidence
Prolonged hours sitting watching TV or at work/away from home were associated with increased OSA incidence in NHS/NHSII women but not in HPFS men (P for heterogeneity by cohort was 0.04 for sitting watching TV and <0.001 for sitting at work/away from home). Compared to participants spending <4.0 hours/week sitting watching TV, the pooled multivariable HR (95% CI) for OSA incidence was 1.10 (1.02, 1.18) for 4.0-6.9 hours/week, 1.25 (1.18, 1.33) for 7.0-13.9 hours/week, 1.38 (1.30, 1.48) for 14.0-27.9 hours/week and 1.78 (1.60, 1.98) for >28.0 hours/week (Ptrend <0.001; Table 3). The corresponding HR (95% CI) was 1.02 (0.94, 1.11), 1.13 (1.06, 1.21), 1.27 (1.19, 1.36) and 1.49 (1.38, 1.62) for sitting hours at work/away from home (Ptrend <0.001; Table 4). After further adjusting for metabolic factors, sedentary TV viewing time was no longer associated with OSA incidence (Ptrend =0.18), whereas the positive association with sedentary hours at work/away from home was weaker but statistically significant (Ptrend <0.001). Adjustment for VTE or total physical activity had little impact on these associations.
Table 3.
Sitting watching TV and risk of incident obstructive sleep apnea in the NHS, NHSII and HPFS
| Sitting watching TV, hours/week |
Per 7 hours/week increment | P trend | |||||
|---|---|---|---|---|---|---|---|
| <4.0 | 4.0-6.9 | 7.0-13.9 | 14.0-27.9 | ≥28.0 | |||
| NHS | |||||||
| No. of cases (N=1,720) | 244 | 244 | 543 | 512 | 177 | ||
| Person-years | 89,426 | 75,850 | 156,933 | 138,335 | 40,408 | ||
| Multivariate a | 1.00 (Ref) | 1.12 (0.94-1.34) | 1.22 (1.05-1.42) | 1.32 (1.13-1.54) | 1.68 (1.38-2.04) | 1.12 (1.08-1.17) | <.001 |
| Multivariate+metabolic factors b | 1.00 (Ref) | 1.06 (0.89-1.27) | 1.07 (0.92-1.24) | 1.02 (0.87-1.20) | 1.14 (0.93-1.39) | 1.02 (0.97-1.06) | .50 |
| Multivariate+VTE | 1.00 (Ref) | 1.12 (0.94-1.34) | 1.22 (1.05-1.42) | 1.32 (1.13-1.54) | 1.14 (0.93-1.39) | 1.12 (1.08-1.17) | <.001 |
| Fully-adjusted c | 1.00 (Ref) | 1.07 (0.89-1.28) | 1.07 (0.92-1.25) | 1.03 (0.88-1.20) | 1.13 (0.93-1.38) | 1.01 (0.97-1.06) | .52 |
| NHSII | |||||||
| No. of cases (N=4,932) | 1,113 | 818 | 1,687 | 1,075 | 239 | ||
| Person-years | 433,266 | 137,310 | 368,392 | 216,540 | 52,091 | ||
| Multivariate a | 1.00 (Ref) | 1.08 (0.98-1.19) | 1.32 (1.22-1.42) | 1.52 (1.40-1.66) | 1.98 (1.71-2.28) | 1.21 (1.17-1.25) | <.001 |
| Multivariate+metabolic factors b | 1.00 (Ref) | 0.99 (0.90-1.09) | 1.08 (1.00-1.17) | 1.03 (0.94-1.12) | 1.05 (0.91-1.22) | 1.01 (0.98-1.04) | .48 |
| Multivariate+VTE | 1.00 (Ref) | 1.08 (0.99-1.19) | 1.32 (1.22-1.43) | 1.52 (1.40-1.66) | 1.96 (1.70-2.26) | 1.21 (1.17-1.25) | <.001 |
| Fully-adjusted c | 1.00 (Ref) | 0.99 (0.90-1.10) | 1.08 (1.00-1.17) | 1.01 (0.93-1.11) | 1.03 (0.89-1.19) | 1.01 (0.97-1.04) | .75 |
| HPFS | |||||||
| No. of cases (N=2,081) | 380 | 431 | 773 | 465 | 32 | ||
| Person-years | 58,732 | 62,308 | 107,414 | 63,435 | 4,218 | ||
| Multivariate a | 1.00 (Ref) | 1.03 (0.90-1.19) | 1.07 (0.95-1.21) | 1.11 (0.97-1.28) | 1.22 (0.85-1.77) | 1.05 (0.99-1.11) | .08 |
| Multivariate+metabolic factors b | 1.00 (Ref) | 0.99 (0.86-1.14) | 0.99 (0.87-1.12) | 0.96 (0.84-1.11) | 0.95 (0.66-1.37) | 0.98 (0.93-1.04) | .55 |
| Multivariate+VTE | 1.00 (Ref) | 1.03 (0.90-1.19) | 1.07 (0.94-1.21) | 1.11 (0.97-1.28) | 1.22 (0.85-1.77) | 1.05 (0.99-1.11) | .08 |
| Fully-adjusted c | 1.00 (Ref) | 1.00 (0.87-1.15) | 1.00 (0.88-1.13) | 0.97 (0.85-1.12) | 0.95 (0.65-1.37) | 0.99 (0.93-1.04) | .62 |
| Pooled | |||||||
| No. of cases (N=8,733) | 1,737 | 1,493 | 3,003 | 2,052 | 448 | ||
| Person-years | 581,424 | 275,468 | 632,739 | 418,310 | 96,717 | ||
| Multivariate a | 1.00 (Ref) | 1.10 (1.02-1.18) | 1.25 (1.18-1.33) | 1.38 (1.30-1.48) | 1.78 (1.60-1.98) | 1.16 (1.13-1.19) | <.001 |
| Multivariate+metabolic factors b | 1.00 (Ref) | 1.01 (0.94-1.09) | 1.06 (1.00-1.13) | 1.02 (0.96-1.09) | 1.10 (0.99-1.23) | 1.02 (0.99-1.04) | .18 |
| Multivariate+VTE | 1.00 (Ref) | 1.10 (1.02-1.18) | 1.25 (1.18-1.33) | 1.39 (1.30-1.48) | 1.77 (1.59-1.97) | 1.16 (1.13-1.18) | <.001 |
| Fully-adjusted c | 1.00 (Ref) | 1.02 (0.94-1.09) | 1.06 (1.00-1.13) | 1.02 (0.95-1.09) | 1.09 (0.98-1.21) | 1.01 (0.99-1.04) | .28 |
Abbreviations: NHS, Nurses’ Health Study; NHSII, Nurses’ Health Study II; HPFS, Health Professionals Follow-up Study; BMI, body mass index; PA, physical activity; VTE, venous thromboembolism.
Multivariate analyses were stratified by cohort (NHS, NHSII, and HPFS, in the pooled analyses only), age (in months) and questionnaire cycle; adjusted for race/ethnicity (White, non-White), smoking (never, past, current), menopausal status (premenopausal, postmenopausal) (women only), duration of postmenopausal hormone therapy by type (never, <5, 5 to <10, ≥10 years for estrogen-only and estrogen+progestin hormone therapy separately) (women only), alcohol consumption (none, 1-4.9, 5-14.9, 15-29.9, ≥30 g/day), Alternate Healthy Eating Index (in quintiles) and habitual sleep duration (≤5, 6, 7, 8, ≥9 hours/day).
Metabolic factors included BMI (continuous, kg/m2), waist circumference (continuous, cm), history of diabetes (yes, no), and history of hypertension (yes, no).
The fully-adjusted model included all above-mentioned covariates plus mutual adjustment of PA (<6.0, 6.0-11.9, 12.0-20.9, 21.0-35.9, ≥36.0 MET-hours/week).
Table 4.
Sitting at work/away from home and risk of incident obstructive sleep apnea in the NHS, NHSII and HPFS
| Sitting at work/away from home, hours/week |
Per 7 hours/week increment | P trend | |||||
|---|---|---|---|---|---|---|---|
| <4.0 | 4.0-6.9 | 7.0-13.9 | 14.0-27.9 | ≥28.0 | |||
| NHS | |||||||
| No. of cases (N=1,720) | 370 | 233 | 502 | 411 | 204 | ||
| Person-years | 161,071 | 62,306 | 131,328 | 98,618 | 47,627 | ||
| Multivariate a | 1.00 (Ref) | 1.10 (0.93-1.30) | 1.31 (1.15-1.51) | 1.42 (1.23-1.64) | 1.75 (1.47-2.09) | 1.15 (1.10-1.20) | <.001 |
| Multivariate+metabolic factors b | 1.00 (Ref) | 1.11 (0.93-1.31) | 1.29 (1.12-1.48) | 1.32 (1.14-1.53) | 1.51 (1.26-1.80) | 1.10 (1.06-1.15) | <.001 |
| Multivariate+VTE | 1.00 (Ref) | 1.10 (0.92-1.30) | 1.31 (1.14-1.51) | 1.42 (1.23-1.64) | 1.75 (1.47-2.08) | 1.15 (1.10-1.20) | <.001 |
| Fully-adjusted c | 1.00 (Ref) | 1.12 (0.94-1.32) | 1.3 (1.13-1.49) | 1.33 (1.15-1.54) | 1.51 (1.26-1.80) | 1.10 (1.06-1.15) | <.001 |
| NHSII | |||||||
| No. of cases (N=4,932) | 486 | 471 | 1,510 | 1,712 | 753 | ||
| Person-years | 238,184 | 83,124 | 373,031 | 344,174 | 169,087 | ||
| Multivariate a | 1.00 (Ref) | 1.02 (0.89-1.17) | 1.15 (1.04-1.28) | 1.36 (1.23-1.52) | 1.64 (1.46-1.84) | 1.14 (1.11-1.16) | <.001 |
| Multivariate+metabolic factors b | 1.00 (Ref) | 1.06 (0.93-1.22) | 1.11 (1.00-1.24) | 1.21 (1.08-1.34) | 1.26 (1.12-1.42) | 1.06 (1.03-1.08) | <.001 |
| Multivariate+VTE | 1.00 (Ref) | 1.02 (0.89-1.17) | 1.15 (1.03-1.28) | 1.37 (1.23-1.52) | 1.65 (1.46-1.85) | 1.14 (1.11-1.17) | <.001 |
| Fully-adjusted c | 1.00 (Ref) | 1.07 (0.94-1.23) | 1.12 (1.01-1.25) | 1.21 (1.09-1.35) | 1.26 (1.12-1.41) | 1.05 (1.03-1.08) | <.001 |
| HPFS | |||||||
| No. of cases (N=2,081) | 545 | 251 | 429 | 640 | 216 | ||
| Person-years | 81,605 | 34,695 | 57,770 | 88,348 | 33,689 | ||
| Multivariate a | 1.00 (Ref) | 1.00 (0.86-1.16) | 1.00 (0.88-1.14) | 1.00 (0.89-1.13) | 1.03 (0.88-1.22) | 1.01 (0.97-1.04) | .73 |
| Multivariate+metabolic factors b | 1.00 (Ref) | 1.01 (0.87-1.18) | 0.98 (0.86-1.12) | 0.99 (0.88-1.12) | 1.01 (0.85-1.19) | 1.00 (0.97-1.03) | .98 |
| Multivariate+VTE | 1.00 (Ref) | 1.00 (0.86-1.16) | 1.00 (0.88-1.14) | 1.00 (0.89-1.13) | 1.03 (0.87-1.22) | 1.01 (0.97-1.04) | .73 |
| Fully-adjusted c | 1.00 (Ref) | 1.01 (0.87-1.18) | 0.98 (0.86-1.11) | 0.99 (0.88-1.12) | 1.00 (0.85-1.18) | 1.00 (0.97-1.03) | .92 |
| Pooled | |||||||
| No. of cases (N=8,733) | 1,401 | 955 | 2,441 | 2,763 | 1,173 | ||
| Person-years | 480,860 | 180,125 | 562,129 | 531,141 | 250,403 | ||
| Multivariate a | 1.00 (Ref) | 1.02 (0.94-1.11) | 1.13 (1.06-1.21) | 1.27 (1.19-1.36) | 1.49 (1.38-1.62) | 1.11 (1.09-1.13) | <.001 |
| Multivariate+metabolic factors b | 1.00 (Ref) | 1.05 (0.96-1.14) | 1.11 (1.03-1.19) | 1.18 (1.10-1.26) | 1.27 (1.17-1.37) | 1.06 (1.04-1.08) | <.001 |
| Multivariate+VTE | 1.00 (Ref) | 1.02 (0.94-1.11) | 1.13 (1.05-1.21) | 1.27 (1.19-1.36) | 1.49 (1.38-1.62) | 1.11 (1.09-1.13) | <.001 |
| Fully-adjusted c | 1.00 (Ref) | 1.06 (0.97-1.15) | 1.11 (1.04-1.19) | 1.18 (1.10-1.27) | 1.26 (1.16-1.37) | 1.06 (1.04-1.08) | <.001 |
Abbreviations: NHS, Nurses’ Health Study; NHSII, Nurses’ Health Study II; HPFS, Health Professionals Follow-up Study; BMI, body mass index; PA, physical activity; VTE, venous thromboembolism.
Multivariate analyses were stratified by cohort (NHS, NHSII, and HPFS, in the pooled analyses only), age (in months) and questionnaire cycle; adjusted for race/ethnicity (White, non-White), smoking (never, past, current), menopausal status (premenopausal, postmenopausal) (women only), duration of postmenopausal hormone therapy by type (never, <5, 5 to <10, ≥10 years for estrogen-only and estrogen+progestin hormone therapy separately) (women only), alcohol consumption (none, 1-4.9, 5-14.9, 15-29.9, ≥30 g/day), Alternate Healthy Eating Index (in quintiles) and habitual sleep duration (≤5, 6, 7, 8, ≥9 hours/day).
Metabolic factors included BMI (continuous, kg/m2), waist circumference (continuous, cm), history of diabetes (yes, no), and history of hypertension (yes, no).
The fully-adjusted model included all above-mentioned covariates plus mutual adjustment of PA (<6.0, 6.0-11.9, 12.0-20.9, 21.0-35.9, ≥36.0 MET-hours/week).
Stratified Analyses and joint associations
In subgroup analysis, there was significant effect modification by age, sex and BMI for the association between physical activity and OSA incidence (Figure 1A), with stronger inverse associations observed for women and those <65 years of age or with BMI ≥25 kg/m2 compared with their counterparts (P for interaction <0.001 for all). Similar subgroup heterogeneity by age and sex was observed for sitting watching TV (Figure 1B), which was more strongly positively associated with OSA incidence in women versus men (P for interaction =0.001) and in younger versus older individuals (P for interaction <0.001). The positive association between sitting at work/away from home and OSA incidence was stronger in women versus men (P for interaction <0.001), in individuals with BMI ≥25 kg/m2 versus <25 kg/m2 (P for interaction =0.002) or in individuals with low versus high physical activity (P for interaction <0.001; Figure 1 C).
Figure 1. Association of physical activity and sedentary behavior with risk of incident obstructive sleep apnea according to age and lifestyle factors.
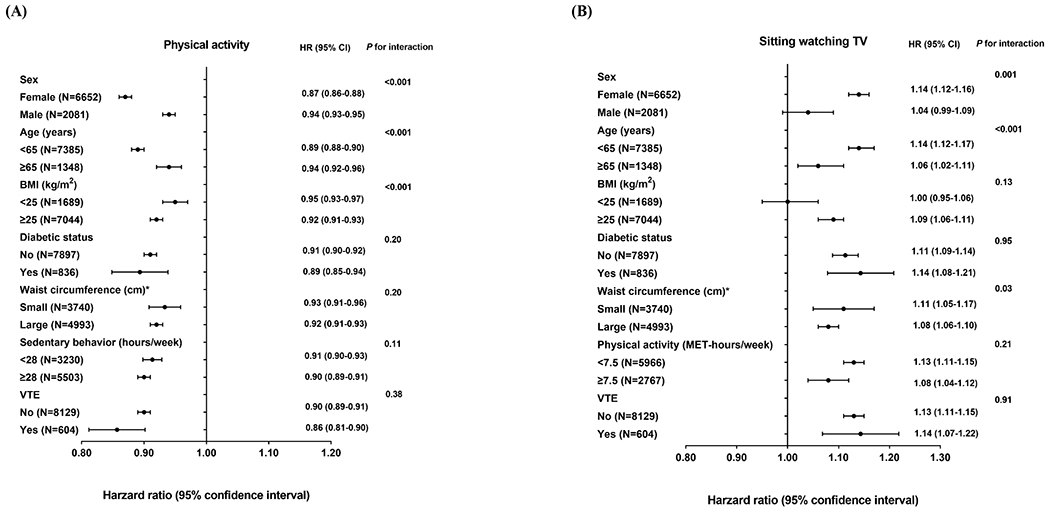
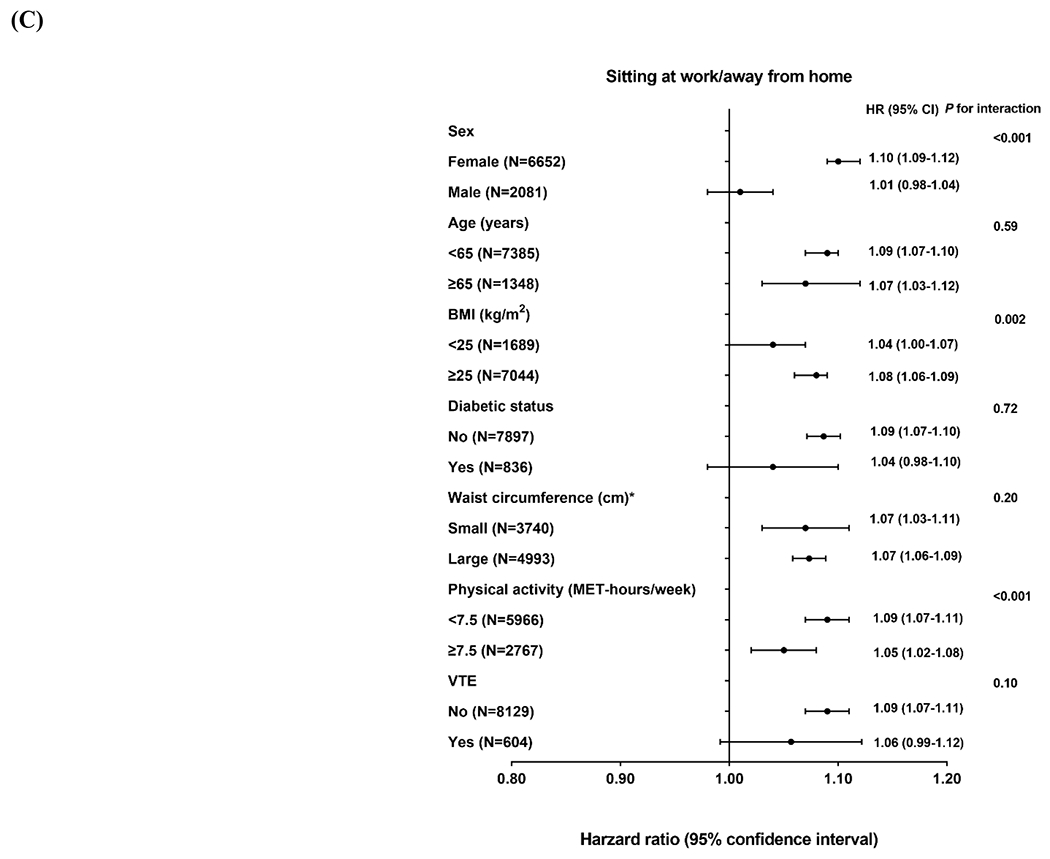
Hazard ratio represents (A) per 9 MET-hours/week increment of total physical activity, (B) per 7 hours/week increment of sitting watching TV and (C) per 7 hours/week increment of sitting at work/away from home. Multivariate analyses were stratified by cohort (NHS, NHSII, and HPFS), age (in months) and questionnaire cycle; adjusted for race/ethnicity (White, non-White), smoking (never, past, current), menopausal status (premenopausal, postmenopausal) (women only), duration of postmenopausal hormone therapy by type (never, <5, 5 to <10, ≥10 years for estrogen-only and estrogen+progestin hormone therapy separately) (women only), alcohol consumption (none, 1-4.9, 5-14.9, 15-29.9, ≥30 g/day), Alternate Healthy Eating Index (in quintiles) and habitual sleep duration (≤5, 6, 7, 8, ≥9 hours/day). Likelihood ratio test was used to calculate the P for interaction. *The sex-specific cutoff point of waist circumference was 88 cm for women and 102 cm for men.
Compared with individuals with high physical activity levels and low TV viewing hours, those who were physically inactive with high TV viewing hours had the highest OSA incidence (fully-adjusted HR: 1.24; 95% CI: 1.08, 1.42; Table 5). Physical inactivity in the absence of high TV viewing hours was also associated with increased OSA incidence (HR: 1.18; 95% CI: 1.13, 1.24), whereas the association with high TV viewing hours in the absence of physical inactivity was not statistically significant (HR: 1.06; 95% CI: 0.92, 1.22). However, there was no multiplicative interaction between physical activity and sedentary TV viewing time on OSA incidence (P for interaction =0.91).
Table 5.
Joint associations of physical activity and sitting watching TV with obstructive sleep apnea incidence in the pooled NHS, NHSII and HPFS
| NHS, NHSII and HPFS (Pooled) | Joint associations according to physical activity and sitting watching TV |
P interaction e | |||
|---|---|---|---|---|---|
| Physical inactivity and low TV watching hours d | High physical activity and low TV watching hours d | Physical inactivity and high TV watching hours d | High physical activity and high TV watching hours d | ||
| Cases | 2775 | 5510 | 214 | 234 | |
| Person-years | 522,607 | 1385,333 | 55,949 | 40,769 | |
| Multivariate a | 1.55 (1.47-1.62) | 1.00 (Ref) | 2.13 (1.86-2.43) | 1.42 (1.23-1.63) | .76 |
| Multivariate+metabolic factors b | 1.18 (1.13-1.24) | 1.00 (Ref) | 1.24 (1.09-1.43) | 1.06 (0.92-1.22) | .94 |
| Multivariate+VTE | 1.54 (1.46-1.61) | 1.00 (Ref) | 2.13 (1.86-2.44) | 1.43 (1.25-1.65) | .73 |
| Fully-adjusted c | 1.18 (1.13-1.24) | 1.00 (Ref) | 1.24 (1.08-1.42) | 1.06 (0.92-1.22) | .91 |
Abbreviations: NHS, Nurses’ Health Study; NHSII, Nurses’ Health Study II; HPFS, Health Professionals Follow-up Study; BMI, body mass index; VTE, venous thromboembolism.
Multivariate analyses were stratified by cohort (NHS, NHSII, and HPFS), age (in months) and questionnaire cycle; adjusted for race/ethnicity (White, non-White), smoking (never, past, current), menopausal status (premenopausal, postmenopausal) (women only), duration of postmenopausal hormone therapy by type (never, <5, 5 to <10, ≥10 years for estrogen-only and estrogen+progestin hormone therapy separately) (women only), alcohol consumption (none, 1-4.9, 5-14.9, 15-29.9, ≥30 g/day), Alternate Healthy Eating Index (in quintiles) and habitual sleep duration (≤5, 6, 7, 8, ≥9 hours/day).
Metabolic factors included BMI (continuous, kg/m2), waist circumference (continuous, cm), history of diabetes (yes, no), and history of hypertension (yes, no).
The fully-adjusted model included all above-mentioned covariates.
Physical activity were dichotomized into low category (<7.5 MET-hours/week) versus high category (>7.5 MET-hours/week), and sitting watching TV were dichotomized into low category (<28 hours/week) versus high category (≥28 hours/week), resulting in four categories (physical inactivity and low TV watching hours, physical inactivity and high TV watching hours, high physical activity and low TV watching hours, and high physical activity and high TV watching hours).
P-value for interaction was calculated using the multiplicative term between low/high categories of physical activity and sitting watching TV.
Other Analyses
When examining the associations with OSA characterized by presence of EDS, the results were similar to the overall associations in the primary analyses, although these associations did not reach statistical significance after adjusting for metabolic factors (Supplementary Tables 4–5). In the latency analyses with a lagged period of 2-4 years, the pooled associations remained largely unchanged (Supplementary Tables 6–7).
Discussion
In the present study, higher levels of physical activity and fewer hours of TV watching and sitting at work/away from home were associated with lower OSA incidence after accounting for potential confounders. Metabolic factors partly explained the associations with physical activity and sitting hours at work/away from home but fully attenuated the association with sitting hours watching TV. This suggests that the potential mediating role of metabolic factors in the association between sedentary behavior and OSA incidence may depend on type of sedentary behavior. Further, these associations were consistently stronger among women and those who were overweight or obese. To our knowledge, our present study is the largest prospective cohort study to date that comprehensively examined the associations of physical activity and sedentary behavior with OSA incidence, supporting potential benefits of an active lifestyle on OSA prevention.
Comparison with Other Studies
Prior epidemiologic evidence regarding the associations of physical activity or sedentary behavior with OSA has been largely cross-sectional. Although five previous observational studies on physical activity and OSA generally reported consistent inverse associations [10–14], there was only one prospective study [14]. Similar to our findings, two relatively small cross-sectional observational investigations suggested higher OSA prevalence and severity associated with prolonged sedentary time, and observed the highest OSA prevalence in individuals with high sedentary time and low physical activity [27, 28]. Our study added important prospective evidence to existing cross-sectional studies, and highlighted the independent contribution of low physical activity levels and sedentary behavior to OSA development. Further, we found that both moderate and vigorous physical activity, as well as sedentary behavior in different settings, were associated with OSA incidence. Coupled with clinical evidence of marked improvement of OSA after lifestyle intervention (including physical activity counseling) [15–18], our results suggest that promoting an active lifestyle may have substantial benefits for both prevention and treatment of OSA.
Biological mechanisms
High physical activity levels and low sedentary hours may lower OSA incidence by reducing adiposity and inflammation and improving metabolic function. This was supported by the consistent attenuation in the associations after adjusting for metabolic factors. On the other hand, rostral fluid shift has been suggested to promote OSA development. Evidence from prior studies supports a mechanism by which more physical activity and less sedentary time can reduce peripheral fluid retention, potentially decreasing OSA incidence and severity [18, 22–26]. While VTE may be potentially correlated with lower-extremity edema, adjustment for VTE did not appreciably change our results in the analysis. This may be explained by the fact that VTE is unlikely a sensitive measure of body fluid retention resulting from low physical activity levels or sedentary behavior.
Interestingly, adjustment of metabolic factors appeared to have differential impact on the associations with sedentary TV viewing time versus with sedentary time at work/away from home. One potential explanation was that sitting hours watching TV were more strongly correlated with metabolic factors than sitting hours at work/away from home (Supplementary Table 8), which resulted in more attenuation in the association after adjustment. As a “screen exposure”, TV watching was more likely to occur later in the day and closer to sleep compared to sitting at work/away from home, the timing of which may more easily cause sleep deprivation and circadian misalignment, and therefore amplify metabolic dysfunction/inflammation and ultimately influence the occurrence of OSA [34]. In light of growing evidence supporting context-specific associations of sedentary behavior with other health outcomes [19], more studies are needed to confirm our findings on OSA, address the role of TV watching (timing), and further explore the underlying mechanisms.
Strengths and Limitations
Our study had several major strengths. First, the prospective design, large sample size, and long follow-up provided sufficient statistical power to estimate the associations. Second, detailed exposure assessment provided an opportunity to examine different aspects of physical activity and sedentary behavior and their potential interactions in relation to OSA incidence. We were also able to utilize repeated longitudinal assessment and derive cumulatively updated measures to reflect long-term exposure levels. Third, validated, time-varying information on a wide range of covariates allowed us to finely control for confounding. Lastly, the nature of our study participants (all healthcare professionals) in conjunction with the high reliability of self-reported OSA diagnosis minimized the potential confounding by socioeconomic status and further ensured data quality and internal validity [31].
This analysis also had several limitations. First, due to the observational study design, we cannot determine whether the observed associations were causal. Second, the ethnic/professional/socioeconomic homogeneities of the study population may limit generalizability of current findings. Third, OSA diagnoses were identified through self-reports, and we cannot rule out the impact of clinically undiagnosed OSA and differential OSA diagnosis on our results, despite lower rates of underdiagnosis and higher accuracy of self-reports in our cohorts of healthcare professionals [31]. Fourth, information on OSA severity and treatment was not available in our cohorts. Lastly, our physical activity assessment focused on recreational exercise, and did not include physical activity in other settings (e.g., occupational). Also, we only had data on two types of sedentary behavior, which may not accurately represent total sedentary behavior [35]. Future studies with objectively measured (e.g., device-based) active/inactive patterns are needed to evaluate these prospective associations in greater details.
Conclusion
In summary, this large prospective cohort study highlights the potential role of maintaining an active lifestyle in reducing OSA incidence. Further investigations are warranted to replicate our findings and to elucidate the underlying biological mechanism for the observed associations.
Supplementary Material
Funding/Support:
The Nurses’ Health Study, Nurses’ Health Study II, and Health Professionals Follow-up Study were supported by grants UM1 CA186107, U01 CA176726, and U01 CA167552 from the National Institutes of Health (NIH). This work was additionally supported by NIH grants R35 HL135818 (Dr Redline), and K01 HL143034 (Dr Huang). The funders had no role of in the design and conduct of the study, in the collection, analysis, and interpretation of the data, and in the preparation, review, or approval of the manuscript. The authors assume full responsibility for analyses and interpretation of these data.
Role of the Funder/Sponsor:
The funding sources played no role in the study design, data collection, data analysis, and interpretation of results, or the decisions made in preparation and submission of the article.
Additional Contributions:
The authors thank all participants and staff of the Nurses’ Health Study, Nurses’ Health Study II, and Health Professionals Follow-up Study for their contributions to this research. We are grateful for help from the following state cancer registries: Alabama, Arizona, Arkansas, California, Colorado, Connecticut, Delaware, Florida, Georgia, Idaho, Illinois, Indiana, Iowa, Kentucky, Louisiana, Maine, Maryland, Massachusetts, Michigan, Nebraska, New Hampshire, New Jersey, New York, North Carolina, North Dakota, Ohio, Oklahoma, Oregon, Pennsylvania, Rhode Island, South Carolina, Tennessee, Texas, Virginia, Washington, and Wyoming.
Footnotes
Conflict of Interest Disclosures: The authors declare no conflict of interest.
Publisher's Disclaimer: Disclaimer: The content is solely the responsibility of the authors and does not necessarily represent the views of the National Institutes of Health.
References
- 1.Peppard PE, Young T, Barnet JH, Palta M, Hagen EW, Hla KM. Increased prevalence of sleep-disordered breathing in adults. Am J Epidemiol 2013: 177(9): 1006–1014. [DOI] [PMC free article] [PubMed] [Google Scholar]
- 2.Yaggi HK, Concato J, Kernan WN, Lichtman JH, Brass LM, Mohsenin V. Obstructive sleep apnea as a risk factor for stroke and death. N Engl J Med 2005: 353(19): 2034–2041. [DOI] [PubMed] [Google Scholar]
- 3.Kendzerska T, Gershon AS, Hawker G, Tomlinson G, Leung RS. Obstructive sleep apnea and incident diabetes. A historical cohort study. Am J Respir Crit Care Med 2014: 190(2): 218–225. [DOI] [PubMed] [Google Scholar]
- 4.Gottlieb DJ, Yenokyan G, Newman AB, O’Connor GT, Punjabi NM, Quan SF, Redline S, Resnick HE, Tong EK, Diener-West M, Shahar E. Prospective study of obstructive sleep apnea and incident coronary heart disease and heart failure: the sleep heart health study. Circulation 2010: 122(4): 352–360. [DOI] [PMC free article] [PubMed] [Google Scholar]
- 5.Nagayoshi M, Punjabi NM, Selvin E, Pankow JS, Shahar E, Iso H, Folsom AR, Lutsey PL. Obstructive sleep apnea and incident type 2 diabetes. Sleep Med 2016: 25: 156–161. [DOI] [PMC free article] [PubMed] [Google Scholar]
- 6.Huang T, Lin BM, Stampfer MJ, Tworoger SS, Hu FB, Redline S. A Population-Based Study of the Bidirectional Association Between Obstructive Sleep Apnea and Type 2 Diabetes in Three Prospective U.S. Cohorts. Diabetes care 2018: 41(10): 2111–2119. [DOI] [PMC free article] [PubMed] [Google Scholar]
- 7.Huang T, Lin BM, Stampfer MJ, Schernhammer ES, Saxena R, Tworoger SS, Redline S. Associations of Self-reported Obstructive Sleep Apnea with Total and Site-specific Cancer Risk in Older Women: A Prospective Study. Sleep 2020. [DOI] [PMC free article] [PubMed] [Google Scholar]
- 8.Javaheri S, Barbe F, Campos-Rodriguez F, Dempsey JA, Khayat R, Javaheri S, Malhotra A, Martinez-Garcia MA, Mehra R, Pack AI, Polotsky VY, Redline S, Somers VK. Sleep Apnea: Types, Mechanisms, and Clinical Cardiovascular Consequences. J Am Coll Cardiol 2017: 69(7): 841–858. [DOI] [PMC free article] [PubMed] [Google Scholar]
- 9.Reutrakul S, Mokhlesi B. Obstructive Sleep Apnea and Diabetes: A State of the Art Review. Chest 2017: 152(5): 1070–1086. [DOI] [PMC free article] [PubMed] [Google Scholar]
- 10.Murillo R, Reid KJ, Arredondo EM, Cai J, Gellman MD, Gotman NM, Marquez DX, Penedo FJ, Ramos AR, Zee PC, Daviglus ML. Association of self-reported physical activity with obstructive sleep apnea: Results from the Hispanic Community Health Study/Study of Latinos (HCHS/SOL). Prev Med 2016: 93: 183–188. [DOI] [PMC free article] [PubMed] [Google Scholar]
- 11.Billings ME, Johnson DA, Simonelli G, Moore K, Patel SR, Diez Roux AV, Redline S. Neighborhood Walking Environment and Activity Level Are Associated With OSA: The Multi-Ethnic Study of Atherosclerosis. Chest 2016: 150(5): 1042–1049. [DOI] [PMC free article] [PubMed] [Google Scholar]
- 12.Hall KA, Singh M, Mukherjee S, Palmer LJ. Physical activity is associated with reduced prevalence of self-reported obstructive sleep apnea in a large, general population cohort study. J Clin Sleep Med 2020: 16(7): 1179–1187. [DOI] [PMC free article] [PubMed] [Google Scholar]
- 13.Peppard PE, Young T. Exercise and sleep-disordered breathing: an association independent of body habitus. Sleep 2004: 27(3): 480–484. [DOI] [PubMed] [Google Scholar]
- 14.Awad KM, Malhotra A, Barnet JH, Quan SF, Peppard PE. Exercise is associated with a reduced incidence of sleep-disordered breathing. Am J Med 2012: 125(5): 485–490. [DOI] [PMC free article] [PubMed] [Google Scholar]
- 15.Tuomilehto H, Seppa J, Uusitupa M, Tuomilehto J, Gylling H, Kuopio Sleep Apnea G. Weight reduction and increased physical activity to prevent the progression of obstructive sleep apnea: A 4-year observational postintervention follow-up of a randomized clinical trial. [corrected]. JAMA Intern Med 2013: 173(10): 929–930. [DOI] [PubMed] [Google Scholar]
- 16.Tuomilehto H, Gylling H, Peltonen M, Martikainen T, Sahlman J, Kokkarinen J, Randell J, Tukiainen H, Vanninen E, Partinen M, Tuomilehto J, Uusitupa M, Seppa J, Kuopio Sleep Apnea G. Sustained improvement in mild obstructive sleep apnea after a diet- and physical activity-based lifestyle intervention: postinterventional follow-up. Am J Clin Nutr 2010: 92(4): 688–696. [DOI] [PubMed] [Google Scholar]
- 17.Mendelson M, Bailly S, Marillier M, Flore P, Borel JC, Vivodtzev I, Doutreleau S, Verges S, Tamisier R, Pepin JL. Obstructive Sleep Apnea Syndrome, Objectively Measured Physical Activity and Exercise Training Interventions: A Systematic Review and Meta-Analysis. Front Neurol 2018: 9: 73. [DOI] [PMC free article] [PubMed] [Google Scholar]
- 18.Mendelson M, Lyons OD, Yadollahi A, Inami T, Oh P, Bradley TD. Effects of exercise training on sleep apnoea in patients with coronary artery disease: a randomised trial. Eur Respir J 2016: 48(1): 142–150. [DOI] [PubMed] [Google Scholar]
- 19.Biswas A, Oh PI, Faulkner GE, Bajaj RR, Silver MA, Mitchell MS, Alter DA. Sedentary time and its association with risk for disease incidence, mortality, and hospitalization in adults: a systematic review and meta-analysis. Ann Intern Med 2015: 162(2): 123–132. [DOI] [PubMed] [Google Scholar]
- 20.Dempsey JA, Veasey SC, Morgan BJ, O’Donnell CP. Pathophysiology of sleep apnea. Physiol Rev 2010: 90(1): 47–112. [DOI] [PMC free article] [PubMed] [Google Scholar]
- 21.Huang T, Goodman M, Li X, Sands SA, Li J, Stampfer MJ, Saxena R, Tworoger SS, Redline S. C-reactive protein and risk of obstructive sleep apnea in four US cohorts. Chest 2021. [DOI] [PMC free article] [PubMed] [Google Scholar]
- 22.Yumino D, Redolfi S, Ruttanaumpawan P, Su MC, Smith S, Newton GE, Mak S, Bradley TD. Nocturnal rostral fluid shift: a unifying concept for the pathogenesis of obstructive and central sleep apnea in men with heart failure. Circulation 2010: 121(14): 1598–1605. [DOI] [PubMed] [Google Scholar]
- 23.Redolfi S, Yumino D, Ruttanaumpawan P, Yau B, Su MC, Lam J, Bradley TD. Relationship between overnight rostral fluid shift and Obstructive Sleep Apnea in nonobese men. Am J Respir Crit Care Med 2009: 179(3): 241–246. [DOI] [PubMed] [Google Scholar]
- 24.Redolfi S, Bettinzoli M, Venturoli N, Ravanelli M, Pedroni L, Taranto-Montemurro L, Arnulf I, Similowski T, Tantucci C. Attenuation of obstructive sleep apnea and overnight rostral fluid shift by physical activity. Am J Respir Crit Care Med 2015: 191(7): 856–858. [DOI] [PubMed] [Google Scholar]
- 25.Perger E, Jutant EM, Redolfi S. Targeting volume overload and overnight rostral fluid shift: A new perspective to treat sleep apnea. Sleep Med Rev 2018: 42: 160–170. [DOI] [PubMed] [Google Scholar]
- 26.da Silva BC, Kasai T, Coelho FM, Zatz R, Elias RM. Fluid Redistribution in Sleep Apnea: Therapeutic Implications in Edematous States. Front Med (Lausanne) 2017: 4: 256. [DOI] [PMC free article] [PubMed] [Google Scholar]
- 27.Buman MP, Kline CE, Youngstedt SD, Phillips B, Tulio de Mello M, Hirshkowitz M. Sitting and television viewing: novel risk factors for sleep disturbance and apnea risk? results from the 2013 National Sleep Foundation Sleep in America Poll. Chest 2015: 147(3): 728–734. [DOI] [PMC free article] [PubMed] [Google Scholar]
- 28.Kline CE, Krafty RT, Mulukutla S, Hall MH. Associations of sedentary time and moderate-vigorous physical activity with sleep-disordered breathing and polysomnographic sleep in community-dwelling adults. Sleep Breath 2017: 21(2): 427–434. [DOI] [PMC free article] [PubMed] [Google Scholar]
- 29.Wolf AM, Hunter DJ, Colditz GA, Manson JE, Stampfer MJ, Corsano KA, Rosner B, Kriska A, Willett WC. Reproducibility and validity of a self-administered physical activity questionnaire. Int J Epidemiol 1994: 23(5): 991–999. [DOI] [PubMed] [Google Scholar]
- 30.Chasan-Taber S, Rimm EB, Stampfer MJ, Spiegelman D, Colditz GA, Giovannucci E, Ascherio A, Willett WC. Reproducibility and validity of a self-administered physical activity questionnaire for male health professionals. Epidemiology 1996: 7(1): 81–86. [DOI] [PubMed] [Google Scholar]
- 31.Huang T, Lin BM, Markt SC, Stampfer MJ, Laden F, Hu FB, Tworoger SS, Redline S. Sex differences in the associations of obstructive sleep apnoea with epidemiologic factors. The European respiratory journal 2018. [DOI] [PMC free article] [PubMed] [Google Scholar]
- 32.Huang T, Lin BM, Redline S, Curhan GC, Hu FB, Tworoger SS. Type of Menopause, Age at Menopause, and Risk of Developing Obstructive Sleep Apnea in Postmenopausal Women. American journal of epidemiology 2018. [DOI] [PMC free article] [PubMed] [Google Scholar]
- 33.U.S. Department of Health and Human Services. Physical Activity Guidelines for Americans. 2019. [cited; Available from: https://health.gov/sites/default/files/2019-09/Physical_Activity_Guidelines_2nd_edition.pdf]
- 34.Gabriel BM, Zierath JR. Circadian rhythms and exercise - re-setting the clock in metabolic disease. Nat Rev Endocrinol 2019: 15(4): 197–206. [DOI] [PubMed] [Google Scholar]
- 35.Clark BK, Healy GN, Winkler EA, Gardiner PA, Sugiyama T, Dunstan DW, Matthews CE, Owen N. Relationship of television time with accelerometer-derived sedentary time: NHANES. Med Sci Sports Exerc 2011: 43(5): 822–828. [DOI] [PMC free article] [PubMed] [Google Scholar]
Associated Data
This section collects any data citations, data availability statements, or supplementary materials included in this article.