

Summary
Communication within the glial cell ecosystem is essential to neuronal and brain health1–3. In Alzheimer’s disease, progressive neurodegeneration is characterized by β-amyloid (Aβ) deposition and neurofibrillary tau formation. The influence of glial cells on Aβ and tau accumulation and clearance is poorly understood, despite growing awareness that these are important interactions with potential for therapeutic intervention4,5. Here we show, in mice and humans, that astrocyte-sourced interleukin-3 (IL-3) reprograms microglia to ameliorate Alzheimer’s disease pathology. Upon recognition of Aβ deposits, microglia augment IL-3Rɑ, IL-3’s specific receptor, rendering them responsive to IL-3. Astrocytes constitutively produce IL-3, which elicits transcriptional, morphological, and functional reprograming of microglia endowing them with an acute immune response program, enhanced motility, and the capacity to cluster and clear Aβ and tau aggregates. These changes restrict Alzheimer’s disease pathology and cognitive decline. This study identifies IL-3 as a critical mediator of astrocyte-microglia crosstalk and a node for therapeutic intervention in Alzheimer’s disease.
Glial cell communication in the pathophysiology of Alzheimer’s disease (AD) is of burgeoning interest, yet remains poorly defined2,3. Interleukin-3 (IL-3) is a multifunctional cytokine implicated in inflammatory6–10 and autoimmune11–13 diseases. In humans, plasma IL-3 levels associate with AD risk14–17 and severity18,19, and in vitro studies have implicated IL-3 in neurodegeneration20–23. Despite these links, the role of IL-3 in the human or murine AD brain has not been investigated.
First, we explored the influence of IL-3 in the healthy brain by profiling wildtype (WT) and IL-3-deficient (Il3−/−) mice. IL-3 deficiency did not impact blood brain barrier (BBB) permeability, neurogenesis, neuronal death, microglia activation and proliferation, or Y-maze memory (Extended Data Fig. 1). To test the function of IL-3 in the context of AD, we crossed IL-3-deficient mice with 5xFAD mice and quantified β-amyloid (Aβ) burden in the brain at 5 months of age. Histological analysis revealed increased Aβ load and Aβ plaque size in the cortex of Il3−/−5xFAD mice (Fig. 1a and b). Congruently, soluble and insoluble Aβ40 and Aβ42 levels were elevated in cortex homogenates of Il3−/−5xFAD mice (Fig. 1c). To assess cognitive function, we performed Y-maze and Morris water maze (MWM) tests. Il3−/−5xFAD mice demonstrated impaired short-term memory in Y-maze testing (Fig. 1d), were deficient in spatial learning memory during the training period of the MWM (Fig. 1e and Extended Data Fig. 2a), and tended toward reduced memory retention (Fig. 1f). Collectively, these observations suggest a protective role for IL-3 in a murine model of AD.
Fig. 1. IL-3 protects against β-amyloid accumulation and cognitive impairment in 5xFAD mice.
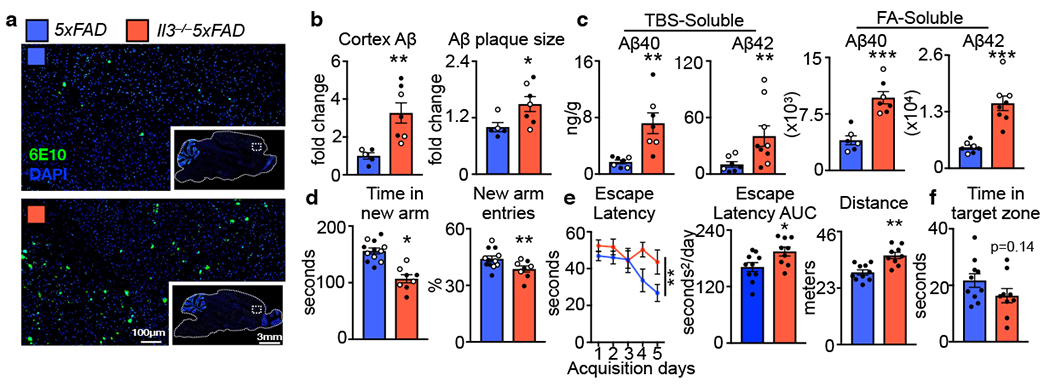
a. Representative immunofluorescence images of β-amyloid (Aβ) plaques (6E10) in 5-month-old 5xFAD and Il3−/−5XFAD mice. b. Quantification of Aβ area and Aβ plaque size in the cortex (n=5 5xFAD mice; n=7 Il3−/−5xFAD mice). c. Levels of tris-buffered saline (TBS)- and formic acid (FA)-soluble Aβ40 and Aβ42 in cortex homogenates of 5XFAD and Il3−/−5XFAD mice (n=6-7 5xFAD mice; n=7–9 Il3−/−5xFAD mice). d. Quantification of time in new arm and entries made into the new arm during Y-maze testing (n=8 5xFAD mice; n= 12 Il3−/−5xFAD mice). Morris water maze testing. e. Time for male mice needed to reach hidden platform plotted across training days (two-way ANOVA for groups p=0.0074) and area under the curve (AUC) of escape latency (n=10 5xFAD mice; n=9 Il3−/−5xFAD mice). f. Time in target zone on probe day (8th day) (n=10 5xFAD mice; n=9 Il3−/−5xFAD mice). Filled circles represent male mice, open circles represent female mice. *p<0.05, **p<0.01, ***p<0.001. Error bars indicate mean ± SEM.
IL-3 governs hematopoiesis and leukocytosis during various inflammatory conditions6–11, but it is unknown whether IL-3 acts similarly in AD. Therefore, we assessed BM hematopoiesis and blood leukocyte numbers in WT, 5xFAD, and Il3−/−5xFAD mice. Compared to WT mice, 5xFAD mice had a higher number of hematopoietic progenitor cells in the bone marrow (BM) and more circulating Ly6Chi monocytes and neutrophils (Extended Data Fig. 2b–c), suggestive of enhanced hematopoiesis. IL-3 deletion had modest effects on blood leukocyte numbers and BM hematopoiesis in 5xFAD mice (Extended Data Fig. 2b–c). Despite these findings, we did not observe altered BBB permeability (Extended Data Fig 2d) or seeding of the brain parenchyma by peripheral leukocytes in 5xFAD and Il3−/−5xFAD mice during long term parabiosis experiments (Extended Data Fig. 2e–f), suggesting that blood-derived leukocytes are rare in the murine 5xFAD brain, regardless of IL-3. While these data do not exclude the possibilities that vascular channels of the skull marrow24 or leukocytes in the meninges25 are sources of peripheral immune cells that penetrate the brain during neurodegeneration26,27, they do suggest that IL-3’s function in AD is independent of its effect on peripheral leukocytes or BBB integrity, prompting us to turn our attention to the local brain environment.
To gain a better understanding of IL-3’s possible function in the brain, we first measured the cytokine in the plasma and cerebrospinal fluid (CSF) of WT and 5xFAD mice. Despite comparable IL-3 levels in WT and 5xFAD mice, we noted a 4-fold increase in IL-3 concentration in the CSF relative to plasma, suggesting that IL-3 may be generated locally in the brain microenvironment (Fig. 2a). However, we did not detect Il3 expression in whole brain tissue, suggesting that either IL-3 is not produced in the brain or that it is produced by a subset of cells whose signal is diluted in whole tissue homogenate. To explore these possibilities, we designed a CRISPR-Cas9-based editing strategy with dual guide RNAs (gRNAs) and long single stranded DNA donors to insert condensed cDNA, P2A-Gfp, and loxP sequences into the endogenous Il3 loci via homology directed repair, generating dual Il3 reporter/floxed mice (Il3GFPfl/fl mice, Extended Data Tables 1–5 and Extended Data Fig. 3a–d). After confirming successful insertion by sequencing, we validated GFP signal in splenic and lymph CD4+ T-cells of Il3GFPfl/fl mice, known IL-3 sources11 (Extended Data Fig. 3e). Strikingly, flow cytometry of whole brain tissue from Il3GFPfl/fl mice revealed that a subset of astrocytes (~4%), but not microglia or other CD45− cells, produced IL-3 (Fig. 2b and Extended Data Fig.4a–b). Evaluation of Il3GFPfl/fl5xFAD mice suggested that AD pathology does not appear to change astrocyte IL-3 production (Fig. 2b–c). Transcriptomic assessment of cells sorted from astrocyte reporter mice (Aldh1l1GFP) revealed Il3 mRNA expression in astrocytes, but not other cells (Fig. 2d and Extended Data Fig. 4c). In correlation with the concentration of IL-3 protein in the CSF, Il3 expression in astrocytes was age-dependent and comparable between WT and 5xFAD mice (Extended Data Fig. 5a). Further, immunofluorescent imaging of Il3GFPfl/fl reporter mice showed striking co-localization of IL-3-GFP with GFAP+ astrocytes (Fig. 2e), strengthening the idea that astrocytes are the primary source of IL-3 in the murine brain. These findings suggest that a subset of astrocytes produce IL-3.
Fig. 2. Microglia become responsive to astrocyte-derived IL-3 in Alzheimer’s disease.
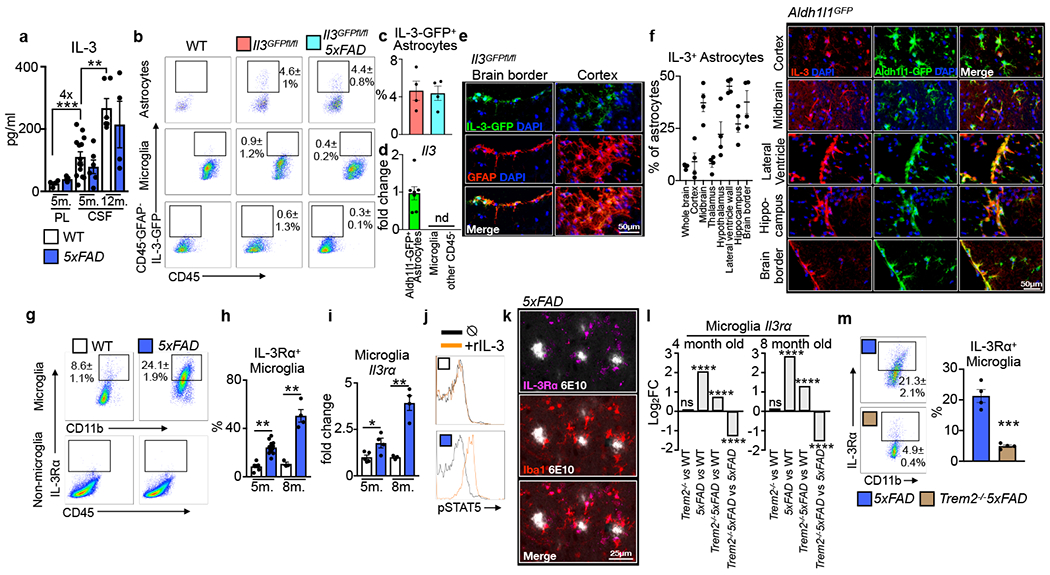
a. IL-3 levels in the plasma (PL) and cerebrospinal fluid (CSF) of WT and 5xFAD mice at 5 and 12 months (m.) of age (n=4 WT and 5xFAD 5m.plasma; n=14 WT 5m. CSF; n=6 5xFAD 5m. CSF; n=5 WT 12m. CSF; n=4 5xFAD 12m. CSF). b. Flow cytometry analysis of the brain of WT, Il3GFPfl/fl, and Il3GFPfl/fl5xFAD reporter mice. c. Quantification of IL3+ (GFP+) astrocytes in the brain of Il3GFPfl/fl and l3GFPfl/fl5xFAD mice (n=4 mice per group). d. Il3 mRNA transcript expression in Aldh1l1-GFP+ astrocytes, CD11b+CD45mid microglia, and CD45− cells sorted from Aldh1/1GFP mice (n=7 mice per group). e. Representative immunofluorescence images showing co-localization of IL-3-GFP+ with GFAP+ astrocytes in Il3GFPfl/fl mice. f. Quantification of IL3+ astrocytes (Aldh1/1-GFP+) in various brain regions and representative immunofluorescence images from numerous regions showing co-localization of IL-3 with GFP+ astrocytes in Aldh1/1GFP mice (n=4 per group). g. Flow cytometry and (h) analysis of IL-3Rɑ+ microglia in the brain of WT and 5xFAD mice (n=5 5m. WT mice; n=11 5m. 5XFAD mice; n=3 8m. WT mice; n=5 8m. 5XFAD mice). i. Il3ra mRNA expression in sorted microglia (n=5 5m. WT mice; n=4 5m. and 8m. 5xFAD mice; n=3 8m. WT mice). j. STAT5 phosphorylation in ex-vivo microglia simulated with recombinant IL-3. k. Representative immunofluorescence images showing co-localization of IL-3Rɑ with Iba1 in the cortex of 5xFAD mice. l. Il3rɑ transcript expression in sorted microglia from WT, Trem2−/−, 5xFAD, and Trem2−/−5xFAD mice displayed as Log2 fold change (FC) for indicated comparisons (for 4 month old mice p=3.45e−27 for 5xFAD vs WT, p=3.4e−06 for Trem2−/−5xFAD vs WT, p=1.82e−08 for Trem2−/−5xFAD vs 5xFAD; for 8 month old mice p=1.12e−93 for 5xFAD vs WT, p=1.4e−13 for Trem2−/−5xFAD vs WT, p=1.6e−40 for Trem2−/−5xFAD vs 5xFAD; FDR<0.0002; for WT n=13M/14F at 4 m., n=8M/8F at 8m.; for Trem2−/− n=11M/12F at 4m., 2M/2F at 8m.; for 5xFAD n=14M/14F at 4 m., 10M/9F at 8m.; and for Trem2−/−5xFAD n=11M/11F at 4m., 9M/8F at 8m.). ns=not significant. m. Flow cytometry analysis of IL3Rɑ+ on microglia from 5xFAD and Trem2−/−5xFAD mice (n=4 mice per group). Groups are of evenly mixed sex. *p<0.05, **p<0.01, ***p<0.001. Error bars indicate mean ± SEM.
Astrocytes are a diverse and heterogeneous population1,28. To investigate region-specific heterogeneity in astrocyte IL-3 production, we profiled brains of Aldh1l1GFP mice by immunofluorescence which revealed co-localization of IL-3 with Aldh1l1-GFP+ astrocytes, but not Aldh1l1-GFP− non-astrocytes, across numerous regions of the murine brain (Fig. 2f and Extended Data Fig. 4e). Regional analysis demonstrated that the proportion of IL-3+ astrocytes varied across brain structures (Fig. 2f). However, owing to IL-3’s function as a secreted cytokine and its presence in the circulating CSF (Fig 2a), tissue IL-3 levels were comparable throughout the brain (Extended Data Fig. 5b). Activated astrocytes produce numerous immune mediators29, including GM-CSF30,31, a hematopoietic growth factor closely related to IL-3, prompting us to test whether astrocyte activation results in IL-3 generation. While repetitive i.p. injection of lipopolysaccharide (LPS) activated astrocytes, IL-3 production and CSF levels were unchanged (Extended Data Fig. 5c–d). Further, IL-3 deletion did not alter astrocyte morphology or distribution in healthy and 5xFAD animals (Extended Data Fig. 5e–f). Together, these results propose that a subset of astrocytes constitutively generate IL-3.
Having established astrocytes as the source of IL-3 in the brain, we next sought to identify the cells that respond to this cytokine. Microglia are highly attuned to their environment and undergo marked transcriptional and phenotypic changes during AD32,33. We uncovered an age-dependent increase of IL-3’s specific receptor, IL-3Rα (also known as CD123), in microglia of WT mice (Extended Data Fig. 5g–h). However, induction of microglia IL-3Rα protein and mRNA transcript occurred more robustly and at a much earlier age in 5xFAD mice (Fig. 2g–i and Extended Data Fig. 4d). At 5 and 8 months of age, IL-3Rα+ microglia constituted more than 20% and 50% of the microglial pool, respectively, in 5xFAD mice. Comparatively, in WT mice ~8% of microglia were IL-3Rα+ at these ages. Premature and sustained augmentation of IL-3Rα was specific to microglia in 5xFAD mice and did not occur in other cell types of the brain (Fig. 2g) or in peripheral tissue-resident macrophages (Extended Data Fig. 5i). Indeed, IL-3Rα signaling in microglia from 5-month-old 5xFAD but not WT mice was confirmed by STAT5 phosphorylation upon ex vivo stimulation with recombinant IL-3 (rIL3, Fig. 2j). Immunofluorescent imaging demonstrated co-localization of IL-3Rα with microglia in close proximity to Aβ aggregates in the brains of 5xFAD mice (Fig. 2k). These results indicate that microglia become responsive to IL-3 during AD by inciting IL-3Rα.
To explore signaling networks that control dynamic Il3rα expression we profiled microglia of WT, Trem2−/−, 5xFAD, and Trem2−/−5xFAD mice by RNA-seq. TREM2 is an immuno-receptor that shapes the transcriptional and functional landscape of microglia32–36 and has been implicated in murine35,37–39 and human40,41 AD pathology. RNA-seq analysis confirmed that Il3rα transcript is enriched in microglia of 5xFAD mice relative to WT mice at 4 (Log2FC=2.068, p=3.45E−27) and 8 (Log2FC=2.851, p=1.12E−93) months of age (Fig. 2l). We also noted an age-dependent increase in Il3rα (8- vs 4-month-old 5xFAD mice, Log2FC=0.758, p=5.49E−06). Strikingly, Trem2 deletion led to a significant blunting of Il3rα expression in 5xFAD mice at 4 (Log2FC=−1.288, p=1.82E−08) and 8 (Log2FC=−1.552, p=1.60E−40) months of age (Fig. 2l). In agreement with these findings, flow cytometry demonstrated that Trem2 deletion abrogated the appearance of IL-3Rɑ+ microglia in 5xFAD mice (Fig. 2m).
TREM2 mediates the development of disease associated microglia (DAM), an activated and protective phenotype associated with AD32,33,39,42. Analysis of public single-cell RNA-seq datasets32 demonstrated that Il3rɑ is specifically and highly augmented in TREM2-dependent stage 2 DAMs, but not TREM2-independent stage 1 DAMs or homeostatic microglia (>7 fold, DAM type 1 vs. DAM type 2, Extended data Fig. 6a–b). Together, these data indicate that Il3rα induction and the appearance of IL-3Rα+ microglia during AD pathology depends on TREM2. To investigate whether IL-3Rα+ microglia represent a phenotypically unique subpopulation, we profiled IL-3Rαhi and lo microglia in the brains of 5xFAD mice (Extended Data Fig. 7). In agreement with the hypothesis that TREM2 is required for IL-3Rα induction, IL-3Rαhi microglia had higher levels of TREM2 transcript and protein and increased expression of the TREM2 adaptor protein DAP12 (Tyrobp). Further, relative to IL-3Rαlo microglia, IL-3Rαhi microglia exhibited increased MHCII, CD11c (Itgax), CCL2, and intracellular Aβ, and more Ccl2, Ccl7, and Ccl5 expression. These findings point to IL-3Rα+ microglia as a distinct TREM2-dependent population endowed with an immune-responsive and activated phenotype.
Next, we sought to assess IL-3 signaling in the human brain. Histology of postmortem frontal cortex from AD patients and age-matched non-demented controls uncovered IL-3 co-localizing with astrocytes (Fig. 3a). Measurement of IL-3 protein in frontal cortex tissue homogenates of 23 AD patients and 15 age-matched non-demented controls (cohort characteristics in Extended Data Table 6) demonstrated that IL-3 levels were unaltered by AD pathology (Fig. 3b). Meanwhile, microglia in the frontal cortex of healthy controls exhibited numerous thin ramifications, suggestive of a resting state, and were devoid of IL-3Rɑ (Fig. 3c). In contrast, microglia in AD patients stained for IL-3Rɑ abundantly and gained a globular and amoeboid morphology, indicative of microglia activation (Fig. 3c). To further characterize the dynamic regulation of IL-3Rɑ in human AD pathology, we measured IL3Rα expression in postmortem brain samples (30 AD patients and 28 age-matched non-demented controls, cohort characteristics in Extended Data Table 7). We observed a 3-fold increase in IL3Rɑ expression in the frontal cortex of AD patients (Fig. 3d) and patients carrying the AD-risk ε4/ε4 APOE genotype exhibited higher IL3Rɑ expression than carriers of other APOE genotypes (Fig. 3e). Further, IL3Rɑ expression correlated with disease duration (Fig. 3f) and FA-soluble Aβ40 and Aβ42 levels in the frontal cortex of AD patients (Fig. 3g and h). Together, these findings suggest that AD pathology and severity drive microglia to express IL3Rα and indicate that IL-3 signaling is relevant in the human brain during AD pathogenesis.
Fig. 3. IL-3 signaling correlates with disease pathology in the brain of humans with Alzheimer’s disease.
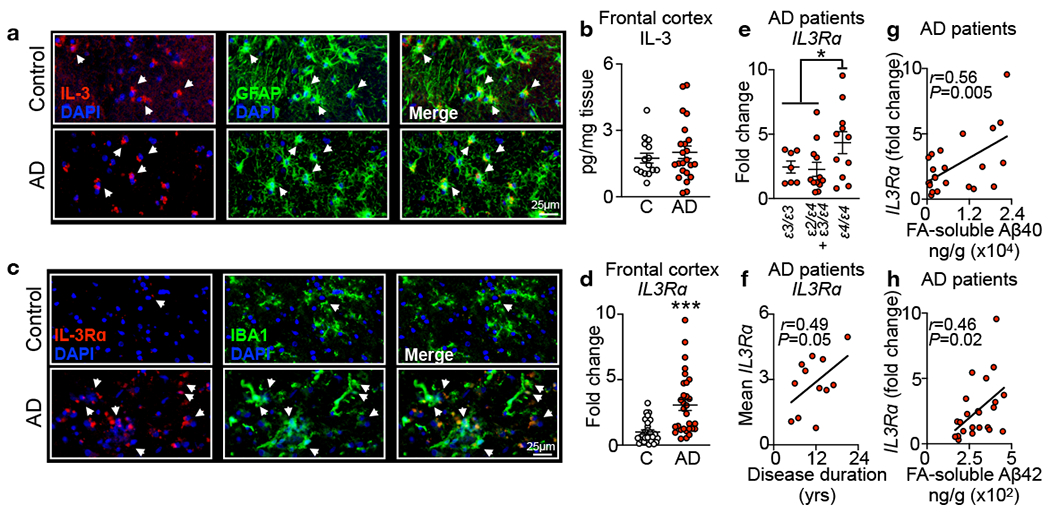
a. Representative immunofluorescence images of the cortex of control subjects (C) or Alzheimer’s disease (AD) patients stained for IL-3 and GFAR b. Measurement of IL-3 levels in cortex tissue homogenates from control and AD patients (n=15 controls, n=23 AD patients, see Extended Data Table S6 for characteristics). c. Representative immunofluorescence images of the cortex of humans with or without Alzheimer’s disease (AD) stained for IL-3Rɑ and Iba1. d. qPCR analysis of fold change in IL3Rɑ expression in the frontal cortex of control non-demented individuals and AD patients (n=28 controls, n=30 AD patients, see Extended Data Table S7 for characteristics). e. Assessment of brain IL3Rɑ expression with APOE genotype (n=30 AD patients). f. Correlation of mean IL3Rɑ expression with years (yrs) of disease duration (n=30 AD patients). Correlation of IL3Rɑ expression with formic acid (FA)-soluble Aβ40 (g) and Aβ42 (h) in the frontal cortex of AD patients (n=23 AD patients). *p<0.05, **p<0.01, ***p<0.001. Open circles represent control subjects and red circles represent AD patients. Error bars indicate mean ± SEM.
Having observed evidence for dynamic IL-3 signaling in murine and human AD pathology, we next explored IL-3’s protective function. IL-3 deletion did not influence the number of microglia (Fig. 4a) or their proliferative capacity (Extended Data Fig. 8a–b) in 5xFAD mice. To determine whether IL-3 signaling shapes microglial transcriptional programs we performed RNA-seq of microglia from 5-month-old 5xFAD and Il3−/−5xFAD mice. We identified 309 differentially expressed genes (269 decreased and 40 increased in Il3−/−5xFAD vs 5xFAD, log2fold change (FC)>1.6, FDR<0.1, p<0.005) and multidimensional scaling analysis revealed a distinct transcriptional signature of Il3−/−5xFAD microglia (Fig. 4b–c). Microglia from Il3−/−5xFAD mice, despite an increased Aβ burden and worse AD pathology (Fig. 1), had abrogated transcriptional activation of many genes indicative of advanced Alzheimer’s disease progression and immune activation32–34,42 (Fig. 4c–d). Strikingly, IL-3 deletion led to reduced expression of Apoe, a gene strongly associated with AD risk43, along with repressed expression of genes associated with AD pathology and tissue repair (Spp1, Dkk2, Gpnmb), microglia immune responses (Clec7a, Igf1, Itgax, Lyz2, Mamdc2, Actr3b, Trem3, Treml, Ctsg, Ctsw, Cd200r4, Clec4e, Cxcr4, Cxcr6, IL27ra), and genes critical to cell motility, extracellular matrix remodeling, and dissolution (Ccl8, Ccl5, Hpse, Lox, Mmp9, Mmp12, Mmp8, Mmp25). In agreement with these findings, gene set enrichment analysis (GO) uncovered IL-3 regulation of immune responses, leukocyte migration, and modification of morphology (Fig 4e). Importantly, while a portion of TREM2-dependent genes were altered by IL-3 deletion (e.g. Spp1, Itgax, Apoe, Lyz2, and Clec7a), Trem2 and Tyrobp were not (FC=0.8133, FDR=0.233 and FC=−0.43, FDR=0.09, respectively), bolstering the idea that IL-3 signaling acts downstream of TREM2. Collectively, these data demonstrate that IL-3 confers broad and substantial reprograming of the microglial transcriptome, deploying immune and motile responses.
Fig. 4. IL-3 reprograms microglia promoting motility and clustering of β-amyloid in the murine brain and in a 3D human AD iPS triculture system.
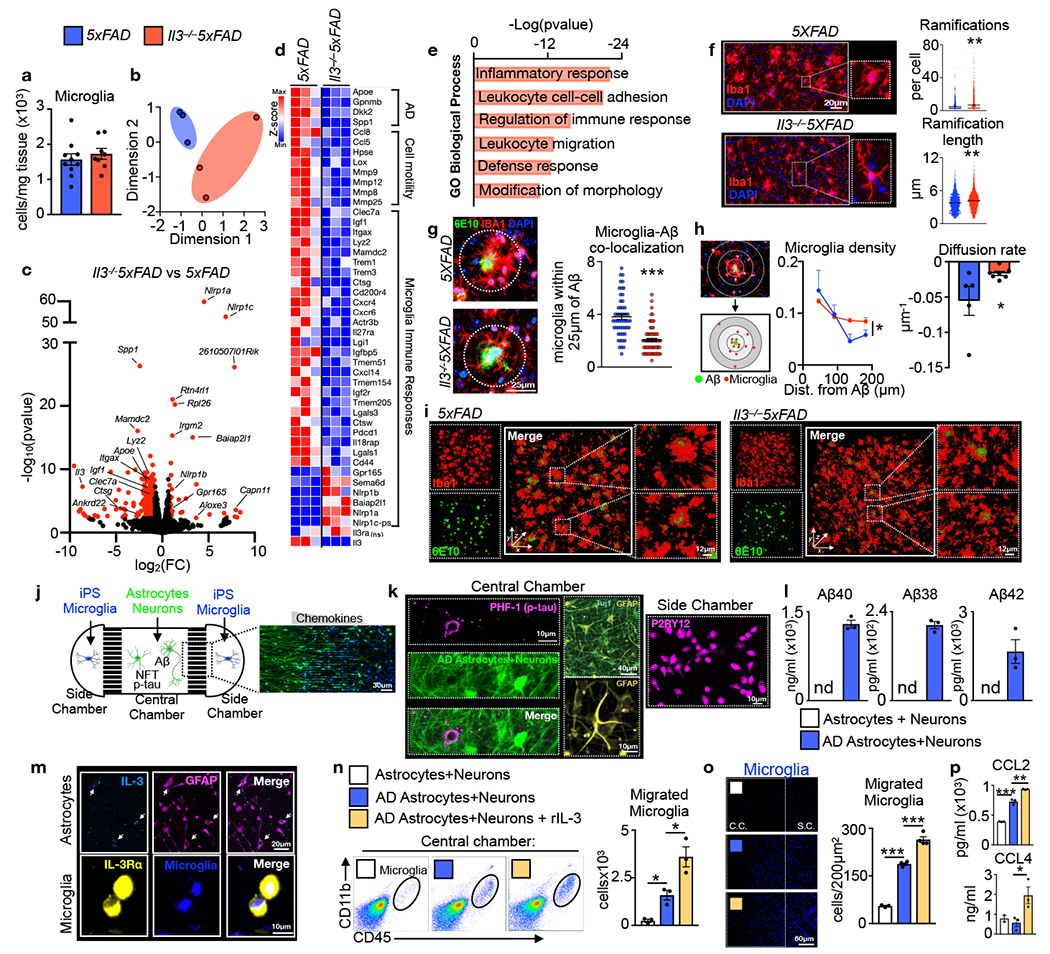
a. Enumeration, by flow cytometry, of microglia in WT, 5XFAD, Il3−/−5XFAD mice (n=10 5xFAD mice; n=8 Il3−/−5XFAD mice). b. Multidimentional scaling (MDS) plot of RNAseq data from 5 month old 5XFAD and Il3−/−5XFAD mice (n=12, each data point represents 4 pooled mice of 2M/2F). c. Volcano plot indicating differentially regulated genes (FC>1.6, FDR<0.1, p<0.005) in microglia of 5XFAD and II3−/−5XFAD mice. d. Heatmap of key differentially regulated genes (FC>1.6, FDR<0.1, p<0.005), except Il3rɑ which is not significantly different between 5xFAD and Il3−/− 5xFAD microglia (n=12, each data point represents 4 pooled mice of 2M/2F). e. Pathway analysis of significantly regulated genes. f. Representative immunofluorescence images of microglia from 5XFAD and Il3−/−5XFAD mice along with skeletal analysis of microglia morphology (n=5 5xFAD mice; n=4 Il3−/−5XFAD mice). g. Representative immunofluorescence images of cortex sections from 5XFAD and Il3−/−5XFAD mice stained for Aβ (6E10), Iba1 and DAPI and quantification of the number of microglia within 25μm of Aβ plaques (n=5 5xFAD mice; n=7 Il3−/−5XFAD mice). h. Schematic depicting segmentation and spatial analysis along with computed density gradient and diffusion rate of microglia surrounding Aβ (n=5 5xFAD mice; n=7 Il3−/−5XFAD mice). i. Three dimensional confocal images of mouse cortex (634x250x634μm) stained for Aβ (6E10) and microglia (Iba1). All mouse data are of groups of 5 month old animals of evenly mixed sex. j. Scheme of 3D human AD triculture microfluidic system where human neuron ReNcell VM progenitor derived astrocytes and neuronal cells, with or without the K670N/M671L (Swedish) and V717I (London) familial AD mutations resulting overproduction of Aβ and neurofibrillary tangle (NFT) p-tau (AD), are plated in the central chamber while human iPS-derived microglia labeled with CellTracker are plated in side chambers. k. Confocal images demonstrated p-tau (PHF1) localization with neurons (Tuj1) and the presence of astrocytes (GFAP) in the central chamber and microglia (P2RY12) in the side chamber. l. ELISA quantification of Aβ40, Aβ38, and Aβ42 in media of central chamber in 3D microfluidic system plated with control or AD cells (n=3 per group). m. Confocal imaging of IL-3 localization to GFAP+ human astrocytes and IL-3Rɑ localization to CellTracker labeled human iPS-derived microglia in 3D microfluidics system. n. Flow cytometry quantification of iPS-derived microglia that have migrated to the central chamber of the 3D microfluidics system with or without addition of human recombinant IL-3 (n=3 per group). o. Representative confocal images and image quantification of iPS microglia migration to central chamber (n=3 per group for astrocytes+neurons and AD astrocytes+neurons; n=4 AD astrocytes+neurons+rlL3). p. CCL2 and CCL4 levels in media of 3D microfluidics system (n=3 per group). *p<0.05, **p<0.01, ***p<0.001. Error bars indicate mean ± SEM.
Having established broad influences of IL-3 on the transcriptome of microglia during AD, we next sought to profile the functional consequences these changes might elicit. Given our RNA-seq findings, we tested the role of IL-3 in shaping microglia morphology, motility, and distribution, which are early immune responses in AD pathology. Morphologic analysis of microglia revealed globular and rounded microglia in 5xFAD animals (Fig. 4f), indicative of an activated state. Comparatively, microglia in Il3−/−5xFAD mice exhibited a ramified morphology with numerous fine and elongated ramifications (Fig. 4f), akin to a homeostatic or resting state. A critical function for the globular architecture of microglia is to enable their migration through the brain parenchyma44. Because our transcriptomic analysis identified an IL-3-dependent signature of cell motility, migration, and extracellular matrix dissolution, we tested whether IL-3 moderates microglial distribution. Histological analysis of brain sections from Il3−/−5xFAD mice uncovered a re-organization in the location of microglia. IL-3-deficiency hindered microglial tissue mobilization and suppressed their ability to migrate towards and cluster around Aβ deposits (Fig. 4g). To expand on this observation, we used a watershed algorithm to compute the spatial orientation and relative location of microglia and Aβ plaque in the murine cortex (Fig. 4h). As expected, in 5xFAD mice we observed high microglial density closest to Aβ which dissipated precipitously in concentric regions radiating from the plaque. In Il3−/−5xFAD mice, however, we found a more uniform distribution of microglial density resulting in a lower concentration of cells in proximity to Aβ and a reduced rate of microglial diffusion extending from Aβ aggregates (Fig. 4h). Building on these findings we performed three-dimensional (3D) whole-mount confocal imaging of optically-cleared cortical tissue from 5xFAD and Il3−/−5xFAD mice and chose areas (634x250x634μm) with comparable Aβ burden to assess microglial morphology and spatial distribution in 3D. In 5xFAD mice, microglia had globular morphology and clustered with Aβ deposits closely (Fig 4i and Extended Data Video 1). In cortical tissue of II3−/−5xFAD mice, however, microglia were more ramified, disperse, and uniformly distributed throughout the 3D tissue, and their ability to cluster and form a barrier around Aβ deposits was impaired (Fig 4i and Extended Data Video 1). Upon surrounding Aβ, microglia clear it through phagocytosis35. The ability of microglia to phagocytose Aβ was independent of IL-3 as we did not observe changes in the expression of machinery important to Aβ recognition or phagocytosis (Axl, Dcstamp, Mertk, Cd36, Cd47, Msra, Tlr4, Tlr2, Tlr9, P2ry6, Cd68) by RNA-seq, or the ability of microglia to ingest pH-sensitive labelled Aβ ex vivo in the presence or absence of IL-3 (Extended Data Fig. 8c–d). Further, IL-3 did not influence microglial production of inflammatory cytokines (Ifnγ, Il18, Il1β, Il6, Tnfɑ, Extended Data Fig. 8e). Together, these findings suggest a specific role for IL-3 in instigating microglial immune activation, parenchymal re-distribution and motility, and clustering around Aβ aggregates, which are critical early immune responses facilitating a microglial barrier and Aβ clearance prior to the establishment of unresolving tissue-damaging inflammation.
To explore the capacity of IL-3 to mediate the distribution and kinetics of human microglia directly we used a 3D microfluidic triculture system that relies on human induced pluripotent stem cells (iPS) and mimics the in vivo human AD environment45,46 (Fig. 4j). In the system, the Matrigel-containing central chamber was loaded with human GFP+ neurons and astrocytes differentiated from either control progenitor cells (astrocytes + neurons) or cells that over-express mutated Aβ precursor protein (APP) and contain neurofibrillary p-tau tangles and abundant Aβ (AD astrocytes + neurons). In the side chambers, we plated labeled human iPS-derived adult microglia. The central and side chambers are linked by migration channels (10×50×500μm, height x width x length) forming a gradient of soluble factors. First, in central chambers plated with AD cells we confirmed the presence of Tuj1+ mature neurons, GFAP+ astrocytes, and neurofibrillary p-tau tangles (PHF-1+) (Fig. 4k) along with augmented Aβ40, Aβ38, and Aβ42 (Fig. 4l). In side chambers we confirmed the differentiation of iPS cells into mature P2RY12+ microglia (Fig. 4k). Similar to our observations in murine and human brains, we observed co-localization of IL-3 with human progenitor-derived astrocytes and IL-3Rα with human iPS microglia (Fig. 4m) which is augmented in response to Aβ stimulation (Extended Data Fig. 9a).We then quantified recruitment of labeled iPS microglia to the central chamber by flow cytometry (Fig. 4n) and confocal imaging (Fig. 4o). As expected, microglia recruitment was augmented in cultures containing AD astrocytes and neurons. Addition of human rIL-3 to the AD cultures robustly increased microglia migration from side chambers to the central chamber and augmented the levels of CCL2 and CCL4, important myeloid chemoattractants (Fig. 4p and Extended Data Fig. 9b). Reflecting our in vivo data, these results obtained with human progenitor and iPS-derived cells point to a critical role for IL-3 in microglial recruitment towards human Aβ aggregates and neurofibrillary p-tau.
Next, we sought to determine the specific contribution of astrocyte IL-3 and microglia IL-3Rɑ to AD pathology. To this end, we crossed Il3GFPfl/flmice with Aldh1l1CreERT2 and 5xFAD mice to generate inducible astrocyte-specific Il3 knockout 5xFAD mice (Il3GFPfl/flAldh1l1CreERT25xFAD). Along with Il3GFPfl/fl5xFAD controls, Il3GFPfl/flAldh1l1CreERT25xFAD mice were repetitively injected with tamoxifen starting at 2 months of age which ablated astrocyte IL-3 production and reduced CSF IL-3 levels by 75% at 5 months of age (Extended Data Fig. 3 f℃h), demonstrating that a substantial portion of CSF IL-3 is astrocyte-derived. Deletion of astrocyte-sourced IL-3 resulted in greater Aβ deposition in the cortex (Fig. 5a–b) and repressed microglia expression of genes associated with AD progression, immune activation, and motility (Apoe, Itgax, Lyz2, Spp1, Igf1, Clec7a, Ctsg, Mmp9, and Ccl8) but did not alter microglia Trem2 expression (Fig 5c). Microglia were limited in their capacity to cluster Aβ (Fig. 5d) and short-term memory was impaired in Il3GFPfl/flAldh1l1CreERT25xFAD animals (Fig. 5e). To target microglia IL-3Rɑ, we employed a similar CRISPR-Cas9 editing strategy to generate mice with loxp sequences flanking Il3rɑ (Extended Data Tables 1–5 and Extended Data Fig. 3a–d). We crossed Il3rafl/fl mice with Cx3cr1CreERT2 and 5xFAD mice to generate inducible microglia-specific Il3rɑ knockout 5xFAD mice (Il3rafl/flCx3cr1CreERT25xFAD) which, along with Il3rafl/fl5xFAD controls, were repetitively injected with tamoxifen beginning at 2 months of age and sacrificed at 5 months of age. This widely used tamoxifen injection strategy enables reliable microglia-specific deletion47,48, and we found that Il3rɑ expression and the appearance of IL-3Rɑ+ microglia was abrogated in Il3rafl/flCx3cr1CreERT25xFAD animals (Extended Data Fig. 3i–k). Relative to Il3rafl/fl5xFAD controls, Il3rafl/flCx3cr1CreERT25xFAD mice had greater levels of Aβ in their cortex (Fig. 5f–g), reduced microglia-Aβ co-localization (Fig. 5h), and tended towards worsened short-term memory (Fig. 5i). Using cell-specific approaches, these findings propose IL-3-mediated astrocyte-microglia communication as a critical regulator of microglia reprograming that protects against AD pathology.
Fig. 5. Astrocyte IL-3 or microglia IL-3Rɑ deletion instigate while IL-3 infusion resolves β-amyloid burden and cognitive decline.
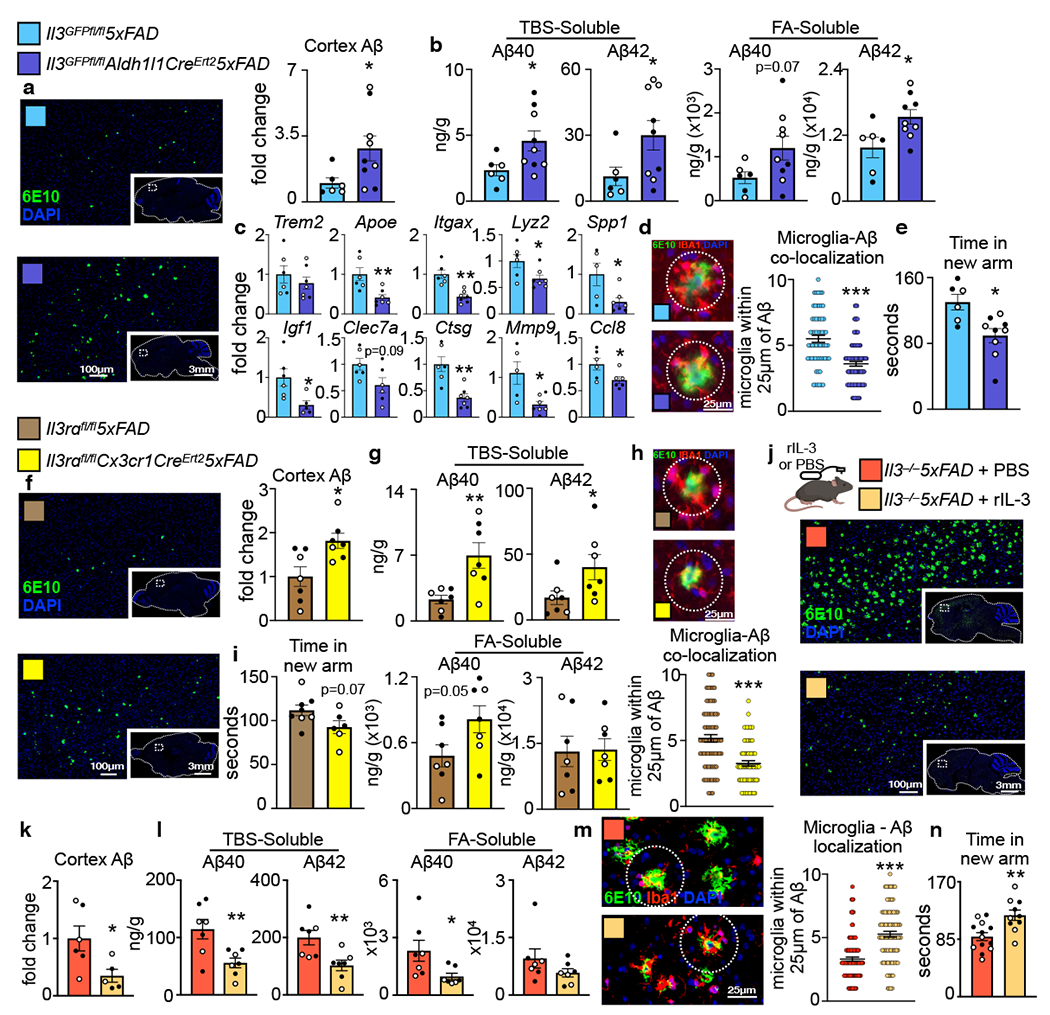
a. Representative immunofluorescent images and Aβ quantification of brain sections probed for Aβ (6E10) and DAPI of 5-month-old Il3GFPfl/fl5xFAD and Il3GFPfl/flAldh1/1CreErt25xFAD mice injected with tamoxifen (n=6 Il3GFPfl/fl5xFAD mice; n=9 Il3GFPfl/flAldh1/1CreErt25xFAD mice). b. Levels of TBS- and FA-soluble Aβ40 and Aβ42 in cortex homogenates (n=6 Il3GFPfl/fl5xFAD mice; n=9 Il3GFPfl/flAldh1/1CreErt25xFAD mice). c. Gene expression in sorted microglia (n=6 Il3GFPfl/fl5xFAD mice; n=9 Il3GFPfl/flAldh1/1CreErt25xFAD mice). d. Representative immunofluorescent images and quantification of microglia-Aβ co-localization (n=6 Il3GFPfl/fl5xFAD mice; n=9 Il3GFPfl/flAldh1/1CreErt25xFAD mice). e.Y-maze testing time in new arm (n=6 Il3GFPfl/fl5xFAD mice; n=9 Il3GFPfl/flAldh1/1CreErt25xFAD mice). f. Representative immunofluorescent images and Aβ quantification of brain sections probed for Aβ (6E10) and DAPI of 5-month-old Il3rɑfl/fl5xFAD and Il3rɑfl/flCx3cr1CreErt25xFAD mice injected with tamoxifen. (n=7 per group). g. Levels of TBS- and FA-soluble Aβ40 and Aβ42 in cortex homogenates (n=7 per group). h. Representative immunofluorescent images and quantification of microglia-Aβ co-localization (n= per group). i. Y-maze testing time in new arm (n=8 Il3rɑfl/fl5xFAD mice; n=6 Il3rɑfl/flCx3cr1CreErt25xFAD). j. Experimental approach and representative immunofluorescent images of brain sections probed for Aβ (6E10) and DAPI from mice receiving brain infusion of PBS or recombinant IL-3. k. Quantification of cortex Aβ (n=6 Il3−/−5xFAD+PBS; n=5 Il3−/−5xFAD+rIL-3). l. Levels of TBS- and FA-soluble Aβ40 and Aβ42 in cortex homogenates (n=7 per group). m. Representative Immunofluorescence images and co-localization quantification of microglia within 25μm of Aβ in the cortex of mice receiving PBS or rIL-3 (n=6 Il3−/−5xFAD+PBS; n=5 Il3−/−5xFAD+rIL-3). n. Y-maze testing time in new arm (n=13 Il3−/−5xFAD+PBS; n=10 Il3−/−5xFAD+rIL-3). Filled circles represent male mice, open circles represent female mice. *p<0.05, **p<0.01, ***p<0.001. Error bars indicate mean ± SEM.
Our results raise the possibility of utilizing IL-3 therapeutically to target microglia dynamics and immune responses in AD pathology. To begin to explore this, we stereotactically injected rIL-3 into the cortex of 5xFAD animals. Remarkably, this led to a robust and rapid (<3 day) mobilization of microglia and clustering around Aβ deposits (Extended Data Fig. 10a). We extended this observation by implanting canulae into the lateral ventricle of mice and connecting them to subcutaneously implanted osmotic mini-pumps, thus delivering continuous rIL-3 (1μ/day) to the brain for 28 days. Histological analysis and ELISA measurements revealed a substantial reduction of Aβ load in the cortex of mice receiving intracerebroventricular infusion of rIL-3 (Fig. 5j–l). While total microglia numbers were unaltered by rIL-3 delivery (3.4±0.4x10³ vs. 2.9±0.6x10³ cells/mg, PBS vs. rIL-3 infusion, ns), clustering of Aβ deposits increased (Fig. 5m) and short-term memory improved (Fig. 5n). The location of rIL-3 delivery was critical as 10 weeks of peripheral rIL-3 injections did not influence AD pathology (Extended Data Fig. 10b–d). Collectively, these data reveal the therapeutic potential of IL-3 in AD.
AD is the most prevalent form of dementia, affecting a third of individuals over the age of 6549. The repeated failures of anti-AD therapeutics necessitate the exploration of new pathophysiological mechanisms of early disease stages and modulating glial cell communication is one strategy with high potential. Here, we describe IL-3 as a mediator of astrocyte-microglia crosstalk and a regulator of microglia immune programming, redistribution, and Aβ burden in murine and human AD pathology (Extended Data Fig. 10e). These data support the potential targeting of IL-3 signaling for reducing AD-related pathology. Together, our findings indicate that IL3-mediated acute immune responses by microglia reduce Aβ burden and limit persistent tissue-damaging inflammation.
Materials and Methods
Human Samples.
Frozen tissue specimens and paraffin sections from the frontal cortex of AD patients and age-matched non-demented control subjects were obtained from the Massachusetts Alzheimers Disease Research Center Brain Bank. Subjects or next of kin consented to the brain donation and the Massachusetts General Hospital Institutional Review Board approved the study. All AD patients met the National Institute of Neurological and Communicative Disorders and Stroke-Alzheimer’s Disease and Related Disorders Associations criteria for probable AD and the National Institute on Aging-Reagan Institute criteria for high likelihood of AD. Secondary use of de-identified human samples was approved by the institutional review board of the Massachusetts General Hospital (protocol no. 2019P003736 and 2019P003732).
Animals.
Wild-type C57BL/6J, B6;FVB-Tg(Aldh1l1-EGFP/Rpl10a)JD130Htz/J, C57BL/6J-Trem2em2Adiuj/J, and C57BL/6-Tg(UBC-GFP)30Scha/J mice were purchased from The Jackson Laboratory. 5xFAD mice1 were purchased from the Jackson Laboratory (MMRRC) and backcrossed onto the C57BL/6J background more than 10 generations before being crossed with other strains. Il3−/− mice on the C57BL/6J background were bred in-house2,3 and crossed with 5xFAD mice. For RNAseq studies, Trem2−/− mice4 on the C57BL/6J background were generated at Washington University School of Medicine, bred in-house, and crossed with 5xFAD mice. Age- and sex-matched animals were used. If sex of the animals is not specifically indicated, groups were sex balanced. Where appropriate, animals were randomly assigned to interventions. All mice were group housed under standard conditions with free access to food and water. All animal protocols were approved by the Animal Review Committee at the Massachusetts General Hospital (protocol no. 2011N000035 and 2015N000044) and were in compliance with relevant ethical regulations.
CRISPR-Cas9 generation of Il3GFPfl/fl and Il3rɑfl/fl mice.
Two SpCas9 guide RNAs (gRNAs; Extended Data Table 1) were initially designed to target genomic regions within the first intron and 3’ of the stop codon of either Il3 and Il3Rɑ genes, using on-target and off-target prediction software5,6. Single stranded DNA (ssDNA) donor oligos encoding the floxed cDNA were designed for Il3 and Il3Rɑ (Extended Data Fig. 3a and b, respectively), both of which encoded a P2A-eGfp tag and ~500 base pair homology arms on either end (synthesized by Genewiz, Supplemental Information 1 and 2). Prior to performing experiments with the ssDNA donors, the on-target activities of the gRNAs were evaluated by microinjection of ribonucleoprotein (RNP) complexes comprised of TrueCut Cas9 v2 (ThermoFisher) and synthetic gRNAs (Synthego) into mouse zygotes. All microinjections were performed at the Genome Modification Facility (Harvard University). Injected zygotes developed to the blastocyst stage prior to genomic DNA extraction. To evaluate genome editing efficiencies, the target regions were amplified by PCR using the primers listed in Extended Data Table 2. Amplicons were sent for Sanger sequencing and the approximate level of on-target activity was determined using ICE7. The most effective gRNA of each pair examined (within the first intron and 3’ of the stop codon of either Il3 and Il3Rɑ genes) were then used for microinjections in the presence of the ssDNA donors. Injected embryos were implanted into pseudopregnant recipients, and 17 and 24 pups for the Il3 and Il3Rɑ targeted mice, respectively, were genotyped at 3 weeks of age. To genotype mice, genomic DNA was extracted from tail snips in 200 μL of tail lysis buffer (100 mM Tris-HCl, 200mM NaCl, 5mM EDTA, 0.05% SDS, 12.5 mM DTT, 1.4 ug/ul Proteinase K (New England Biolabs)) via ~16 hour incubation at 55°C. Lysates were cleaned up using 0.7x paramagnetic beads prepared as previously described8,9. Insertions of the donor DNA sequences into the endogenous Il3 and Il3Rɑ loci (Extended Data Fig. 3a and b, respectively) were confirmed by Sanger sequencing across the full donor sequence (using the primers in Extended Data table 3). Founder mice in which the full-length insert was detected were then selected for further breeding to remove mosaicism and generate Il3GFPfl/fl and Il3rɑfl/fl N1 mice. Sanger sequencing revealed missense mutations in the inserted sequence that were not present in the ssDNA donor sequence (Extended Data Table 4). Missense mutations resulted in the quenching of the GFP signaling in Il3rɑ targeted mice but did not influence IL-3Rɑ functionality or signaling (Extended Data Fig 3i). GFP functionality remained intact in Il3 targeted mice (Fig. 2 b and f, and Extended Data Fig. 3e) Subsequent Il3GFPfl/fl and Il3rɑfl/fl mice were genotyped by PCR via the genotyping strategy and primers in Extended Data Table 5. Il3GFPfl/fl mice were crossed to Aldh1l1CreERT2 and 5xFAD mice generating Il3GFPfl/flAldh1l1CreERT25xFAD mice, while Il3rɑfl/fl mice were crossed to Cx3cr1CreERT2 and 5xFAD mice generating Il3rɑfl/flCX3Cr1CreERT25xFAD mice.
In vivo interventions.
Parabiosis.
The procedure was conducted as previously described10. In brief, age-, sex, and weight-matched animals were used and housed together for a least 14 days prior to surgery. The corresponding lateral aspects of each mouse were shaved, incisions were made from the forelimb joint to the hindlimb joint and the subcutaneous fascia was bluntly dissected to create 0.5 cm of free skin. Fore- and hindlimb joints were joined and the dorsal and ventricle skins were approximated by continuous suture using mononylon 5.0 (Ethicon).
LPS injection.
Mice were injected daily intraperitoneally with 20μg lipopolysaccharide (LPS, Sigma) for 4 days.
BrdU injection.
Mice were injected intraperitoneally with 1.5mg of BrdU (Sigma) twice a day for 5 days.
Recombinant IL-3 brain infusion.
Cannula and osmotic minipump (Alzet) implantation were performed as previously described11. Briefly, mice were anesthetized, the head was shaved and secured in a stereotactic frame (Stoelting). An incision was made above the skull extending behind the shoulder blades. A small hole was drilled in the skull at AP −1; ML −0.27 from bregma and depth 2mm from dura to target the lateral ventricle. The cannula was inserted and glued to the skull. The cannula was connected to an osmotic minipump filled with recombinant IL-3 (Biolegend) conjugated to an anti-IL-3 antibody (Biolegend) as previously described3. Minipumps delivered rIL-3 into the ventricle at a rate of 1μ/day. Minipumps were implanted subcutaneously caudal the shoulder blades. At the end of the procedure the incision was sutured using mononylon 5.0 (Ethicon).
Steriotactic injection.
Mice were anesthetized, the head was shaved and secured in a stereotactic frame (Stoelting). An incision was made above the skull and a hole was drilled at AD −0.1; ML −0.1 from Bregma and depth 0.1mm from dura to target the cortex. Using a 0.5μl Hamilton syringe 3μg of interleukin-3 (Biolegend) conjugated to an anti-interleukin-3 antibody (Biolegend) was delivered in a volume of 0.5μl. Regions of the cortex a minimum 600μm away from the injection site were analyzed.
Peripheral rIL-3 injection.
Mice were injected intraperitoneally with 10μg of recombinant interleukin-3 (Biolegend) conjugated to an anti-interleukin-3 antibody (Biolegend) twice a week for 10 weeks.
Cerebrospinal fluid collection.
Mice were anaesthetized and the skin of the neck was shaved and disinfected with 70% ethanol. Mice were placed in a stereotactic frame (Stoelting) to secure their heads. A skin incision was made at the back of the neck and muscle layers were retracted to expose the cisterna magna. Cerebrospinal fluid was collected by piercing the pia mater with a microcapillary tube (VWR) and allowing CSF to collect in the capillary.
FITC-dextran injection.
4 hours prior to sacrifice mice were injected i.v. with FITC-Dextran (mol. wt. 4000, Sigma Aldrich). At sacrifice mice were perfused at a rate of 5ml/min with 20ml PBS. Brain tissue was homogenized and FITC signal was measured by spectrophotometry in tissue supernatant.
PE-GR1 injection.
4 hours prior to sacrifice mice were injected i.v. with an anti-GR1 antibody conjugated to PE (Biolegend). At sacrifice mice were perfused with 10ml PBS and the leukocyte fraction was isolated from brain tissue prior to flow cytometry analysis.
Tamoxifen injection.
20mg/ml tamoxifen (Sigma Aldrich) was prepared in corn oil and allowed to dissolve at 37°C overnight while shaking. Mice were injected i.p. with 2mg tamoxifen on 4 consecutive days at 2 months of age then monthly thereafter until sacrifice at 5 months of age.
Cells.
Mouse cell collection.
Peripheral blood was collected by retro-orbital bleeding and red blood cells were lysed in RBC lysis buffer (Biolegend). Bone marrow cells were collected by flushing bones with PBS, after which a single-cell suspension was created by passing cells through a 26-gauge needle and red blood cells were lysed with RBC lysis buffer. Brain was excised after PBS (Thermo Fisher Scientific) perfusion, minced and digested with 450 U ml−1 collagenase I, 125 U ml−1 collagenase XI, 60 U ml−1 DNase I and 60 U ml−1 hyaluronidase (Sigma) in PBS for 40 min at 37 °C. Samples were passed through a 70-μm cell strainer and mixed with 30% percol layered on-top of 70% percol. The percol gradient was centrifuged at 500g for 30 mins with brake off. The cell fraction was collected and washed with PBS before downstream applications. Total viable cell numbers were counted using trypan blue (Cellgro, Mediatech) or counting beads (Thermo Fisher Scientific).
Mouse flow cytometry.
Single-cell suspensions were stained in PBS supplemented with 2% FBS and 0.5% BSA. The following monoclonal antibodies were used for flow cytometry analyses: anti-CD45 (BioLegend, clone30-F11, 103147), anti-CD3 (BioLegend, clone 17A2, 100206), anti-CD90.2 (BioLegend, clone 53-2.1, 105308), anti-CD19 (BioLegend, clone 6D5, 115508), anti-B220 (BD Biosciences, clone RA3-6B2, 553089), anti-NK1.1 (BioLegend, clone PK136, 108708), anti-Ly-6G (BioLegend, clone 1A8, 127614), anti-Ly-6C (BioLegend, AL-21, 128006), anti-MHCII (BioLegend, clone M5/114.152, 107602), anti-CD11b (BioLegend, clone M1/70, 101226), anti-CD115 (BioLegend, clone AFS98, 135517), anti-Ter119 (BioLegend, clone TER-119, 116208), anti-CD34 (eBioscience, clone RAM34, 11-0341-85), anti-CD49b (BioLegend, clone DX5, 1089008), anti-CD11c (BioLegend, clone N418, 117310), anti-IL-7Rα (BioLegend, clone SB/199, 121112), anti-CD16/32 (BioLegend, clone 93, 101324), anti-CD150 (BioLegend, clone TC15-12F12.2, 115922), anti-cKit (BioLegend, clone 2B8, 105814), anti-CD135 (BioLegend, clone A2F10, 135310), anti-CD48 (BioLegend, clone HM48-1, 103426), anti-Sca1 (BioLegend, clone D7, 108126), anti-IL-3 (BD Bioscience, clone MP2-8F8, 55483), anti-IL-3Rα (eBioscience, clone 6H6, 14-1239-82), anti-GFAP (eBioscience, G5A, 53-982-80), anti CCL2 (eBioscience, clone 2H5, 11-7096-81), anti-β-amyloid (BioLegend, clone 6E10, 803013), anti-TREM2 (R&D Systems, clone 237920, FAB17291P), anti-CD11c (BioLegend, clone N418, 117333), anti-BrdU (eBioscience, clone BU20A, 17-5071-42). All antibodies were used in a 1:700 dilution except IL-3 and IL-3Rα which was used at a 1:100 dilution. BrdU staining and intracellular staining were performed using a commercial kits according to manufacturers instructions (BD Bioscience). Viable cells were identified as unstained with Zombie Aqua (BioLegend) or 7AAD (BioLegend). Data were acquired on a LSRII (BD Biosciences) and analyzed with FlowJo (Tree Star).
Mouse flow cytometry gating.
Live, singlet cells were identified as (1) Ly-6Chigh monocytes (CD45+CD11b+CD115+Ly-6Chigh), (2) neutrophils (CD45+CD11b+Ly-6G+), (3)Bcells(CD45+B220+CD19+CD11b−), (4) T cells (CD45+CD3+CD90+CD11b−), (5) LSK cells (CD45+Lin−Kit+Sca1+), (6) multipotent progenitor (MPP)4 (CD45+Lin−Kit+Sca1+CD135+CD150−), (7) MPP3 (CD45+Lin−Kit+Sca1+CD135+CD150−CD48+), (8) short-term hematopoietic stem cells (CD45+Lin−Kit+Sca1+CD135+CD150−CD48−), (9) long-term hematopoietic stem cells (CD45+Lin−Kit+Sca1+CD135+CD150+CD48−), (10) common myeloid progenitor (CD45+Lin−Kit+Sca1−CD34+CD16/32mid), (11) granulocyte–macrophage progenitor (CD45+Lin−Kit+Sca1−CD34+CD16/32highCD115−), (12) monocyte–dendritic cell progenitor (CD45+Lin−Kit+Sca1−CD34+CD16/32highCD115+), (13) Microglia (CD45midCD11b+), (14) Astrocytes (CD45−CD11b−GFAP+ or CD45−CD11b−Aldh1l1-GFP+), (15) Other brain cells (CD45−CD11b−GFAP− or CD45−CD11b− Aldh1l1-GFP−). Lin=B220, CD19, CD49b, Ter119, CD90.2, CD11b, CD11c, Ly6G, IL1Rɑ.
Cell sorting.
Brain cell suspensions were stained to identify the indicated cell populations and cells were sorted on a FACS Aria II cell sorter (BD Biosciences) directly into collection medium.
Ex-vivo cell cultures. Microglia.
Sorted microglia were cultured in complete medium (RPMI-1640 supplemented with 10%FBS, 2mM L-glutamine, 10Uml−1 penicillin and streptomycin, 10mM HEPES, 50μM 2-mercaptoethanol, 1mM sodium pyruvate and 1x nonessential amino acids) and kept in humidified 5% CO2 incubator at 37°C. Microglia were exposed to 20ng/ml recombinant IL-3 (Biolegend) and/or 2μg/ml Beta-Amyloid (1-42) HiLyte™ conjugated to pHrodo iFL red (Invitrogen) for 3 hours. T-cells. Naive T cells were isolated from the spleen and lymph nodes using a Naive T cell isolation kit (Miltenyi Biotec) and cultured on anti-CD3 (2 μg/mL) coated plates in the presence of soluble anti-CD28 (2 μg/mL) and rmIL-2 (10 μg/mL) for 3 days and re-stimulated with PMA (100 ng/mL) and ionomycin (500 ng/mL) in the presence of GolgiPlug and GolgiStop (1:1000) for 3.5 hours prior to cell surface staining and analysis.
RNA-seq: WT, Trem2−/−, 5xFAD, and Trem2−/−5xFAD mice.
Microglia isolation and FACS sorting.
Microglia were isolated from 4 and 8-month-old WT, Trem2−/−, 5xFAD and 5xFAD;Trem2−/− mice as previously described12. Briefly, mice were deeply anesthetized with CO2 and transcardially perfused with PBS/1 mM EDTA. Brains were placed into a GentleMacs C-tube (Miltenyi Biotech) with pre-warmed RPMI 1640 medium (Gibco) containing Dispase (2 U/ml), and Collagenase Type 3 (200 U/ml, Worthington Biochemical Corporation). Using the GentleMACS Dissociator (Miltenyi Biotech), brains were subjected to three rounds of dissociation, each followed by a period of incubation at 37°C. After the second round of dissociation, DNase I grade II (Roche) was added to a final concentration of 40 U/ml and incubated at 37°C. After the third round of dissociation, the enzymes were inactivated by adding PBS containing 2 mM EDTA and 5% fetal bovine serum. The brain tissue was triturated, passed through a 100-μm filter (Thermo Fisher Scientific) and centrifuged. Cell pellets were resuspended in 10.5 ml RPMI 1640 medium (Gibco), mixed gently with 4.5 ml physiologic Percoll (Sigma), and centrifuged at 850 g for 40 minutes. Subsequently, cells were rinsed with PBS/1 mM EDTA and centrifuged at 500 g for 8 minutes. Contaminating red blood cells were lysed with Red blood cell lysing buffer (Sigma). Cells were rinsed with PBS/1 mM EDTA and centrifuged at 500 g for 8 minutes. Cell pellets were resuspended in blocking buffer (PBS/1 mM EDTA/2% donkey serum) containing Fc block (1 μg/ml, anti-mouse CD16/32, clone 93, Biolegend) and incubated in ice for 10 minutes. Then, cells were labeled with Alexa647-anti-CD11b (5 μg/ml, clone M1/170, Biolegend) and Alexa488-anti-CD45 (5 μg/ml, clone 30-F11, Biolegend) antibodies for 30 minutes on ice. Cells were rinsed and centrifuged at 400 g for 8 minutes. Cells were resuspended in PBS/1.0 mM EDTA and sorted based on CD11 b/CD45 expression using FACS ARIA (BD Biosciences). FACS-sorted cells were centrifuged at 600 g for 10 minutes and cell pellets were used for RNA extraction.
RNA purification.
RNA purification from microglial samples and mRNA sequencing were performed as previously described12. Briefly, microglial cell pellets were lysed in RLT-Plus buffer (Qiagen) containing 1% β-mercaptoethanol. Cell lysates were transferred to QIAshredder (Qiagen) for homogenization and centrifuged at 18,000 g for 2 minutes. RNA was isolated using the RNeasy Plus Micro Kit (Qiagen). During the RNA extraction protocol, samples were treated with RNase-free DNase I (Qiagen) directly on the RNeasy spin columns at room temperature for 15 minutes and washed with buffer RW1 (Qiagen). Each RNA sample was eluted in RNase-free water (15 μl, Qiagen) and RNA integrity was assessed with the Agilent RNA 6000 Pico Chip on the 2100 Bioanalyzer (Agilent). Purified RNA was quantified using the Qubit RNA High Sensitivity Assay Kit (Invitrogen) on the Qubit Fluorometer 3.0 (Thermo Fisher Scientific). Microglial RNA samples originating from mice of the same genotype, sex and age were pooled as needed to generate samples containing 100 ng of RNA. cDNA libraries were prepared using the TruSeq Stranded mRNA LT Prep Kit (Illumina). The protocol consisted of mRNA purification with poly-T-oligo-attached magnetic beads, mRNA fragmentation, first and second strand cDNA synthesis, 3’end adenylation, adapter ligation, and PCR amplification (11 cycles). Libraries were enriched using the Agencourt AMPure XP beads (Beckman Coulter). cDNA libraries were validated using the Agilent DNA 1000 kit on the 2100 Bioanalyzer (Agilent) and quantified by qPCR before sequencing. Libraries were sequenced on a HiSeq 2500 instrument (Illumina) at the MGH Next Generation Sequencing Core Facility, using single-end 50 bp sequencing.
RNA-seq analysis.
RNA sequencing resulted in 48.7 million reads per sample on average as previously described12. The raw reads of the sequencing data were submitted to NCBI-GEO: GSE132508. The splice-aware alignment program STAR was used to map sequencing reads (fastqs) to the mouse (mm10) reference genome. Gene expression counts were calculated using the program HTSeq based on the latest Ensembl annotation for mm10/GRCm38. The R package edgeR was used to make differential gene expression calls from these counts at a two-fold cut-off and false discovery rate (FDR)<0.05 threshold. Gene expression was considered upregulated if log2FC>1 or downregulated if log2FC<-1 [FC= fold-change of reads per kilobase per million (RPKMs)] at FDR<0.05. To extract expression data for genes of interest, we used the Python Data Analysis Library (Pandas), a powerful tool for indexing and parsing large data frames.
RNA-seq: 5xFAD and Il3−/−5xFAD mice.
Microglia were FACS sorted from brains of 5-month-old animals as described above. Microglia cells were isolated from 12 5xFAD mice (6M/6F) and 12 Il3−/−5xFAD mice (6M/6F). Within each genotype samples from 2M and 2F were pooled generating 3 samples from 5xFAD mice and 3 from Il3−/−5xFAD mice from which RNA was isolatedd the RNA-seq performed. RNA was isolated using E.Z.N.A micro elute total RNA kit according to the manufacturer’s instructions (Omega Biotek). cDNA libraries were prepared using the TruSeq Stranded mRNA LT Prep Kit (Illumina). Libraries were sequenced on a HiSeq 2500 instrument (Illumina) at the MGH Next Generation Sequencing Core Facility, using paired-end 50 bp sequencing. Sequencing reads were mapped in a splice-aware fashion to the Ensembl annotation of the mouse GRCm37/mm9 transcriptome. Read counts over transcripts were calculated using HTseq followed by differential expression analysis using EdgeR. Genes were classified as differentially expressed based on the cutoffs of fold change (FC)>1.6, false discovery rate (FDR)<0.1, and p<0.005.
Gene enrichment analysis.
Gene enrichment analysis was done using Enrichr (https://maayanlab.doud/Enrichr/) with default parameters.
Human iPS triculture microfluidic system.
Microfluidic device fabrication.
Negative photoresists SU-8 10 and SU-8 100 (MicroChem, Newton, MA, USA) were sequentially patterned using standard lithography on a 4-inch (10.16-cm) silicon wafer to create a mold for cell migration channels of 10 μm height and central/side chambers of 100 μm height. The base and a curing agent were mixed at a 10:1 weight ratio (SYLGARD 184 A/B, Dow corning), poured onto the SU-8 mold, and cured for 1 hour at 25 °C under vacuum and, subsequently, cured for more than 3 hours in an oven at 80 °C. The cured poly dimethyl-siloxane (PDMS) replica was peeled off the mold and 4mm holes were punched for cell-containing chambers. PDMS and glass slide assembled, irreversibly, using oxygen plasma at 50 mW, 5 cm, for 30 seconds (PX-250, March Plasma Systems). Immediately after the bonding, 50 μl of diluted BD Matrigel (1:100, BD Biosciences) in DMEM/F12 were injected into each holes and incubated for 2 hours at 25 °C to promote cellular adhesion. The PLL-treated surface was rinsed with autoclaved and 0.2μm filtered water (AM9920, Life Technologies).
3D cell cultures and differentiation of neural progenitor cells (NPCs).
ReN cell VM human neural progenitor cells (NPCs) were purchased from EMD Millipore. For 3D cultures, BD Matrigel (BD Biosciences) was mixed with the cells (1 × 10⁶ cells per mL). The final cell concentration for the mixture was approximately 5 × 10⁴ cells per mL (1:5 3D thin-culture). We then transferred 10 μl of cell mixtures into the microfluidic device using prechilled pipettes. The microfluidic devices were incubated for 1 hour at 37 °C, during gel solidification and then 100 μl differentiation media added13,14. Differentiation media was composed of DMEM/F12 (Life Technologies) media supplemented with 2 mg heparin (StemCell Technologies), 2% (v/v) B27 neural supplement (Life Technologies), 20 mg EGF (Sigma), 20 mg bFGF (Stemgent), and 1% (v/v) penicillin/streptomycin/amphotericin-B solution (Lonza). The 3D-plated cells were differentiated for 4 weeks; media was changed every 3–4 days.
Microglia preparation.
To generate induced microglia-like cells (iMGLs), iPSCs (RUID: FA0000030, Cell Line ID: NH50163) obtained from NINDS iPSC cell repository (distributed through RUCDR, https://www.rucdr.org). Briefly, improved and simplified differentiation of iPSCs to CD43+ primitive hematopoietic progenitor cells (HPCs) has been achieved by using Stem Cell Technologies STEMdiff™ Hematopoietic Kit (Catalog # 05310)15. On day −1, feeder-free iPSCs that have been expanded in TeSR-E8 media are passaged with ReLeaSR (STEMCELL Technologies) into mTeSR E8 medium with 0.5μM Thiazovivin onto matrigel coated (1 mg/mL) 6-well plates (Corning Costar). Small aggregates of ~ 100 cells each are plated at 10–20 aggregates per cm2. Continue to supplement medium B (1 mL) until day 24. On day 25, cells are centrifuged leaving 1 mL conditioned media per 35 mm well. On day 25, cells are re-suspended in microglia media plus 100 ng/mL IL-34, 50 ng/mL TGFβ1,25 ng/mL M-CSF, 100 ng/mL CD200 and 100 ng/mL CX3CL1 to further mature microglia and ensure homeostasis. On day 27, microglia media with the five cytokine cocktails is added (1 mL per well). Before the experiment, cells were incubated with CellTracker Deep Red Dye (10 μM in DMSO, C34565, Invitrogen) for 30 minutes and washed using medium without serum. After centrifugation (200 g for 5 min), the cells were resuspended in 1 mL of microglia media (1 x 10⁶ cells/mL). We injected 10 μL of the cell suspension into each side chamber and 100 μL of a culturing medium was added into side chambers. The loaded 3D microdevices were then incubated at 37 °C supplied with 5% CO2.
Recombinant IL-3 treatment.
For treatment with human recombinant IL-3 (Abcam), NPC differentiation media containing 15 μg of IL-3 was added to 3-week differentiated 3D culture in central chamber. Recombinant IL-3 was maintained in the media for an additional 2 weeks throughout the migration experiment.
Time-lapse imaging.
After microglia loading, cells were recorded using time-lapse imaging using a fully automated Nikon C2s confocal laser scanning microscope (Nikon Instruments Inc.) with a heated incubator to 37 °C and 5% CO2 (20× magnification; Micro Device Instruments, Avon, MA, USA).
Flow cytometry.
Cells of the central chamber were collected and repeatedly pipetted in media to break up Matrigel. Cells were centrifuged and washed with PBS. The single cell suspensions were stained with antibodies in PBS. The following monoclonal antibodies were used at a dilution of 1:700 for flow cytometry analyses: anti-mouse/human CD45 (BioLegend, clone30-F11, 103147), anti-mouse/human CD11b (BioLegend, clone M1/70, 101226). CountBright™ absolute counting beads (Invitrogen) were added to the cell suspension to enumerate cells. Samples were run on Microglia were identified as live CD11b+CD45+ cells. Data were acquired on a LSRII (BD Biosciences) and analyzed with FlowJo (Tree Star).
MSD ELISA Aβ and chemokines measurement.
Levels of Aβ38, Aβ40 and Aβ42 in media were simultaneously measured by a multi-array electrochemiluminescence assay kit (K15200E-2, V-PLEX Aβ Peptide Panel 1 (6E10) kit, Meso Scale Diagnostics (MSD)). To quantify Aβ levels in differentiation media, conditioned media from central chamber was collected at each condition, diluted 1:6 with MSD dilution buffer, and analyzed using the assay kit. Human Chemokine Array (K15047G-1, MSD) kit was used to simultaneously detect relative expression levels of 10 human chemokines. Conditioned media (20 μl from each sample) were collected and analyzed following manufacturer’s protocol.
Immunostaining.
For immunofluorescent stains, we rinsed the cells and 3D cultures twice with PBS (phosphate-buffered saline). Cells were then fixed through at room temperature (30 min incubation in fresh 4% paraformaldehyde aqueous solution (157-4, ElectronMicroscopy Sciences) followed by rinsing twice with PBS. Cells were permeabilized through incubation in 0.1% Triton X-100 in PBST (phosphate-buffered saline with 0. 1% Tween 20) for 15 min at RT. Cell-specific binding was blocked through overnight incubation in 3% human serum albumin in PBST at 4 °C. After 24-h incubation with the primary antibody solutions at 4 °C, the cells were washed five times. The following antibodies (and dilutions) were used: anti-PHF (1:1,000, A gift from P. Davies, Albert Einstein College of Medicine), anti-GFAP (1:500, Millipore), anti-P2RY12 (1:400, Sigma), anti-IL3Rα (1:200, Biolegend), anti-beta-tubulin III (1:200, Abcam) and anti-IL-3 (1:200, Invitrogen).
Histology.
Mouse.
Brains were harvested from 5xFAD and Il3−/−5xFAD mice and fixed in 10% formalin overnight. The fixed brains were paraffin-embedded and sectioned in the sagittal plane. The paraffin-embedded sections were deparaffinized and rehydrated prior to immunofluorescent staining. Heat induced antigen retrieval was performed using Retrievagen A (pH6.0) (550524, BD Biosciences), and the sections were permeabilized with 0.3% Triton X-100 in PBS for 10 minutes at room temperature. After the sections were blocked with 4% normal goat serum in PBS, primary antibodies, Iba-1 (1:200, 019-19741, FUJIFILM Wako Chemicals) and Alexa Fluor 488 anti-β-Amyloid, 1-16 (1:250, 803013, 6E10, BioLegend), were incubated at 4°C overnight. A biotinylated goat anti-rabbit IgG secondary antibody and streptavidin DyLight 594 (1:100, BA-1000 and 1:600, SA-5594, Vector Laboratories) were applied to detect Iba-1. Brains from Aldh1l1GFP, Il3GFPfl/fl, Il3−/− and WT mice were harvested and fixed in 4% paraformaldehyde solution at 4°C overnight. After rinsing with PBS, the fixed brains were placed in 30% sucrose in PBS at 4°C overnight. The brains were embedded in O.C.T. compound and serial frozen sections (10μm) were prepared using CryoJane Tape Transfer System (Leica Biosystems). For Aldh1l1GFP and Il3GFPfl/fl mice, an anti-GFP antibody (1:400, ab13970, Abcam) and a goat anti-chicken IgY secondary antibody, Alexa Fluor 488 (1:100, A-11039, Thermo Fisher Scientific) were used to detect GFP-Aldh1l1 and GFP-IL3. An anti-IL3 antibody (1:5, 503902, MP2-8F8, BioLegend) followed by a biotinylated rabbit anti-rat IgG secondary antibody and streptavidin DyLight 594 (1:100, BA-4001 and 1:600, SA-5594, Vector Laboratories) were used for IL-3 detection in Aldh1l1GFP mice. A GFAP, eFluor 615 monoclonal antibody (1:25, 42-9892-80, GA5, Thermo Fisher Scientific) was used to detect astrocytes on Il3GFP mice. For co-localization of IL-3Rɑ with Iba1, an anti-Interleukin 3 Receptor Alpha antibody (1:50, 141039, US Biological) and an anti-Iba-1 antibody (1:50, ab5076, Abcam) were incubated at 4°C overnight after blocking with 4% donkey serum in PBS. A donkey anti-rabbit IgG secondary antibody, Alexa Fluor 555 (1:100, A-31572, Thermo Fisher Scientific) and a donkey anti-goat IgG secondary antibody, Alexa Fluor 488 (1:100, A-11055, Thermo Fisher Scientific) were used to detect IL-3Rɑ and Iba-1 respectively. An Alexa Fluor 647 anti-β-Amyloid, 1-16 antibody (1:50, 803021, 6E10, BioLegend) was used to identify amyloid plaques in the brains. For Il3−/− and WT mice, Doublecortin (1:400, 4604S, Cell Signaling Technology) and active Caspase-3 (1:50, 559565, C92-605, BD Biosciences) were stained to detect neuronal precursor cells and apoptotic cells respectively. A biotinylated goat anti-rabbit IgG secondary antibody and streptavidin DyLight 594 (1:100, BA-1000 and 1:600, SA-5594, Vector Laboratories) were used for the staining. Nuclei were counterstained with DAPI (1:3000, D21490, Thermo Fisher Scientific). The images were captured by using a digital scanner NanoZoomer 2.0RS (Hamamatsu, Japan) or an automated fluorescence microscope, BX63 (Olympus). Image analysis and quantification was done with ImageJ software. Microglia morphology analysis was done using the Skeletonize plug-in for ImageJ.
Mouse whole-mount 3-dimensional confocal imaging.
Brains were excised from 5-month-old 5xFAD and Il3−/− 5xFAD animals, cut in half along the sagittal plane, and fixed in 4% paraformaldehyde for 24 hours at 4°C. Tissue was washed 3 times with PBS for 1 hour at room temperature then embedded in 4% agrose and 250μm sections were cut using a Pelco 101 vibratome. Sections were washed 3 times in PBS containing 1% Triton-x100 for 30 minutes with gentle rotation and then incubated for 1 hour in blocking solution: PBS containing 1% Triton-x100, and 20% goat serum. Sections were then incubated for 3 days at 4°C in anti-Iba1 (Wako) and Anti-β amyloid (already conjugated to AF488, Biolegend) primary antibodies each at a dilution of 1/300 in blocking solution. Sections were then washed 3 times in blocking solution followed by 3 washes in PBS containing 1% Triton-x100. Sections were incubated overnight at 4°C in anti-rabbit AF633 (Life Technologies) at a dilution of 1/200 in blocking solution. Finally, sections were washed 3 times in PBS containing 1% Triton-x100. Prior to imaging, sections were cleared using RapiClear 1.49 by immersion in the clearing solution for 20 minutes at room temperature. The cleared tissues were then mounted on a custom-made sample holder and imaged using an Olympus FV1000 microscope. Images were processed with Amira 3D software.
Human.
Brain paraffin-embedded slides were obtained from the Massachusetts Alzheimers Disease Research Center Brain Bank, and anti-IL-3 (1:100, 524379, US Biological), anti-IL-3Rɑ (1:50, 14-1239-82, 6H6, Thermo Fisher Scientific), Alex Fluor 488 anti-GFAP (1:50, 53-9892-82, GA5, Thermo Fisher Scientific), and anti-Iba-1 (1:200, 019-19741, FUJIFILM Wako Chemicals) were used as primary antibodies. Biotinylated goat anti-rabbit IgG and horse anti-mouse IgG secondary antibodies were applied for IL-3 and IL-3Rɑ respectively (1:100, BA-1000 and BA-2000, Vector Laboratories) followed by streptavidin DyLight 594 (1:600, SA-5594, Vector Laboratories). A goat anti-rabbit IgG secondary antibody, Alexa Fluor 488 (1:100, A-11034, Thermo Fisher Scientific) was used for Iba-1detection, and nuclei were counterstained with DAPI (1:3000, D21490, Thermo Fisher Scientific). All the slides were scanned by a digital scanner NanoZoomer 2.0RS (Hamamatsu, Japan).
Microglia density and spatial analysis.
During a preprocessing stage the image quality of the images was improved by reducing the fluorescence bleed-through signal and increasing the signal contrast to optimize cellular segmentation. To enhance cell contrast we utilized a contrast-limited adaptive histogram equalization algorithm and spatially filtered and denoised the images. A watershed algorithm was implemented to count individual cells, and a threshold was determined to reject objects with an area less than 45 microns square. The center position was determined for each cell. For each individual fluorescence channel, all processing and threshold parameters were kept fixed across all samples to guarantee consistency in the segmentation process of both AB plaques and microglia. The spatial data analysis was performed in 2D on the obtained segmented cells using a KNN (k-nearest neighbor) algorithm from the scikit-learn python package. For each segmented AB plaque, we then calculated the total number of microglia present at different interval distances from the center of it. Specifically, we selected a fixed binning interval of 45 microns and incrementally calculated the number of microglia present in the circular area cantered on the AB plaque and in the ring-shaped regions bounded by the concentric circles of progressively incrementing radiuses. The number of counted microglia is then normalized by the area of the considered region divided by the total number of microglia present in the brain section, and the average microglia density is then plotted as a function of distance. All software was written in python utilizing opencv, numpy, and scikit-learn packages.
Molecular Biology.
Enzyme-linked immunosorbent assay. Mouse.
IL-3 levels were measured using enzyme-linked immunosorbent assay (ELISA) kit (Boster Biological) according to the manufacturer’s instructions. 3 hours prior to sacrifice mice were injected with a biotinylated anti-IL-3 capture antibody (Biolegend) as previously described3. Measurement of β-amyloid was done as previously described16. Briefly, brains were extracted and corticies were directed and homogenized in 8 volumes of TBS containing 5mM EDTA, phosphatase inhibitor (ThermoFisher), EDT-free protease inhibitor cocktail (Roche) and 2mM 1,10-phenantroline (Sigma). Homogenates were centrifuged at 100,000g for 1 hour at 4°C using an Optima TL ultracentrifuge and a Ti70 rotor (Beckman Coulter). Supernatants were collected and used to measure TBS-soluble Aβ. The resulting pellet was homogenized in 70% formic acid. Samples were centrifuged at 100,000g for 1 hour at 4°C and supernatants were collected. Formic acid-containing supernatants were neutralized with 1M T ris-base, pH 11 (1:20 v:v) and samples were used to measure formic acid-soluble Aβ. Aβ40 and Aβ42 ELISAs were performed using Aβ ELISA kits (Wako). Human. Human brain IL-3 levels were measured using ELISA (Boster Biological). Briefly, samples of human cortex were weighed, homogenized in RIPA buffer and centrifuged at 8000RPM for 2 minutes. IL-3 levels were measured in supernatant. Measurement of β-amyloid was done as previously described16. Briefly, brains were extracted and corticies were directed and homogenized in 8 volumes of TBS containing 5mM EDTA, phosphatase inhibitor (ThermoFisher), EDT-free protease inhibitor cocktail (Roche) and 2mM 1,10-phenantroline (Sigma). Homogenates were centrifuged at 100,000g for 1 hour at 4°C using an Optima TL ultracentrifuge and a Ti70 rotor (Beckman Coulter). Supernatants were collected and used to measure TBS-soluble Aβ. The resulting pellet was homogenized in 70% formic acid. Samples were centrifuged at 100,000g for 1 hour at 4°C and supernatants were collected. Formic acid-containing supernatants were neutralized with 1M T ris-base, pH 11 (1:20 v:v) and samples were used to measure formic acid-soluble Aβ. Aβ40 and Aβ42 ELISAs were performed using Aβ ELISA kits (Wako).
Mouse qPCR.
Total RNA was isolated using the RNeasy Mini Kit (Qiagen) or the NucleoSpin RNA XS kit (Takara Bio) according to the manufacturer’s instructions. RNase-free DNase Set (Qiagen) was used for DNase digestion during RNA purification. RNA quantity and quality were assessed by Nanodrop for RNA isolated from tissues and with the Aglient RNA 6000 Pico kit (Aglient Technologies) on the Aglient 2100 Bioanalyzer for RNA of fluorescence-activated cell sorting (FACS)-purified cells. cDNA was generated from 1 μg of total RNA per sample using the High Capacity cDNA Reverse Transcription Kit (Applied Biosystems). Quantitative real-time TaqMan PCR was performed using the following FAM labelled TaqMan primers (Applied Biosystems): Il3 (Mm00439631_m1), Il3rα (Mm00434273_m1), Ccl2 (Mm00441242_m1), Complement C3 (Mm01232779_m1), Gfap (Mm01253033_m1), Ccl7 (Mm00443113_m1), Ccl5 (Mm01302427_m1), Il1β (Mm00434228_m1), Tnfα (Mm00443258_m1), Il6 (Mm00446190_m1), IL10 (Mm01288386_m1), Ccl12 (Mm01617100_m1), Trem2 (Mm04209424_g1), Syk (Mm01333032_m1), Tyrobp (Mm00449152_m1), Cd33 (Mm00491152_m1), Cd36 (Mm00432403_m1), Tlr4 (Mm00445273_m1), Sra (Mm00491755_m1), Cd206 (Mm01329362_m1), Mpp9 (Mm00442991_m1), Spp1 (Mm00436767_m1), Clec7a (Mm01183349_m1), Lyz2 (Mm04214174_uH), Apoe (Mm01307192_m1), Itgax (Mm00498708_g1), Itgam (Mm00434455_m1), Ptprc (Mm01293577_m1), Ctsg (Mm00456011_m1), Igf1 (Mm00439560), Cd68 (Mm03047343_m1). VIC labelled Actb (Mm00607939_s1) was used as the housekeeping gene. Results were analyzed by the comparative CT method. Average CT values for each sample were normalized to the average CT values of the housekeeping gene.
Human qPCR.
RNA was extracted from human brain tissue (frontal cortex) with Trizol (Life Technologies) following manufacturer’s instructions. The extracted RNA was dissolved in water and purified using the RNAeasy Mini Kit (Qiagen) according to the manufacturer’s protocol. Alternatively,RNA was isolated using E.Z.N.A. Total RNA kit (Omega BIotek). Purified RNA was quantified using Qubit RNA Broad Range Assay Kit (Thermo Fisher Scientific) on the Qubit Fluorometer 3.0 (Thermo Fisher Scientific). RNA (1 μg) was reverse-transcribed using the SuperScript III First Strand Synthesis System and oligo-DT(20) primer (Invitrogen). Gene expression was assessed by performing Taqman real-time PCR assays. The probe targeting human Il3rα was labeled with FAM (Hs00608141_m1, Thermo Fisher Scientific). The probe targeting the human housekeeping gene Gapdh was labeled with VIC (Hs02786624_g1, Thermo Fisher Scientific). 1:10 diluted cDNAs were mixed with the probes and Taqman Universal Master Mix II (Applied Biosystems) and amplified using the C1000 Touch Thermal Cycler (Bio-Rad). Results were analyzed by the comparative CT method. Average CT values for each sample were normalized to the average CT values of the housekeeping gene. SNP genotyping. Genotyping was performed at two SNPs, rs429358 and rs7412, using a Taqman genotyping assay (Life Technologies) according to manufacturer’s instructions.
Behavior phenotyping.
Y-maze.
Y-maze testing was adapted from published protocols17. The Y-maze apparatus consisted of three arms joined in the middle to form a Y shape. The walls of the arms were 10cm high and each were marked with a single large black letter serving as a spatial landmark and clue. With one arm of the maze closed, mice were allowed to explore the other two arms for 5 minutes before being returned to their home cage. Twenty minutes later, mice were returned to the Y-maze and allowed to explore all three arms for 5 min while being video recorded. The time spent in the new arm was quantified.
Morris Water Maze.
The Morris Water Maze was conducted in the Animal Behavior Facility at the Massachusetts General Hospital. The Morris water maze test was performed with minor adjustment as previously described18. Spatial memory testing was conducted in a circular tank (diameter 1.22 m) filled with opacified water at 23°C. The water tank was dimly lit and surrounded by a white curtain. The maze was virtually divided into four quadrants, with one containing a hidden platform (diameter 10 cm) that was submerged 0.5 cm below the water level. Four prominent cues were placed outside the maze as spatial references. Mice were placed in the water facing the tank wall at different start positions across trials in a quasi-random fashion to prevent strategy learning. Mice were allowed to search for the platform for 1 minute; if the mice did not find the platform, they were guided toward it where they remained for 20 s. Each mouse went through four trials (one from each start position) per day for seven consecutive days. After each trial, the mouse was dried and placed back into its cage until the start of the next trial. All mouse movements were recorded by the computerized tracking system EthoVision XT (Noldus) that calculated distances moved and time required to reach the platform (escape latency), along with swim speed. The spatial probe trial was conducted 24 hours after the last training session (on day 8). For the probe trial, the platform was removed and mice were allowed to swim for 1 minute. The time spent by the mice in the area surrounding the location where the platform used to be (platform plus) was recorded. The platform plus surrounding the target is larger than the target itself, but smaller than the target quadrant. Data was calculated as time in the platform plus/60 s*100% and is given in percentage.
Statistics.
Results are shown as mean ± s.e.m. Statistical analysis was performed using GraphPad Prism 7 (Graphpad Software). Statistical tests included unpaired, two-tailed non-parametric Mann–Whitney U-tests (when Gaussian distribution was not assumed). For multiple comparisons, a non-parametric multiple-comparisons test comparing the mean rank of each group (when Gaussian distribution was not assumed) was used, or one-or two-way ANOVAs followed by Turkey’s test were used. For correlation analysis the mean expression level from individuals of equal disease duration was determined and correlation was computed using Pearson correlation coefficients. P values of 0.05 or less were considered to denote significance.
Extended Data
Extended Data Fig. 1. Analysis of Il3−/− mice.
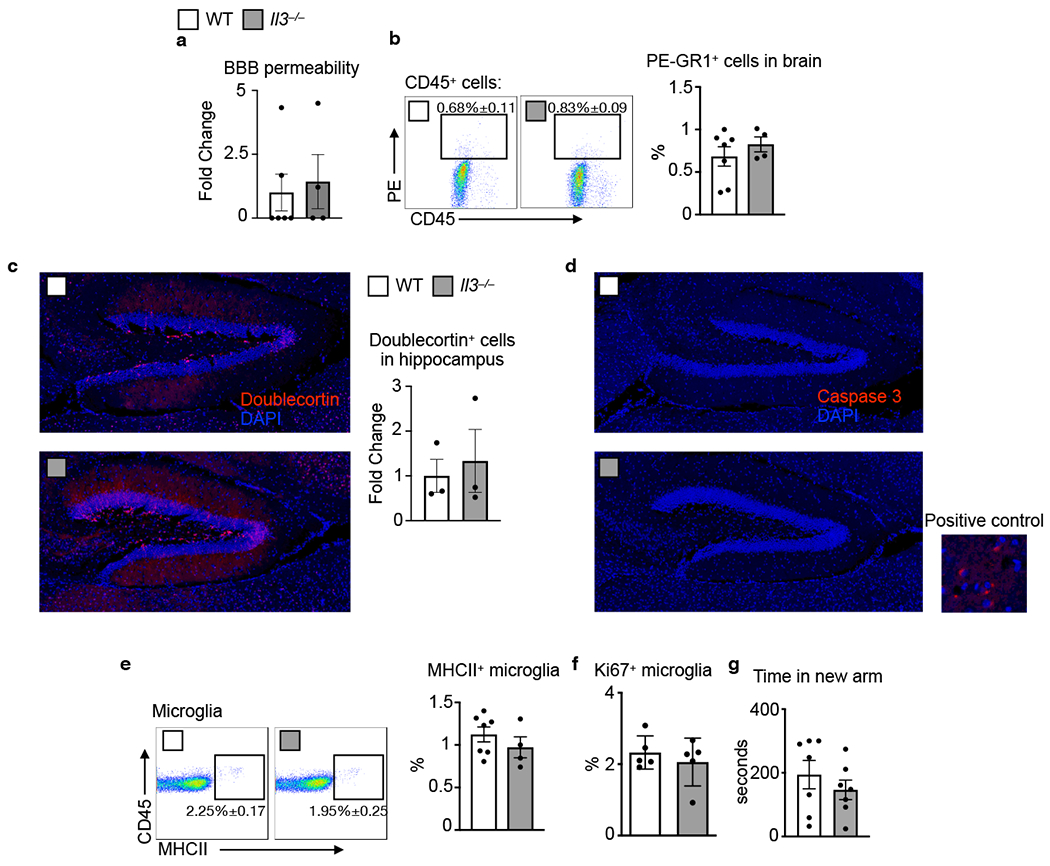
a. FITC-dextran (mol. wt. 4000) was i.v. injected into WT and Il3−/− mice prior to sacrifice. Blood brain barrier integrity was determined by measuring FITC signal in brain homogenate (n=4-6). b. Prior to sacrifice WT and Il3−/− mice were i.v. injected with an anti-GR1 antibody conjugated to PE to label all circulating monocytes and neutrophils. PE signal among CD45+ cells was assessed in the brain by flow cytometry (n=4-7). c. Doublecortin staining and quantification in the hippocampus of WT and Il3−/− mice at 4 months of age (n=3). d. Absence of Caspase 3 staining in the hippocampus of WT and Il3−/− mice along with a representative image of rare positively stained cells from the thalamus (n=3). e. Assessment of MHCII+ microglia in the brain of WT and Il3−/− mice (n=4-7). f. Analysis of Ki67+ proliferating microglia (n=5). g. Time in new arm during Y-maze testing (n=6-7). Groups of mice are of evenly mixed sex. Error bars indicate mean ± SEM.
Extended Data Fig. 2. Hematopoiesis and peripheral immune cell dynamics in WT, 5xFAD, and Il3−/−5XFAD mice.
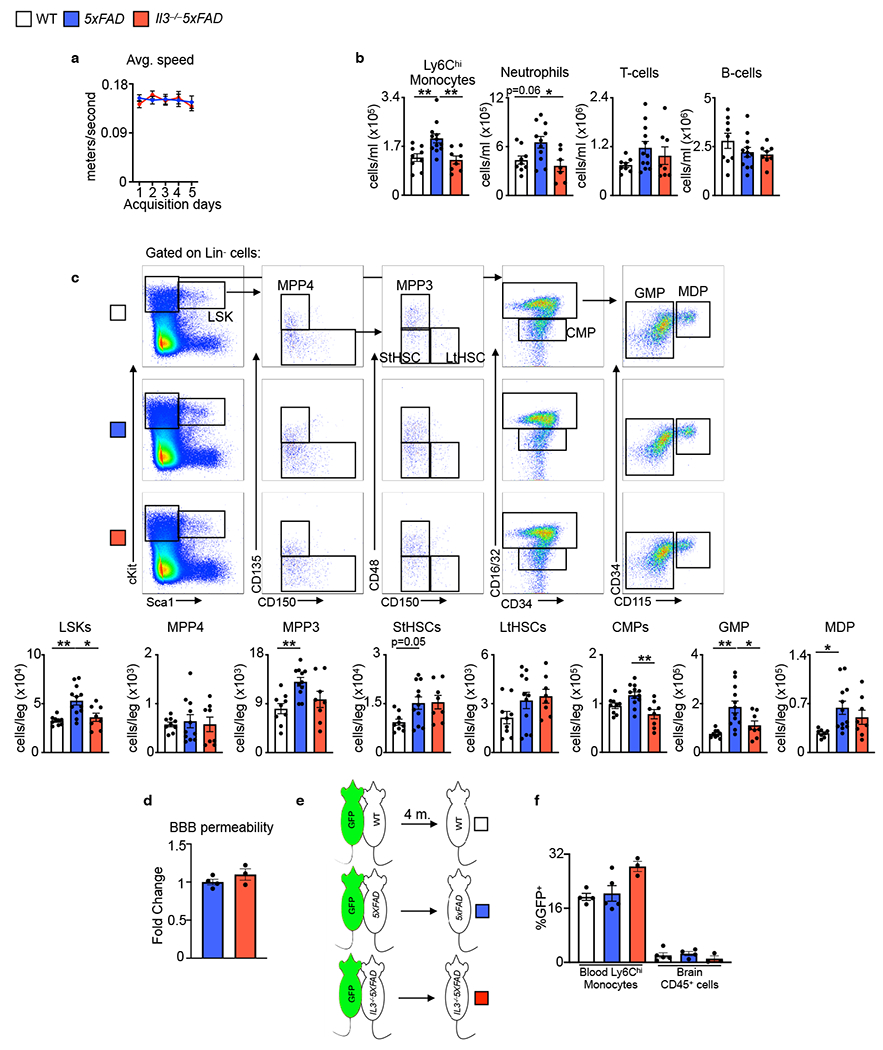
a. Average swim speed during acquisition days of Morris water maze (n=9-10). b. Flow cytometry assessment of blood leukocytes. c. Flow cytometry analysis of Lin−Sca1+cKit+ (LSKs), multi-potent progenitors (MPP)-4 and -3, short-term hematopoietic stem cells (StHSCs), long-term HSCs (LtHSCs), common myeloid progenitors (CMPs), granulocyte macrophage progenitors (GMPs), and monocyte dendritic progenitors (MDPs) in the bone marrow of 5-month-old WT, 5xFAD, and Il3−/−5xFAD mice (n=7-12). d. FITC-dextran (mol. wt. 4000) was i.v. injected into 5xFAD and Il3−/−5xFAD mice prior to sacrifice. Blood brain barrier integrity was determined by measuring FITC signal in brain homogenates (n=4). e. WT, 5xFAD, Il3−/−5xFAD mice were joined by parabiosis with UbiGFP mice from the age of 2 to 6 months (4 months total). f. GFP chimerism in blood Ly6Chi monocytes and brain CD45+ cells was assessed by flow cytometry in the WT, 5xFAD, and Il3−/−5xFAD parabiont (n=4-5). Groups of mice are of evenly mixed sex. *p<0.05, **p<0.01, ***p<0.001. Error bars indicate mean ± SEM.
Extended Data Fig 3. Generation and validation of Il3GFPfl/flAldh1/1CreERT25XFAD and Il3rɑfl/flCx3cr1CreERT25XFAD mice.
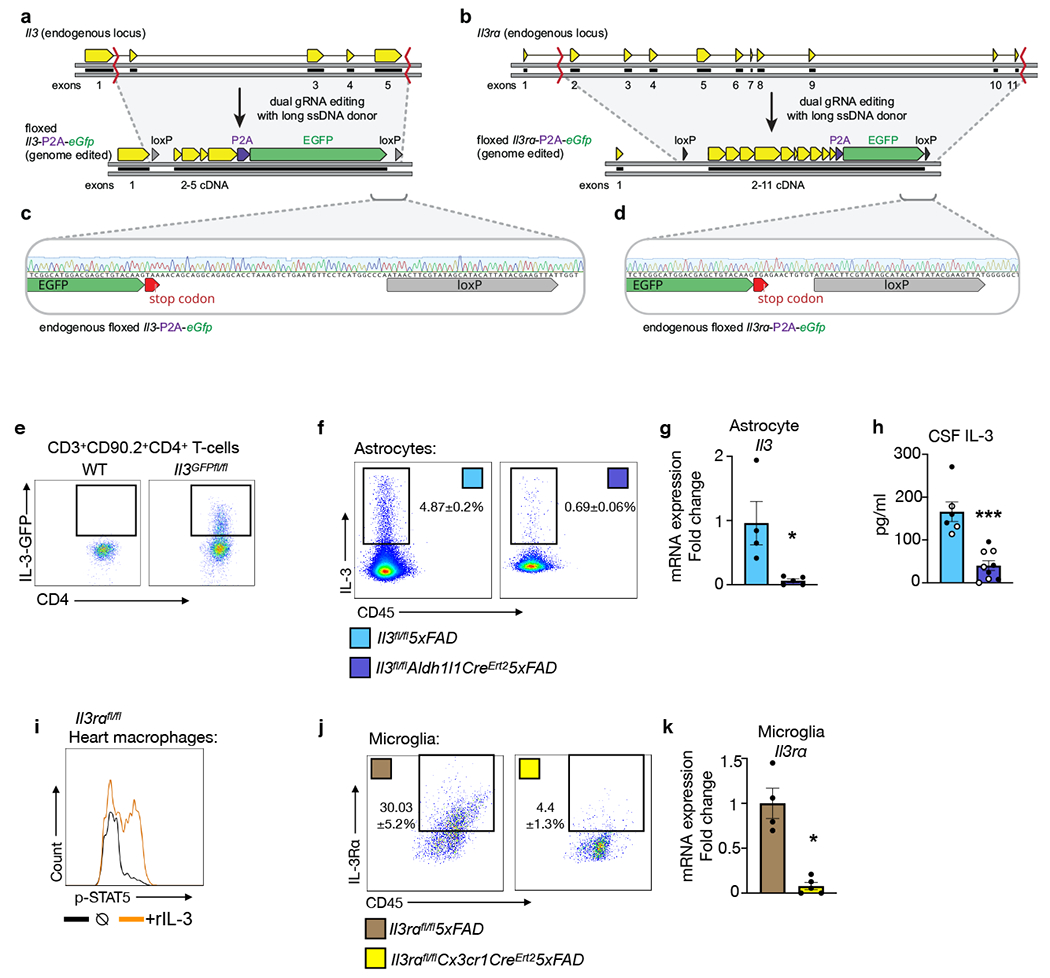
Schematics of the endogenous loci and editing strategies to generate conditional/reporter models for Il3 (a) and Il3rɑ (b). Mice were generated by excising large fragments of the endogenous loci by co-delivery of SpCas9 and two gRNAs, and in the presence of a long single stranded DNA donor encoding a loxP-cDNA-P2A-EGFP-loxP cassette. Representative Sanger sequencing traces validating insertion of the loxP-cDNA-P2A-EGFP-loxP cassettes at the endogenous loci of Il3 (c) and Il3rɑ (d). Missense mutation quench the GFP signal in Il3rɑ targeted mice. e. GFP signal in ex-vivo stimulated splenic and lymph node T-cells, known IL-3 sources, from WT and Il3GFPfl/fl mice. f. Flow cytometry analysis of astrocyte IL-3 production in 5-month-old Il3GFPfl/fl5xFAD and Il3GFPfl/flAldh1/1CreERT25xFAD mice injected with tamoxifen. g. qPCR analysis of Il3 mRNA expression in sorted astrocytes. h. CSF IL-3 levels. Filled circles represent male mice, open circles represent female mice. i. STAT5 phosphorylation in ex-vivo heart macrophages from Il3rɑfl/fl mice simulated with recombinant IL-3. j. Flow cytometry analysis of microglia IL-3Rα production in 5-month-old Il3rɑfl/fl5xFAD and Il3rɑfl/flCx3cr1CreERT25xFAD mice injected with tamoxifen. k. qPCR analysis of Il3rɑ mRNA expression in sorted microglia. All Il3GFPfl/fl5xFAD, Il3GFPfl/flAldh1/1CreERT25xFAD, Il3rafl/fl5xFAD, and Il3rɑfl/flCx3cr1CreERT25xFAD mice were injected with tamoxifen beginning at 2 months of age. **p<0.01, ***p<0.001. Error bars indicate mean ± SEM.
Extended data Fig. 4. Flow cytometry gating strategy and histology controls.
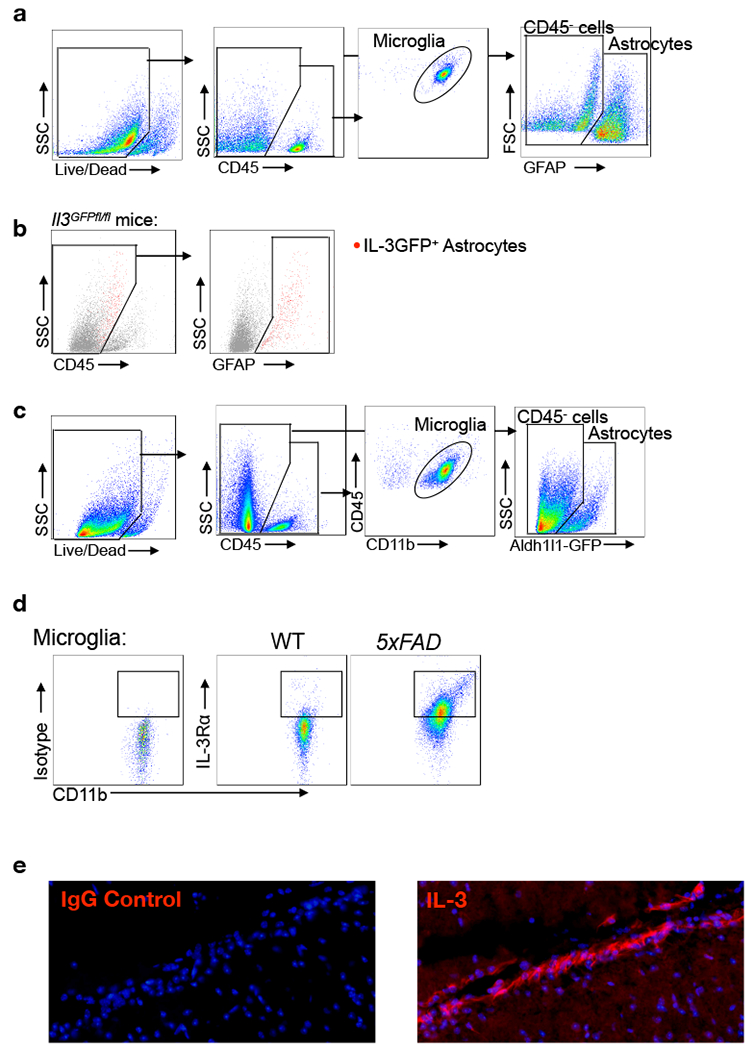
a. Gating strategy used to identify cell populations in the brain of all mice except Aldh1/1GFP mice. b. Backgating of GFP+ astrocytes in Il3GFPfl/fl mice. c. Gating Strategy Used to identify cell populations in the brain of Aldh1/1GFP mice. d. Gating and isotype control plots for microglia IL-3Rɑ staining. e. Representative images of IgG control antibody staining and IL-3 staining in the brain.
Extended Data Fig. 5. Astrocyte IL-3 and microglia IL-3Rɑ production.
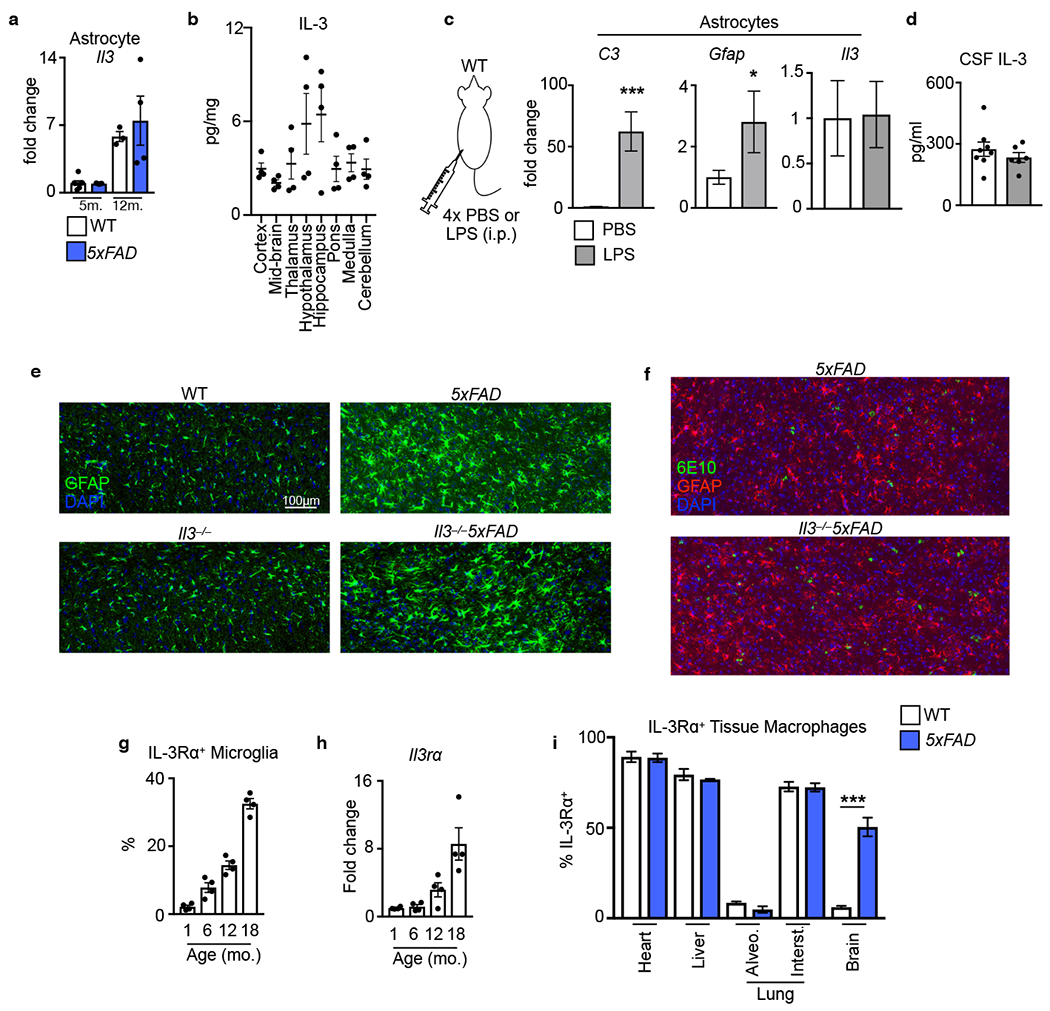
a. Il3 expression in astrocytes sorted from WT and 5xFAD mice at 5 and 12 months of age. b. Tissue IL-3 levels in various brain regions in WT mice at 4 months of age (n=4). c. Scheme of daily i.p. LPS injection into WT mice over 4 days and qPCR analysis of complement C3 and gfap in sorted astrocytes after LPS injection (n=6). d. Cerebrospinal fluid IL-3 levels (n=6-8). e. Representative images of GFAP+ astrocytes in the cortex of WT, Il3−/−, 5xFAD, and Il3−/−5xFAD mice. f. Representative images of Aβ deposits (6E10) and astrocytes (GFAP) in 5xFAD and Il3−/−5XFAD mice. g. Proportion of IL-3Rɑ+ microglia in the brain of WT mice at various ages (n=4). h. Il3rα transcript expression in brain homogenate of WT mice at various ages (n=4). i. Proportion of IL-3Rɑ+ macrophages in heart, liver, lung (interstitial and alveolar), and brain of WT and 5xFAD mice at 8 months of age (n=4). *p<0.05, **p<0.001. Error bars indicate mean ± SEM.
Extended Data Fig. 6. Il3rɑ expression in homeostatic microglia, TREM2-independent type 1 DAMs, and TREM2-dependent type 2 DAMs.
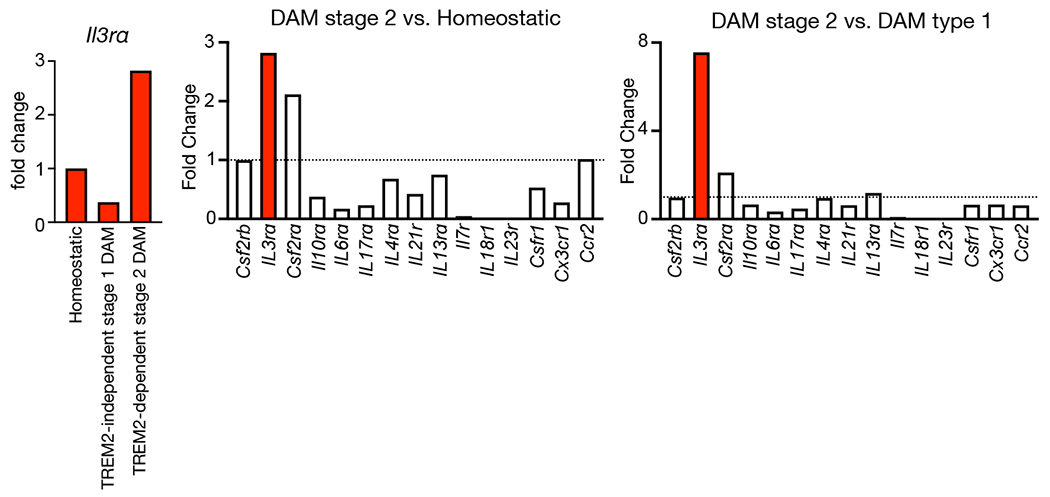
Analysis of Il3rɑ and other cytokine receptors expressed in resting microglia, DAM stage 1, and DAM stage 2 microglia. Data are published in Keren-Shaul et al. Cell, 2017.
Extended Data Fig 7. Characterization of IL-3Rɑhi and IL-3Rɑlo microglia.
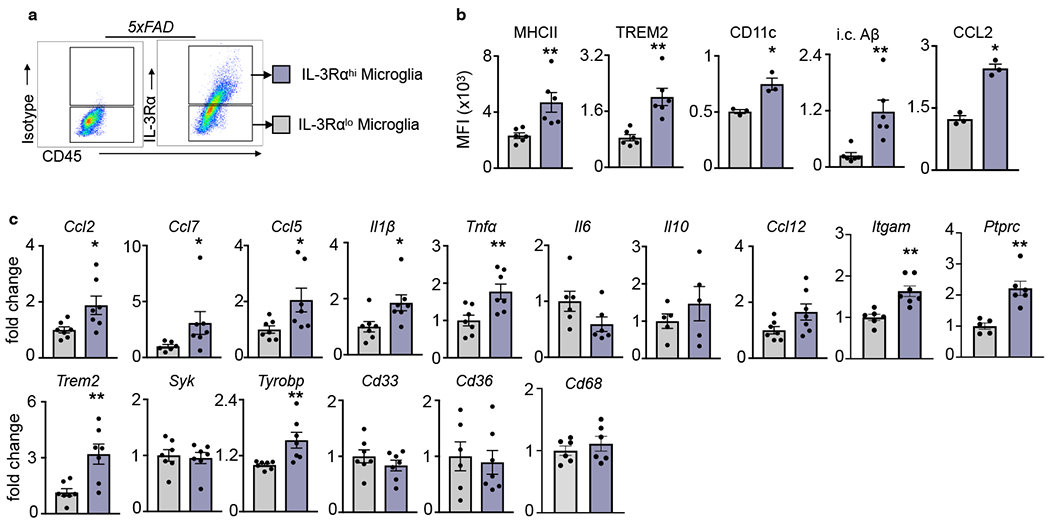
a. Gating strategy for IL-3Rɑhi and IL-3Rɑlo microglia in 5xFAD mice. b. Flow cytometry analysis of IL-3Rɑhi and IL-3Rɑlo microglia (n=3-6). c. mRNA transcript expression in sorted IL-3Rɑhi and IL-3Rɑlo microglia (n=5-7). *p<0.05, **p<0.01. Error bars indicate mean ± SEM.
Extended Data Fig. 8. IL-3 does not influence microglia proliferation, the recognition and phagocytosis of Aβ, or the production of inflammatory cytokines.
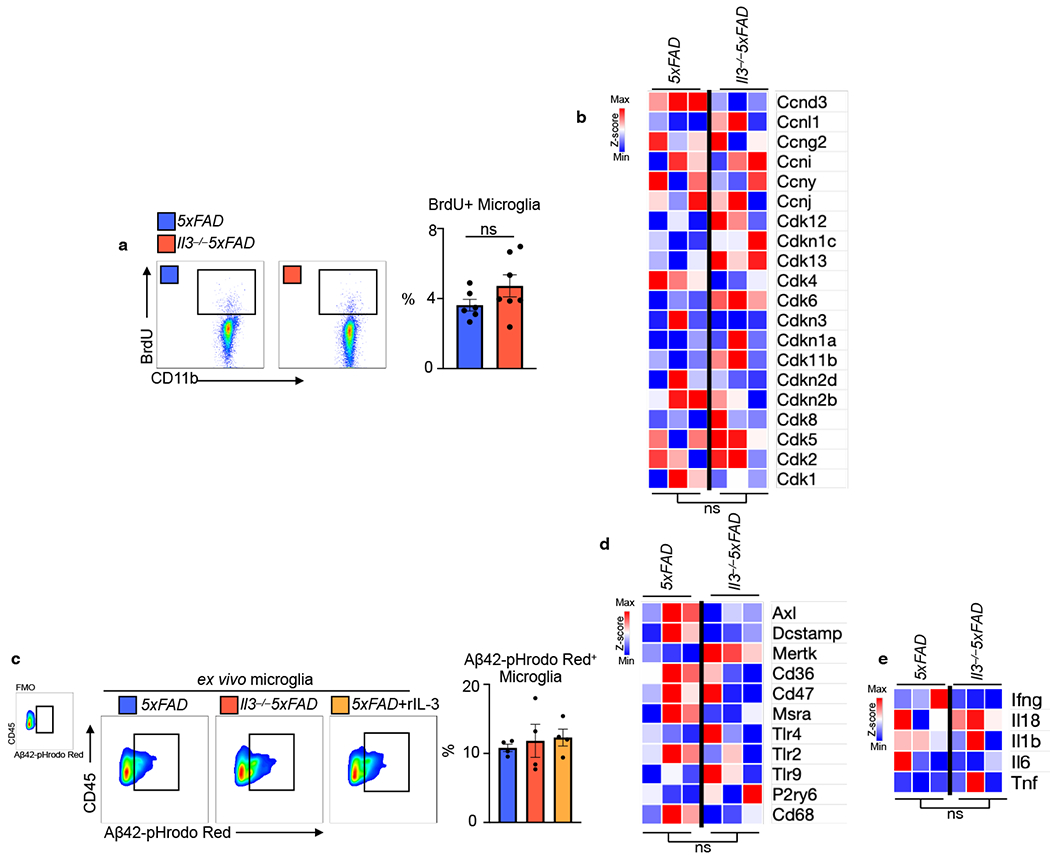
a. BrdU incorporation into microglia (n=6-7). b. Heatmap of microglia RNAseq expression data of genes important to cell cycle and proliferation. c. Assessment of ex vivo phagocytosis of Aβ42 conjugated to a pH-sensitive dye (PHrodo Red) in sorted microglia lacking Il3 or stimulated with recombinant IL-3 (n=4). d. Heatmap of microglia RNAseq expression data of genes important to Aβ recognition and phagocytosis. e. Heatmap of microglia RNAseq expression data of inflammatory cytokines. Groups of mice are of evenly mixed sex. Error bars indicate mean ± SEM. ns = not significant
Extended Data Fig. 9. Human AD iPS triculture system.
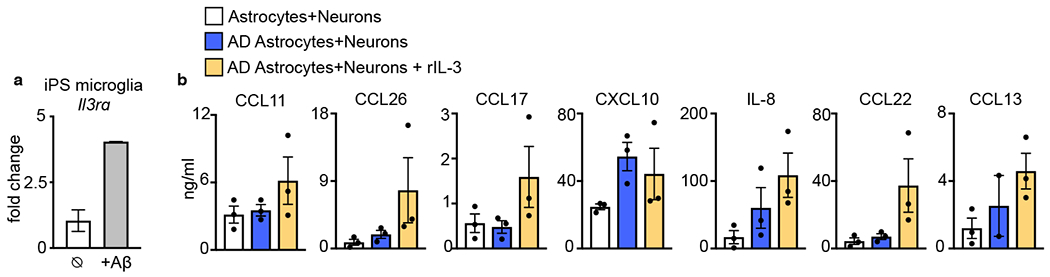
a. Il3rɑ expression in human iPS microglia exposed to Aβ (n=2). b. chemokine and cytokine levels in the media of the human AD iPS triculture system. (n=2-3). Error bars indicate mean ± SEM.
Extended Data Fig. 10. rIL-3 delivery to the cortex or periphery of 5xFAD mice and summary figure.
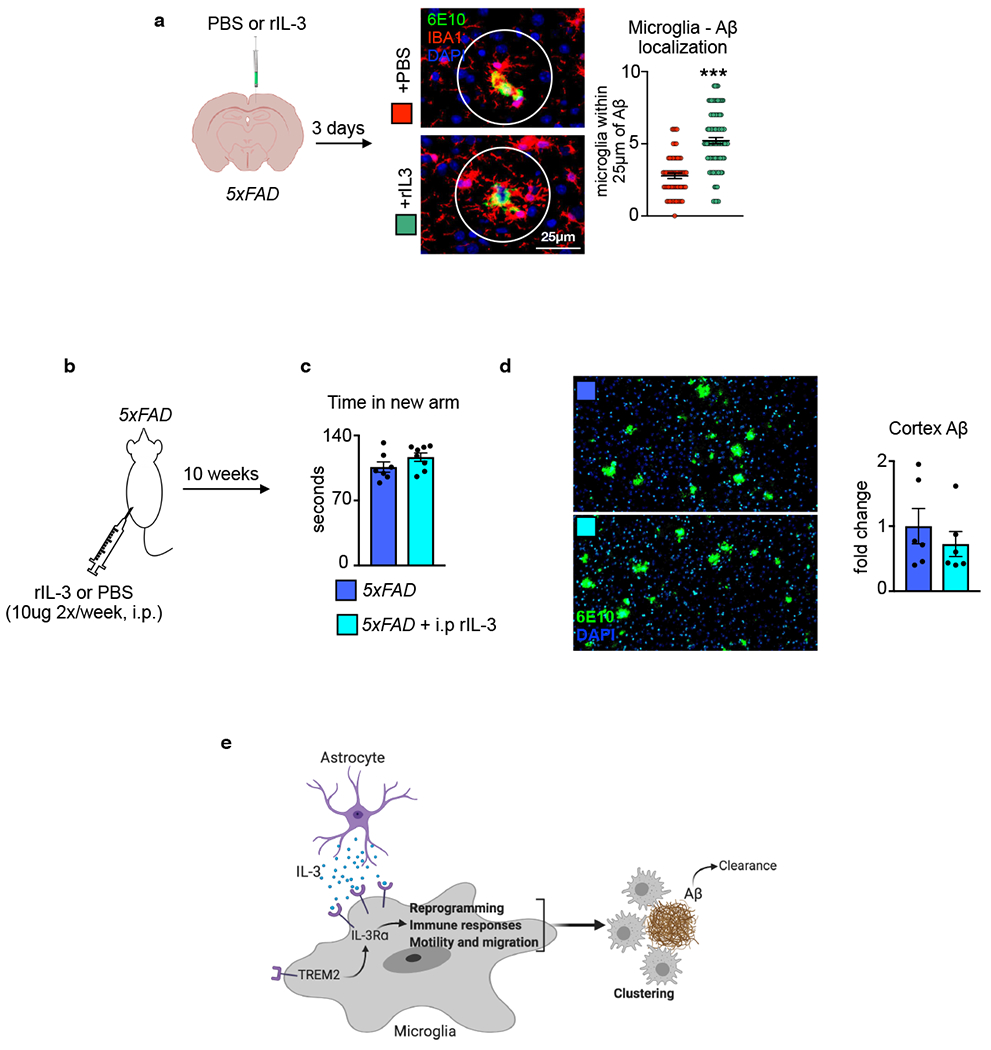
a. Recombinant IL-3 or PBS was delivered into the cortex of 5xFAD mice. Three days later microglia localization to Aβ aggregates was assessed (n=6-7). b. Scheme of recombinant IL3 delivery intraperitoneally twice a week for 10 weeks to 5xFAD mice. c. Prior to sacrifice Ymaze behavioral testing was performed and time in the new arm was quantified (n=7-8). d. The amount of Aβ in the cortex of mice was quantified by analyzing histological sections (n=6). Groups of mice are of evenly mixed sex. **p<0.01. Error bars indicate mean ± SEM. e. Model of IL-3’s role in AD. Astrocytes produce IL-3. In response to Aβ, TREM2 signaling increases microglia IL-3Rɑ, rendering microglia responsive to astrocyte-derived IL-3. IL-3 signaling instigates microglia transcriptional and functional reprogramming leading to a signature of immune regulation, motility, and migration. IL-3-dependent reprogramming promotes clustering of microglia around Aβ enabling Aβ clearance and mitigation of AD pathology.
Extended Data Table 1.
SpCas9 guide RNAs used to target Il3 and Il3rɑ.
| Gene targeted | Spacer Description | Spacer Sequence | PAM |
|---|---|---|---|
| Il3 | mIl3-intron1-1 | GTAACTGGCTGAGGTTGGCC | TGG |
| mIl3-STOP-1 | TGAATGTTCCTCATGGCCCA | TGG | |
| Il3rɑ | mIl3rɑ-1 | GGGACCAATGATGTCACCTA | GGG |
| mIl3rɑ-STOP-2 | AGACGCCTGAGAACTGTGTG | GGG |
Extended Data Table 2.
Primers used to evaluate genome editing efficiencies.
| Primer ID | Primer Sequence | Primer Description |
|---|---|---|
| oBK8657 | CTTGGAGGACCAGAACGAGACAATGG | fwd amplicon primer to sequence intron 1 targets for mouse Il3 |
| oBK8658 | GAAGCAAGGCATCGTGGAGTGATGG | reverse amplicon primer to sequence intron 1 targets for mouse Il3 |
| oBK8660 | GTTTAGCAGGCTGTGCCCTTGCCC | fwd amplicon primer to sequence stop codon targets for mouse Il3 |
| oBK8663 | GACAAATGAACATGGCCCCAGTCTTCC | reverse amplicon primer to sequence stop codon targets for mouse Il3 |
| oBK8664 | GATGATGTCATTCTCACCCCCAGATGTC | fwd amplicon primer to sequence intron 1 targets for mouse Il3ra |
| oBK8667 | TGCAGGTTCTGGATGGGCGTGGTC | reverse amplicon primer to sequence intron 1 targets for mouse Il3ra |
| oBK8668 | GGACAGGAAGTGACACTGGGGGTCAG | fwd amplicon primer to sequence stop codon targets for mouse Il3ra |
| oBK8671 | GCAATCCCTCTGTCTCAGCTCCTG | reverse amplicon primer to sequence stop codon targets for mouse Il3ra |
Extended Data Table 3.
Primers used to confirm insertion of donor DNA by Sanger sequencing.
| Primer ID | Primer Sequence | Primer Description |
|---|---|---|
| oKAC227 | CCCTAGTGTTTGCAGCCATATCTCC | fwd amplicon primer to sequence Outside of left homology arm for mouse Il3 |
| oKAC242 | CCAGGCCAACCATAACTTCGTATAATGTATG | rev amplicon primer overlapping left loxP site to sequence mouse Il3 |
| oKAC229 | CTGTACAGTCAGGGTCAAGTTTGTGC | fwd amplicon primer in left homology arm to sequence mouse Il3 |
| oKAC225 | GGCGGATCTTGAAGTTCACCTTGATG | rev amplicon primer in EGFP to sequence mouse Il3 |
| oKAC223 | GCTGACCCTGAAGTTCATCTGC | fwd amplicon primer in EGFP to sequence mouse Il3 |
| oKAC231 | GCTCAGATGATGGTGGTAGTGGATAG | rev amplicon primer outside of right homology arm to sequence mouse Il3 |
| oKAC233 | GGACCATGACAGGAACCAGAAGC | fwd amplicon primer to sequence outside of left homology arm for mouse |
| oKAC240 | GGCAAGTGACATGTCCCTATAACTTCGTATAATG | rev amplicon primer overlapping left loxP site to sequence mouse Il3ra |
| oBK8655 | CCCTAAGCTCTTCCCTTCTTGTTGGC | fwd amplicon primer in left homology arm to sequence mouse Il3ra |
| oBK8670 | CCTTCAGAGCCCCACTTCCTGTCGAAG | rev amplicon primer in right homology arm to sequence mouse Il3ra |
| oKAC224 | GACCACATGAAGCAGCACGACTTC | fwd amplicon primer in EGFP to sequence mouse Il3ra |
| oKAC237 | GTTACAACACCTAGAAGTAGTACCTCCTC | rev amplicon primer outside of right homology arm to sequence mouse Il3ra |
Extended Data Table 4. Missense mutations detected in CRISPR Cas9 edited mice.
Missense mutations do not influence EGFP signal in Il3 targeted mice but result in quenching of EGFP signaling in Il3rɑ targeted mice. IL-3Rɑ functionality is not impacted (Extended Data Fig. 3i).
| Mouse line | Element of donor in which missense mutation was detected | Missense mutations detected |
|---|---|---|
| Il3GFPfl/fl | Il3 cDNA | D70Y (GAT>TAT) |
| eGFP | E143D (GAG>GAT) | |
| Il3rɑfl/fl | Il3ra cDNA | W295L (TGG>TTG) |
| eGFP | G41C (GGC>TGC), E173Q (GAG>CAG) and A228S (GCC>TCC) |
Extended Data Table 5.
Primer sequences used for genotyping Il3GFPfl/fl and Il3rɑfl/fl mice.
| Mouse Line | Primer pair | Forward primer ID | Forward primer sequence | Reverse primer ID | Reverse primer sequence |
|---|---|---|---|---|---|
| Il3GFPfl/fl | 1 | oBK8660 | GTTTAGCAGGCTGTGCCCTTGCCC | oKAC230 | CGCCAAGCCTGAATGAAGTCCTAG |
| 2 | oKAC224 | GACCACATGAAGCAGCACGACTTC | oKAC230 | CGCCAAGCCTGAATGAAGTCCTAG | |
| Il3rɑfl/fl | 1 | oBK8668 | GGACAGGAAGTGACACTGGGGGTCAG | oKAC236 | CCAGAAGGAACCCGAGCTTCATC |
| 2 | oKAC224 | GACCACATGAAGCAGCACGACTTC | oKAC236 | CCAGAAGGAACCCGAGCTTCATC |
Extended Data Table 6.
| Characteristics | Controls (n=15) | AD (n=23) |
|---|---|---|
| Age at death (years) | 83.33±10.28 | 74±2.06 |
| Disease duration (min-max) | NA | 9.4 (5-12) |
| Males/Females (%) | 66.66/33.33 | 50/50 |
Extended Data Table 7.
| Characteristics | Controls (n=28) | AD (n=30) |
|---|---|---|
| Age at death (years) | 81.44±7.44 | 78.57±10.73 |
| Disease duration (min-max) | NA | 10.7 (5-21) |
| Males/Females (%) | 50/50 | 35.7/64.3 |
| APOEε4 carriers | 6 (3M/3F) | 23 (9M/14F) |
| APOEε4 homozygous carriers | 0 | 11 (6M/5F) |
Supplementary Material
Acknowledgements
We thank the HCI-CRM Flow Cytometry Core Facility at the Massachusetts General Hospital for assistance in cell sorting; the MGH DF/HCC Specialized Histopathology Services core and the Hope Babette Tang Histology Facility at the Massachusetts Institute of Technology for tissue sectioning and histology services; the MGH NexGen sequencing and Bioinformatics facility for RNAseq experiments and analysis; Lin Wu and the Harvard Genome Modification Facility for help generating mice; Greg Wojtkiewicz for help with imaging software; and Kaley Joyes for copy editing.
Funding
This work was funded by the Cure Alzheimer’s Fund, the National Institutes of Health (NIH) R35 HL135752, P01 HL131478, and the Patricia and Scott Eston MGH Research Scholar (to F.K.S.); NIH K99HL151750 and a Canadian Institutes of Health Research Banting Fellowship (to C.S.M.); NIH P01 HL142494 (to F.K.S., M.N., and B.P.K); NIH R35HL139598 (to M.N.); NIH Ruth L. Kirschstein National Research Service Award Individual Predoctoral Fellowship F31HL147364 (to J.E.M.); NIH R00 CA218870 (to B.P.K).
Footnotes
Competing interests
C.S.M., F.K.S., and R.E.T. are inventors on a patent application filed by Mass General Brigham that describes targeting IL-3 signaling in Alzheimer’s disease (invention record no. 2020-568). B.P.K. is an inventor on patent applications filed by Mass General Brigham that describe genome engineering technologies and methods, is an advisor to Acrigen Biosciences, and consults for Avectas Inc. and ElevateBio.
Supplementary Information is available for this paper
Data Availability
RNA sequencing data of microglia from Il3−/−5XFAD vs. 5XFAD mice has been deposited to NCBI-GEO: GSE163289. RNA sequencing data of WT vs. 5XFAD vs. Trem2−/− vs. Trem2−/−5XFAD has been previously described34 and was deposited to NCBI-GEO: GSE132508. scRNA sequencing data of homeostatic, DAM stage 1, and DAM stage 2 microglia has been previously described32 and was deposited to GEO: GSE98969.
References
- 1.Linnerbauer M, Wheeler MA & Quintana FJ Astrocyte Crosstalk in CNS Inflammation. Neuron 1–15 (2020) doi: 10.1016/j.neuron.2020.08.012. [DOI] [PMC free article] [PubMed] [Google Scholar]
- 2.Vainchtein ID & Molofsky AV Astrocytes and Microglia: In Sickness and in Health. Trends Neurosci. 43, 144–154 (2020). [DOI] [PMC free article] [PubMed] [Google Scholar]
- 3.Castellani G & Schwartz M Immunological Features of Non-neuronal Brain Cells: Implications for Alzheimer’s Disease Immunotherapy. Trends in Immunology (2020) doi: 10.1016/j.it.2020.07.005. [DOI] [PubMed] [Google Scholar]
- 4.Fakhoury M Microglia and astrocytes in Alzheimer’s disease: implications for therapy. Curr. Neuropharmacol (2017) doi: 10.2174/1570159x15666170720095240. [DOI] [PMC free article] [PubMed] [Google Scholar]
- 5.Long JM & Holtzman DM Alzheimer Disease: An Update on Pathobiology and Treatment Strategies. Cell (2019) doi: 10.1016/j.cell.2019.09.001. [DOI] [PMC free article] [PubMed] [Google Scholar]
- 6.Weber GF et al. Interleukin-3 amplifies acute inflammation and is a potential therapeutic target in sepsis. Science (80-. ). 347, 1260–1265 (2015). [DOI] [PMC free article] [PubMed] [Google Scholar]
- 7.Williams GT, Smith CA, Spooncer E, Dexter TM & Taylor DR Haemopoietic colony stimulating factors promote cell survival by suppressing apoptosis. Nature (1990) doi: 10.1038/343076a0. [DOI] [PubMed] [Google Scholar]
- 8.Murphy AJ et al. ApoE regulates hematopoietic stem cell proliferation, monocytosis, and monocyte accumulation in atherosclerotic lesions in mice. J. Clin. Invest 121, 4138–4149 (2011). [DOI] [PMC free article] [PubMed] [Google Scholar]
- 9.Robbins CS et al. Extramedullary hematopoiesis generates Ly-6C high monocytes that infiltrate atherosclerotic lesions. Circulation 125, 364–374 (2012). [DOI] [PMC free article] [PubMed] [Google Scholar]
- 10.Yvan-Charvet L et al. ATP-binding cassette transporters and HDL suppress hematopoietic stem cell proliferation. Science (80-. ). 328, 1689–1693 (2010). [DOI] [PMC free article] [PubMed] [Google Scholar]
- 11.Anzai A et al. Self-reactive CD4+ IL-3+ T cells amplify autoimmune inflammation in myocarditis by inciting monocyte chemotaxis. J. Exp. Med 216, 369–383 (2019). [DOI] [PMC free article] [PubMed] [Google Scholar]
- 12.Hofstetter HH et al. The cytokine signature of MOG-specific CD4 cells in the EAE of C57BL/6 mice. J. Neuroimmunol (2005) doi: 10.1016/j.jneuroim.2005.09.004. [DOI] [PubMed] [Google Scholar]
- 13.Renner K et al. IL-3 promotes the development of experimental autoimmune encephalitis. JCI Insight (2016) doi: 10.1172/jci.insight.87157. [DOI] [PMC free article] [PubMed] [Google Scholar]
- 14.Ravetti MG & Moscato P Identification of a 5-protein biomarker molecular signature for predicting Alzheimer’s disease. PLoS One (2008) doi: 10.1371/journal.pone.0003111. [DOI] [PMC free article] [PubMed] [Google Scholar]
- 15.Ray S et al. Classification and prediction of clinical Alzheimer’s diagnosis based on plasma signaling proteins. Nat. Med (2007) doi: 10.1038/nm1653. [DOI] [PubMed] [Google Scholar]
- 16.Britschgi M et al. Modeling of pathological traits in Alzheimer’s disease based on systemic extracellular signaling proteome. Mol. Cell. Proteomics 10, 1–11 (2011). [DOI] [PMC free article] [PubMed] [Google Scholar]
- 17.Soares HD et al. Plasma biomarkers associated with the apolipoprotein E genotype and alzheimer disease. Arch. Neurol 69, 1310–1317 (2012). [DOI] [PMC free article] [PubMed] [Google Scholar]
- 18.Huberman M et al. Correlation of cytokine secretion by mononuclear cells of Alzheimer patients and their disease stage. J. Neuroimmunol (1994) doi: 10.1016/0165-5728(94)90108-2. [DOI] [PubMed] [Google Scholar]
- 19.Kiddle SJ et al. Plasma Based Markers of [11C] PiB-PET Brain Amyloid Burden. PLoS One (2012) doi: 10.1371/journal.pone.0044260. [DOI] [PMC free article] [PubMed] [Google Scholar]
- 20.Frei K, Bodmer S, Schwerdel C & Fontana A Astrocytes of the brain synthesize interleukin 3-like factors. J. Immunol (1985). [PubMed] [Google Scholar]
- 21.Frei K, Bodmer S, Schwerdel C & Fontana A Astrocyte-derived interleukin 3 as a growth factor for microglia cells and peritoneal macrophages. J. Immunol (1986). [PubMed] [Google Scholar]
- 22.Zambrano A, Otth C, B. Maccioni R. & I. Concha I IL-3 Control Tau Modifications and Protects Cortical Neurons from Neurodegeneration. Curr. Alzheimer Res (2010) doi: 10.2174/156720510793499011. [DOI] [PubMed] [Google Scholar]
- 23.Zambrano A, Otth C, Mujica L, Concha II & Maccioni RB Interleukin-3 prevents neuronal death induced by amyloid peptide. BMC Neurosci. (2007) doi: 10.1186/1471-2202-8-82. [DOI] [PMC free article] [PubMed] [Google Scholar]
- 24.Herisson F et al. Direct vascular channels connect skull bone marrow and the brain surface enabling myeloid cell migration. Nat. Neurosci (2018) doi: 10.1038/s41593-018-0213-2. [DOI] [PMC free article] [PubMed] [Google Scholar]
- 25.Gate D et al. Clonally expanded CD8 T cells patrol the cerebrospinal fluid in Alzheimer’s disease. Nature (2020) doi: 10.1038/s41586-019-1895-7. [DOI] [PMC free article] [PubMed] [Google Scholar]
- 26.Zenaro E et al. Neutrophils promote Alzheimer’s disease-like pathology and cognitive decline via LFA-1 integrin. Nat. Med (2015) doi: 10.1038/nm.3913. [DOI] [PubMed] [Google Scholar]
- 27.Pasciuto E et al. Microglia Require CD4 T Cells to Complete the Fetal-to-Adult Transition. Cell 182, 625–640.e24 (2020). [DOI] [PMC free article] [PubMed] [Google Scholar]
- 28.Khakh BS & Deneen B The Emerging Nature of Astrocyte Diversity. Annual Review of Neuroscience (2019) doi: 10.1146/annurev-neuro-070918-050443. [DOI] [PubMed] [Google Scholar]
- 29.Liddelow SA et al. Neurotoxic reactive astrocytes are induced by activated microglia. Nature (2017) doi: 10.1038/nature21029. [DOI] [PMC free article] [PubMed] [Google Scholar]
- 30.Komuczki J et al. Fate-Mapping of GM-CSF Expression Identifies a Discrete Subset of Inflammation-Driving T Helper Cells Regulated by Cytokines IL-23 and IL-1β. Immunity (2019) doi: 10.1016/j.immuni.2019.04.006. [DOI] [PubMed] [Google Scholar]
- 31.Wheeler MA et al. Environmental Control of Astrocyte Pathogenic Activities in CNS Inflammation. Cell (2019) doi: 10.1016/j.cell.2018.12.012. [DOI] [PMC free article] [PubMed] [Google Scholar]
- 32.Keren-Shaul H et al. A Unique Microglia Type Associated with Restricting Development of Alzheimer’s Disease. Cell 169, 1276–1290.e17 (2017). [DOI] [PubMed] [Google Scholar]
- 33.Zhou Y et al. Human and mouse single-nucleus transcriptomics reveal TREM2-dependent and TREM2-independent cellular responses in Alzheimer’s disease. Nat. Med 26, 131–142 (2020). [DOI] [PMC free article] [PubMed] [Google Scholar]
- 34.Griciuc A et al. TREM2 Acts Downstream of CD33 in Modulating Microglial Pathology in Alzheimer’s Disease. Neuron 103, 820–835.e7 (2019). [DOI] [PMC free article] [PubMed] [Google Scholar]
- 35.Wang Y et al. TREM2-mediated early microglial response limits diffusion and toxicity of amyloid plaques. J. Exp. Med (2016) doi: 10.1084/jem.20151948. [DOI] [PMC free article] [PubMed] [Google Scholar]
- 36.Wang Y et al. TREM2 lipid sensing sustains the microglial response in an Alzheimer’s disease model. Cell 160, 1061–1071 (2015). [DOI] [PMC free article] [PubMed] [Google Scholar]
- 37.Parhizkar S et al. Loss of TREM2 function increases amyloid seeding but reduces plaque-associated ApoE. Nat. Neurosci (2019) doi: 10.1038/s41593-018-0296-9. [DOI] [PMC free article] [PubMed] [Google Scholar]
- 38.Jay TR et al. TREM2 deficiency eliminates TREM2+ inflammatory macrophages and ameliorates pathology in Alzheimer’s disease mouse models. J. Exp. Med (2015) doi: 10.1084/jem.20142322. [DOI] [PMC free article] [PubMed] [Google Scholar]
- 39.Wang Y et al. TREM2 lipid sensing sustains the microglial response in an Alzheimer’s disease model. Cell (2015) doi: 10.1016/j.cell.2015.01.049. [DOI] [PMC free article] [PubMed] [Google Scholar]
- 40.Jonsson T et al. Variant of TREM2 Associated with the Risk of Alzheimer’s Disease . N. Engl. J. Med (2013) doi: 10.1056/nejmoa1211103. [DOI] [PMC free article] [PubMed] [Google Scholar]
- 41.Ewers M et al. Increased soluble TREM2 in cerebrospinal fluid is associated with reduced cognitive and clinical decline in Alzheimer’s disease. Sci. Transl. Med (2019) doi: 10.1126/scitranslmed.aav6221. [DOI] [PMC free article] [PubMed] [Google Scholar]
- 42.Mathys H et al. Single-cell transcriptomic analysis of Alzheimer’s disease. Nature (2019) doi: 10.1038/s41586-019-1195-2. [DOI] [PMC free article] [PubMed] [Google Scholar]
- 43.Yamazaki Y, Zhao N, Caulfield TR, Liu CC & Bu G Apolipoprotein E and Alzheimer disease: pathobiology and targeting strategies. Nature Reviews Neurology (2019) doi: 10.1038/s41582-019-0228-7. [DOI] [PMC free article] [PubMed] [Google Scholar]
- 44.Lively S & Schlichter LC The microglial activation state regulates migration and roles of matrix-dissolving enzymes for invasion. J. Neuroinflammation (2013) doi: 10.1186/1742-2094-10-75. [DOI] [PMC free article] [PubMed] [Google Scholar]
- 45.Choi SH et al. A three-dimensional human neural cell culture model of Alzheimer’s disease. Nature 515, 274–278 (2014). [DOI] [PMC free article] [PubMed] [Google Scholar]
- 46.Park J et al. A 3D human triculture system modeling neurodegeneration and neuroinflammation in Alzheimer’s disease. Nat. Neurosci 21, 941–951 (2018). [DOI] [PMC free article] [PubMed] [Google Scholar]
- 47.Lee Y, Lee JW, Nam H, Yu SW & Yu SW Cx3cr1 CreERT2-driven Atg7 deletion in adult mice induces intestinal adhesion. Mol. Brain (2020) doi: 10.1186/s13041-020-00630-4. [DOI] [PMC free article] [PubMed] [Google Scholar]
- 48.Zhao XF et al. Targeting microglia using Cx3cr1-Cre lines: Revisiting the specificity. eNeuro (2019) doi: 10.1523/ENEURO.0114-19.2019. [DOI] [PMC free article] [PubMed] [Google Scholar]
- 49.Alzheimer’s Association. Alzheimer’s Association 2020 Facts and Figures Report. Alzheimer’s Assoc. 1 (2020). [Google Scholar]
- 1.Oakley H et al. Intraneuronal β-amyloid aggregates, neurodegeneration, and neuron loss in transgenic mice with five familial Alzheimer’s disease mutations: Potential factors in amyloid plaque formation. J. Neurosci (2006) doi: 10.1523/JNEURoSCI.1202-06.2006. [DOI] [PMC free article] [PubMed] [Google Scholar]
- 2.Anzai A et al. Self-reactive CD4+ IL-3+ T cells amplify autoimmune inflammation in myocarditis by inciting monocyte chemotaxis. J. Exp. Med 216, 369–383 (2019). [DOI] [PMC free article] [PubMed] [Google Scholar]
- 3.Weber GF et al. Interleukin-3 amplifies acute inflammation and is a potential therapeutic target in sepsis. Science (80-. ). 347, 1260–1265 (2015). [DOI] [PMC free article] [PubMed] [Google Scholar]
- 4.Turnbull IR et al. Cutting Edge: TREM-2 Attenuates Macrophage Activation. J. Immunol (2006) doi: 10.4049/jimmunol.177.6.3520. [DOI] [PubMed] [Google Scholar]
- 5.Doench JG et al. Optimized sgRNA design to maximize activity and minimize off-target effects of CRISPR-Cas9. Nat. Biotechnol (2016) doi: 10.1038/nbt.3437. [DOI] [PMC free article] [PubMed] [Google Scholar]
- 6.Bae S, Park J & Kim JS Cas-OFFinder: A fast and versatile algorithm that searches for potential off-target sites of Cas9 RNA-guided endonucleases. Bioinformatics (2014) doi: 10.1093/bioinformatics/btu048. [DOI] [PMC free article] [PubMed] [Google Scholar]
- 7.Hsiau T et al. Inference of CRISPR Edits from Sanger Trace Data. bioRxiv (2018) doi: 10.1101/251082. [DOI] [PubMed] [Google Scholar]
- 8.Kleinstiver BP et al. Engineered CRISPR–Cas12a variants with increased activities and improved targeting ranges for gene, epigenetic and base editing. Nat. Biotechnol (2019) doi: 10.1038/s41587-018-0011-0-0011-0. [DOI] [PMC free article] [PubMed] [Google Scholar]
- 9.Rohland N & Reich D Cost-effective, high-throughput DNA sequencing libraries for multiplexed target capture. Genome Res. (2012) doi: 10.1101/gr.128124.111. [DOI] [PMC free article] [PubMed] [Google Scholar]
- 10.Robbins CS et al. Local proliferation dominates lesional macrophage accumulation in atherosclerosis. Nat. Med (2013) doi: 10.1038/nm.3258. [DOI] [PMC free article] [PubMed] [Google Scholar]
- 11.DeVos SL & Miller TM Direct intraventricular delivery of drugs to the rodent central nervous system. J. Vis. Exp (2013) doi: 10.3791/50326. [DOI] [PMC free article] [PubMed] [Google Scholar]
- 12.Griciuc A et al. TREM2 Acts Downstream of CD33 in Modulating Microglial Pathology in Alzheimer’s Disease. Neuron 103, 820–835.e7 (2019). [DOI] [PMC free article] [PubMed] [Google Scholar]
- 13.Choi SH et al. A three-dimensional human neural cell culture model of Alzheimer’s disease. Nature 515, 274–278 (2014). [DOI] [PMC free article] [PubMed] [Google Scholar]
- 14.Park J et al. A 3D human triculture system modeling neurodegeneration and neuroinflammation in Alzheimer’s disease. Nat. Neurosci 21, 941–951 (2018). [DOI] [PMC free article] [PubMed] [Google Scholar]
- 15.McQuade A et al. Development and validation of a simplified method to generate human microglia from pluripotent stem cells. Mol. Neurodegener (2018) doi: 10.1186/s13024-018-0297-x. [DOI] [PMC free article] [PubMed] [Google Scholar]
- 16.Griciuc A et al. Alzheimer’s disease risk gene cd33 inhibits microglial uptake of amyloid beta. Neuron 78, 631–643 (2013). [DOI] [PMC free article] [PubMed] [Google Scholar]
- 17.Kraeuter AK, Guest PC & Sarnyai Z The Y-Maze for Assessment of Spatial Working and Reference Memory in Mice. in Methods in Molecular Biology (2019). doi: 10.1007/978-1-4939-8994-2_10. [DOI] [PubMed] [Google Scholar]
- 18.Vorhees CV & Williams MT Morris water maze: Procedures for assessing spatial and related forms of learning and memory. Nat. Protoc (2006) doi: 10.1038/nprot.2006.116. [DOI] [PMC free article] [PubMed] [Google Scholar]
Associated Data
This section collects any data citations, data availability statements, or supplementary materials included in this article.
Supplementary Materials
Data Availability Statement
RNA sequencing data of microglia from Il3−/−5XFAD vs. 5XFAD mice has been deposited to NCBI-GEO: GSE163289. RNA sequencing data of WT vs. 5XFAD vs. Trem2−/− vs. Trem2−/−5XFAD has been previously described34 and was deposited to NCBI-GEO: GSE132508. scRNA sequencing data of homeostatic, DAM stage 1, and DAM stage 2 microglia has been previously described32 and was deposited to GEO: GSE98969.