

Abstract
The tricarboxylic acid (TCA) cycle is a central hub of cellular metabolism, oxidizing nutrients to generate reducing equivalents for energy production and critical metabolites for biosynthetic reactions. Despite the importance of TCA cycle products for cell viability and proliferation, mammalian cells display diversity in TCA cycle activity1,2. How this diversity is achieved, and whether it is critical for establishing cell fate, remains poorly understood. Here we identify a non-canonical TCA cycle required for changes in cell state. Genetic co-essentiality mapping revealed a cluster of genes sufficient to compose a biochemical alternative to the canonical TCA cycle, wherein mitochondrially-derived citrate exported to the cytoplasm is metabolized via ATP citrate lyase (ACL), ultimately regenerating mitochondrial oxaloacetate to complete this non-canonical TCA cycle. Manipulating expression of ACL or the canonical TCA cycle enzyme aconitase 2 in mouse myoblasts and embryonic stem cells (ESCs) revealed that changes in TCA cycle configuration accompany cell fate transitions. During exit from pluripotency, ESCs switch from canonical to non-canonical TCA cycle metabolism; accordingly, blocking the non-canonical TCA cycle prevents cells from exiting pluripotency. These results establish a context-dependent alternative to the traditional TCA cycle and reveal that appropriate TCA cycle engagement is required for changes in cell state.
Mammalian cells exploit diverse strategies to meet their metabolic demands. In particular, heterogeneous TCA cycle substrate preferences and enzyme activities suggest that cells selectively engage components of the TCA cycle2,3. We therefore asked whether enzymes involved in the TCA cycle form discrete functional modules by analyzing gene essentiality scores generated from genome-wide CRISPR screens by the DepMap project4, as genes participating in the same pathway exhibit similar patterns of essentiality5. Genes involved in core metabolic pathways were clustered based on pairwise correlation of gene essentiality scores. Of the clusters that emerged, one contained genes involved in glycolysis and one contained genes required for one-carbon metabolism, consistent with the notion that these genes comprise distinct functional modules (Extended Data Fig. 1).
Two modes of TCA cycle metabolism
In contrast, TCA cycle-associated genes separated into two distinct clusters, even following unbiased analysis of top co-dependencies of all TCA cycle genes (Extended Data Fig. 1, 2a). Two-dimensional mapping of correlation distance demonstrated that these clusters were linked by shared co-dependency for Dld, a subunit required for both the pyruvate and oxoglutarate dehydrogenase complexes (Fig. 1a). Mapping genes in each cluster onto the canonical TCA cycle pathway underscored a clear division of the TCA cycle into two segments upstream and downstream of citrate (Fig. 1b), raising the question of how cells sustain citrate production if oxidative production of oxaloacetate via the TCA cycle is not tightly linked to citrate synthesis. Suggestively, enzymes involved in cytosolic citrate metabolism, including the mitochondrial citrate/malate antiporter (Slc25a1) and ATP citrate lyase (Acly) correlated with enzymes involved in citrate production (Fig. 1a, b). Catabolism of mitochondrially-derived citrate via ACL provides the cytoplasmic acetyl-CoA required for protein acetylation and lipid biosynthesis6,7. The co-dependency of ACL with TCA cycle enzymes suggests that ACL may also support cellular metabolic demands by forming a non-canonical TCA cycle capable of continuous oxaloacetate regeneration for citrate production.
Fig. 1: Genetic co-essentiality mapping of metabolic enzymes reveals two TCA cycle modules.

a, Two-dimensional network diagram representing gene essentiality score correlations between genes from indicated pathways (GO terms: TCA cycle, canonical glycolysis, one-carbon metabolic process and fatty-acyl-CoA metabolic process). Correlation strength is depicted by the length and thickness of the connecting edge. b, Schematic representing two TCA cycle modules that emerge from gene clustering in a. Left, cluster 2 genes annotated on the traditional TCA cycle in bold. Right, cluster 1 genes annotated on a ‘non-canonical’ TCA cycle in which citrate is exported to the cytoplasm and cleaved by ACL to liberate acetyl-CoA and regenerate oxaloacetate, which can yield malate for mitochondrial import and oxaloacetate regeneration. Genes are colored according to their GO term or grey (no significant correlation). c, Schematic depicting possible fates for citrate containing 2 carbons derived from [U-13C]glucose. Top, m+2 labeled citrate metabolized by aconitase in the traditional TCA cycle generates m+2 labeled malate. Bottom, m+2 labeled citrate cleaved in the cytoplasm by ACL loses two heavy-labeled carbons, producing unlabeled four-carbon derivatives. d, Fractional m+2 enrichment of TCA cycle intermediates in 82 non-small cell lung cancer (NSCLC) cell lines cultured with [U-13C]glucose for 6 h. Data mined from Chen et al., 2019. e, Fractional enrichment of glucose-derived malate m+2 relative to citrate m+2 (Mal+2/Cit+2) in NSCLC cell lines following incubation with vehicle or 50 μM BMS-303141 (ACLi) for 24 h. Data are mean ± SD, n = 3 independent replicates. Significance was assessed in comparison to citrate by one-way ANOVA (d) or vehicle-treated cells by two-way ANOVA (e) with Sidak’s multiple comparisons post-test.
TCA cycle metabolism can be monitored by tracing [U-13C]glucose, which generates m+2 labeled citrate following oxidative decarboxylation of glucose-derived pyruvate (Fig. 1c). Further metabolism by mitochondrial aconitase (ACO2) generates m+2 labeled TCA cycle intermediates, whereas metabolism by ACL liberates m+2 labeled acetyl-CoA, thereby generating unlabeled oxaloacetate and downstream derivatives. Thus, a drop in m+2 labeling of TCA cycle intermediates downstream of citrate can partly reflect the degree to which cells engage a non-canonical TCA cycle. Many cultured cells show a disconnect between m+2 labeling of citrate and downstream metabolites, as shown in 82 non-small cell lung cancer (NSCLC) lines8 (Fig. 1d). To determine whether loss of glucose label downstream of citrate is due in part to flux through ACL, we treated select NSCLC lines with an ACL inhibitor. ACL inhibition increased the proportion of malate containing two labeled carbons while having only a minor effect on the fraction of citrate m+2 (Extended Data Fig. 2b). Although glutamine anaplerosis will also contribute to a disconnect between fractional labeling of citrate and malate9, ACL inhibition did not uniformly affect glutamine anaplerosis, indicating that the effect of ACL on label loss downstream of citrate is not merely due to glutamine-derived label dilution (Extended Data Fig. 2c). Within an individual cell line, the degree to which malate is derived from the canonical TCA cycle can be represented as the ratio of malate m+2 relative to citrate m+2 (mal+2/cit+2). ACL inhibition increased the mal+2/cit+2 ratio in all cell lines, indicating that citrate metabolism via ACL contributes to loss of glucose labeling downstream of citrate (Fig. 1e).
As an orthogonal labeling strategy, human osteosarcoma cells expressing guinea pig asparaginase10 were incubated with [U-13C]asparagine to produce m+4 labeled citrate, which will lose labeled carbons when metabolized by the traditional TCA cycle (Extended Data Fig. 2d). Here, ACL inhibition significantly increased the ratio of cit+2/cit+4, reflecting citrate regeneration through the oxidative TCA cycle (Extended Data Fig. 2e, f). These results are consistent with the model that citrate metabolism via ACL represents a significant alternative to the canonical TCA cycle.
ESCs engage a non-canonical TCA cycle
To determine whether an ACL-mediated TCA cycle exists in non-transformed cells, we traced the fate of [U-13C]glucose in mouse embryonic stem cells (ESCs), which self-renew indefinitely when cultured with serum and leukemia inhibitory factor (LIF). Like cancer cells, ESCs exhibit reduced enrichment of malate m+2 relative to citrate that is mitigated by ACL inhibition (Extended Data Fig. 3a, b). To compare the effects of ACL inhibition with disruption of the canonical TCA cycle, we generated clonal ESC lines with genetic disruption of Acly or Aco2 (Extended Data Fig. 3c, d). Acly disruption had no consistent effect on m+2 enrichment in citrate but consistently increased m+2 enrichment in downstream TCA cycle metabolites, thereby elevating the mal+2/cit+2 ratio (Fig. 2a, b). Conversely, Aco2 disruption reduced m+2 enrichment of downstream TCA cycle metabolites and decreased the mal+2/cit+2 ratio (Extended Data Fig. 3e). Surprisingly, despite ACO2’s role as a canonical TCA cycle enzyme, Aco2 disruption minimally affected steady-state levels of TCA cycle metabolites (Extended Data Fig. 3f). In contrast, Acly mutation dramatically altered levels of TCA cycle metabolites associated with cytosolic citrate processing (citrate, malate, aspartate, and fumarate), but not canonical TCA cycle metabolism (succinate, α-ketoglutarate) (Fig. 2c).
Fig. 2: ACL loss disrupts TCA cycle metabolism in ESCs.

a, b, Fractional m+2 enrichment of citrate (Cit), fumarate (Fum), malate (Mal) and aspartate (Asp) (a) or malate m+2 relative to citrate m+2 (Mal+2/Cit+2) (b) in control (Ctrl) and Acly-edited (ACLY-1 and ACLY-2) mouse ESCs cultured in medium containing [U-13C]glucose. c, Steady-state levels of TCA cycle metabolites in Acly-edited mouse ESCs. Levels are represented as the fold change (expressed in log2) relative to control cells. d, Schematic depicting deuterium label transfer from [4-2H]glucose first onto NADH during glycolysis and subsequently onto either malate or lactate in the cytoplasm through MDH1 or LDH activity, respectively. Following mitochondrial import, deuterium-labeled malate can be converted to fumarate. The symmetry of fumarate allows the deuterium label to be scrambled, enabling generation of deuterium-labeled citrate. e, f, Fractional m+1 enrichment of malate (e) or citrate (f) in control and Acly-edited ESCs cultured in medium containing [4-2H]glucose. g, h, Mal+2/Cit+2 derived from [U-13C]glucose in control and Slc25a1-edited (g) or Mdh1-edited (h) ESCs. Data are mean ± SD, n = 3 independent replicates. Significance was assessed using two-way ANOVA (a) or one-way ANOVA (b, e-h) with Sidak’s multiple comparisons post-test relative to controls.
To test the hypothesis that a portion of the TCA cycle flows through ACL, we directly tested whether ACL mediates citrate recycling. Cytosolic processing of citrate to malate requires hydride donation from NADH, which can be traced by culturing cells with [4-2H]glucose to label up to half of cytosolic NADH pools11 (Fig. 2d). Acly mutation did not affect NADH labeling from [4-2H]glucose: both control and edited cells exhibit similar fractional enrichment of NADH and lactate, which becomes labeled when lactate dehydrogenase reduces cytosolic pyruvate (Extended Data Fig. 3g, h). Acly-edited clones did, however, display significantly lower m+1 enrichment of malate, indicating that wild-type cells generate a portion of malate by reducing ACL-derived cytosolic oxaloacetate (Fig. 2e). Critically, Acly mutation more than halved the fraction of labeled citrate, suggesting that cytosolic malate is indeed recycled back into the mitochondria for citrate regeneration, and that this process is impaired in the absence of ACL (Fig. 2f, Extended Data Fig. 3i–k). Consistent with impaired transfer of cytosolic reducing equivalents to the mitochondria, Acly mutation increased the cytosolic NADH/NAD+ ratio, measured as the ratio of lactate/pyruvate12, and decreased mitochondrial oxygen consumption, (Extended Data Fig. 3l, m).
To further test whether SLC25A1, ACL and MDH1 form a non-canonical TCA cycle, we generated clonal ESC lines deficient for SLC25A1 and MDH1 (Extended Data Fig. 4a, b). Deuterated glucose tracing revealed that, like ACL, both SLC25A1 and MDH1 were required for citrate regeneration from cytosolic oxaloacetate (Extended Data Fig. 4c, d). Accordingly, Slc25a1- and Mdh1-edited cells exhibited [U-13C]glucose labeling patterns consistent with reduced non-canonical TCA cycle activity, including increased enrichment of m+2 isotopologues in TCA cycle metabolites downstream of citrate and an elevated mal+2/cit+2 ratio (Fig. 2g, h, Extended Data Fig. 4e, f). Furthermore, Slc25a1 and Mdh1 mutation, like Acly mutation, reduced malate and fumarate pools (Extended Data Fig. 4g). SLC25A1 loss also reduced aspartate pools, but MDH1 loss did not, consistent with its role in the malate-aspartate shuttle that consumes cytosolic aspartate13. These data demonstrate that SLC25A1, ACL and MDH1 coordinate a cross-compartment cycle of citrate metabolism.
TCA cycle choice is cell-state dependent
As Krebs originally elucidated the canonical TCA cycle in pigeon breast muscle14, we assessed TCA cycle choice in C2C12 myoblasts and differentiated myotubes. Compared to myoblasts, myotubes exhibited increased incorporation of glucose-derived carbons into TCA cycle intermediates and a mal+2/cit+2 ratio over five-fold higher than proliferating myoblasts (Fig. 3a, Extended Data Fig. 5a, b). Consistent with switching from the non-canonical to canonical TCA cycle, [4-2H]glucose tracing revealed diminished production of malate, fumarate and citrate from cytosolic oxaloacetate in myotubes compared with myoblasts (Extended Data Fig. 5c). To further assess TCA cycle engagement, we engineered cells to express doxycycline-inducible hairpins targeting Acly or Aco2 (Extended Data Fig. 5d). ACL inhibition significantly increased the mal+2/cit+2 ratio in myoblasts, but not myotubes (Extended Data Fig. 5e–h). Conversely, while ACO2 inhibition decreased the mal+2/cit+2 ratio in myoblasts, this effect was larger in myotubes, consistent with canonical TCA cycle engagement following differentiation (Extended Data Fig. 5e–h). As in ESCs, ACL inhibition significantly increased citrate pools and decreased levels of fumarate, malate and aspartate, and this effect was stronger in myoblasts than in myotubes (Fig. 3b). In contrast, ACO2 inhibition had little effect on levels of TCA cycle metabolites in myoblasts and surprisingly tended to increase metabolite levels in myotubes, indicating that ACO2 loss causes greater metabolic disruption in myotubes relative to myoblasts (Fig. 3b). Collectively, these results indicate that the degree to which cells employ the canonical TCA cycle is at least partially determined by cell state.
Fig. 3: Engagement of the non-canonical TCA cycle is cell-state dependent.

a, Fractional enrichment of malate m+2 relative to citrate m+2 (Mal+2/Cit+2) derived from [U-13C]glucose in proliferating and confluent myoblasts and myotubes differentiated for 3, 5 or 7 days. b, Measurement of steady-state levels of citrate (Cit), fumarate (Fum), malate (Mal) and aspartate (Asp), expressed as the log2 fold change relative to shRenilla, in myoblasts (top) and myotubes (bottom). Myoblasts and myotubes expressing doxycycline-inducible shRNAs targeting Acly (shAcly-1 and shAcly-2), Aco2 (shAco2–1 and shAco2–2) or Renilla luciferase (shRen, used as a control) were cultured on doxycycline for two or four days, respectively, to induce shRNA expression. c, RNA-seq of TCA cycle-associated genes in myoblasts and myotubes differentiated for 5 days. Levels are represented as the log2 fold change relative to the row mean. n = 3 independently derived samples. d, e, Fractional m+2 enrichment (d) or the Mal+2/Cit+2 ratio (e) derived from [U-13C]glucose in myoblasts following treatment with vehicle (Ctrl), 5 mM dichloroacetic acid (DCA) or 10 μM UK-5099 (MPCi) for 24 h. Data are mean ± SD, n = 3 independent replicates. Significance was assessed in comparison to proliferating myoblasts (a) or vehicle treatment (d, e) by one-way ANOVA (a, e) or two-way ANOVA (d) with Sidak’s multiple comparisons post-test.
To identify potential drivers of TCA cycle choice, we compared gene expression with TCA cycle activity in NSCLC lines. TCA cycle genes were highly enriched among genes positively correlated with the mal+2/cit+2 ratio (Extended Data Fig. 6a). Similarly, myogenic differentiation significantly induced most TCA cycle genes, many of which are targets of the myogenic transcription factor MYOD15 (Fig. 3c). As all subunits of the pyruvate dehydrogenase complex (PDHC) that initiates carbon entry into the TCA cycle were upregulated upon myogenic differentiation, we tested whether modulating pyruvate entry into the TCA cycle affected TCA cycle choice. Both myoblasts and ESCs treated with dichloroacetate to potentiate PDHC activity16 increased incorporation of glucose-derived carbons not only into citrate but also into downstream metabolites, thereby elevating the mal+2/cit+2 ratio consistent with enhanced canonical TCA cycle activity (Fig. 3d, e, Extended Data Fig. 6b, c). Reciprocally, pharmacological inhibition of the mitochondrial pyruvate carrier reduced incorporation of glucose-derived carbons into TCA cycle metabolites and repressed the mal+2/cit+2 ratio (Fig, 3d, e, Extended Data Fig. 6b, c). Thus, TCA cycle choice is partly determined by the amount of pyruvate captured for oxidation by PDHC.
TCA cycle switch upon pluripotency exit
We next asked whether changes in TCA cycle configuration are required for changes in cell state. ESCs cultured with LIF and inhibitors against GSK3β and MEK (2i) represent the naïve ground state of pluripotency reminiscent of the pre-implantation epiblast; withdrawal of these factors (−2i/LIF) allows cells to exit the naïve pluripotent state and gain differentiation competence (Extended Data Fig. 7a–c)17. Loss of naïve pluripotency triggers major changes in TCA cycle dynamics: cells induced to exit naïve pluripotency decrease incorporation of glucose-derived carbon while increasing incorporation of glutamine-derived carbon (Extended Data Fig. 7d–e), consistent with our previous report demonstrating enhanced glutamine dependence in more committed ESCs18. The high mal+2/cit+2 ratio of naïve ESCs is progressively reduced during exit from naïve pluripotency alongside a concomitant increase in citrate production from cytosolic intermediates (Fig. 4a, b, Extended Data Fig. 7f). This metabolic shift was not due to changes in culture medium: ESCs cultured serum-free in 2i/LIF also repressed glucose utilization and decreased the mal+2/cit+2 ratio following 2i/LIF withdrawal despite continuous culture in the same medium formulation (Extended Data Fig. 7g–i). Furthermore, cells deficient for Tcf3/Tcf7l1, a repressor of the naïve pluripotency gene network19, exhibited dampened metabolic reprogramming corresponding to delayed exit from naïve pluripotency (Extended Data Fig. 7j–m).
Fig. 4: Exit from naïve pluripotency requires engagement of the non-canonical TCA cycle.
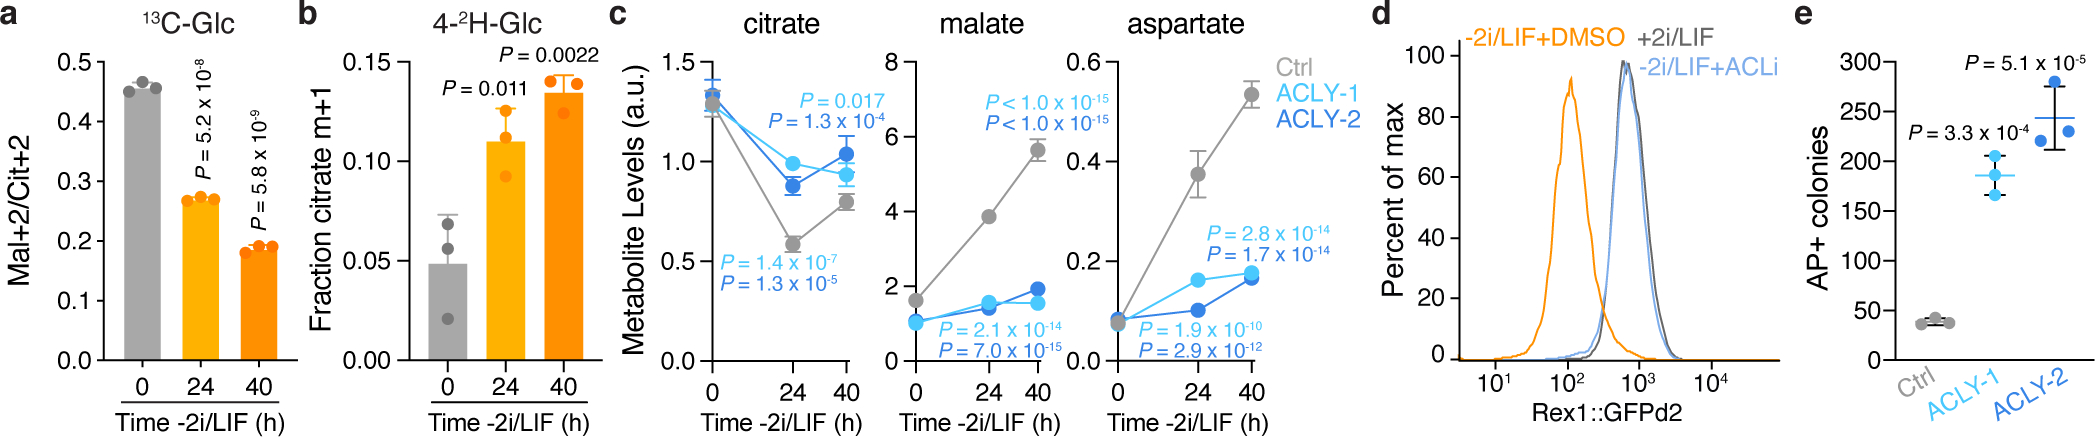
a, b, Fractional enrichment of malate m+2 relative to citrate m+2 (Mal+2/Cit+2) derived from [U-13C]glucose (a) or citrate m+1 derived from [4-2H]glucose (b) in ESCs subjected to 2i/LIF withdrawal for the indicated times. c, Steady-state levels of metabolites in control and Acly-edited ESCs grown −2i/LIF for the indicated times. d, Representative histogram of GFP intensity encoded by the Rex1::GFPd2 reporter in ESCs subjected to 2i/LIF withdrawal for 40 h in the presence of vehicle or 50 μM BMS-303141 (ACLi). Naïve ESCs (+2i/LIF) are included as a control. e, Quantification of alkaline phosphatase positive (AP+) colonies representing control and Acly-edited ESCs that failed to exit the naïve pluripotent state. 2i-adapted ESCs subjected to 2i/LIF withdrawal for 40 h were reseeded at clonal density into medium containing 2i/LIF. One histogram representative of 4 replicates with similar results shown in (d). All other panels depict data as mean ± SD, n = 3 independent replicates. Significance was assessed by two-way ANOVA with Sidak’s multiple comparisons post-test relative to control cells at each timepoint with P values colored according to comparison (c), or by one-way ANOVA in comparison to 0 h (a-b) or control cells (e) with Sidak’s multiple comparisons post-test.
Together, these results indicate that ESCs switch from canonical to non-canonical TCA cycle activity as they dismantle naïve pluripotency. Accordingly, metabolic rewiring during exit from pluripotency required ACL: Acly-edited clones maintained higher incorporation of glucose-derived carbons and lower incorporation of glutamine-derived carbons than their control counterparts grown −2i/LIF (Extended Data Fig. 8a, b). ACL loss did not affect the mal+2/cit+2 ratio or steady-state levels of TCA cycle metabolites in naïve ESCs but doubled the mal+2/cit+2 ratio and triggered up to 7-fold changes in TCA cycle metabolite levels in cells grown −2i/LIF (Extended Data Fig. 8c–f). Consequently, ACL was required for inducing large changes in TCA cycle metabolites and maintaining viability specifically upon exit from naïve pluripotency (Fig. 4c, Extended Data Fig. 8g). Impaired viability was not due simply to deficient cytosolic acetyl-CoA following ACL loss: exogenous acetate restored histone acetylation and supported de novo lipid synthesis—processes requiring cytosolic acetyl-CoA7—but minimally rescued viability (Extended Data Fig. 8h–k). Thus, upon exit from naïve pluripotency, cells rely on the non-canonical TCA cycle to maintain TCA cycle intermediates and cell viability.
Exit from pluripotency requires ACL
We therefore tested whether exit from naïve pluripotency required ACL. Using ESCs harboring a reporter of naïve pluripotency (Rex1::GFPd2)20, we found that the expected reporter downregulation following 2i/LIF withdrawal17 was almost completely prevented by ACL inhibition (Fig. 4d, Extended Data Fig. 8l). Similarly, Acly-edited clones subjected to 2i/LIF withdrawal demonstrated increased expression of naïve pluripotency genes Nanog, Esrrb and Rex1, impaired induction of the differentiation marker Sox1, and enhanced ability to form alkaline phosphatase positive colonies when reseeded into medium containing 2i/LIF (Fig. 4e, Extended Data Fig. 8m, n). None of these phenotypes were reversed by exogenous acetate, which rather tended to increase colony formation (Extended Data Fig. 8o–q) consistent with reports that acetate promotes ESC self-renewal21. These results demonstrate that ACL loss selectively impairs metabolism and viability of cells during 2i/LIF withdrawal, independent of cytosolic acetyl-CoA.
Like ACL, neither SLC25A1 nor MDH1 was required for viability of naïve pluripotent ESCs (Extended Data Fig. 9a). Moreover, like ACL, SLC25A1 loss specifically impaired viability of cells −2i/LIF, but MDH1 loss did not (Extended Data Fig. 9b). Notably, while ACL, SLC25A1 and MDH1 were all required to sustain TCA cycle metabolites fumarate and malate during exit from naïve pluripotency, only SLC25A1 and ACL were required to maintain aspartate pools (Extended Data Fig. 9c). Aspartate, which contributes to protein and nucleotide biosynthesis, is a critical output of the TCA cycle in proliferating cells13,22. Consistently, when induced to exit naïve pluripotency, both Acly- and Slc25a1-edited cells, but not Mdh1-edited cells, had impaired protein synthesis and reduced proliferation (Extended Data Fig. 9d–g). Accordingly, while Acly- and Slc25a1-edited cells preserved naïve pluripotency gene signatures, this effect was blunted in Mdh1-edited cells (Extended Data Fig. 9h, i). Together, these results demonstrate that SLC25A1, ACL and MDH1 establish metabolic identity as cells exit the naïve pluripotent state, and cells unable to activate ACL-dependent non-canonical TCA cycle metabolism exhibit compromised viability.
To further test the model that appropriate TCA cycle engagement enables establishment of cell identity, we tested whether efficient induction of the naïve, ground state of pluripotency required canonical TCA cycle metabolism. Aco2 disruption did not affect proliferation in serum/LIF-cultured ESCs, which exhibit non-canonical TCA cycle activity (Extended Data Fig. 10a). Supplementing 2i to initiate conversion to naïve pluripotency slowed proliferation of Aco2-edited clones and delayed induction of naïve pluripotency markers (Extended Data Fig. 10b, c). Collectively, these results underscore the role of TCA cycle configuration in facilitating cell state transitions.
Discussion
Here, we identify a non-canonical TCA cycle active in both normal and transformed cells. The possibility of a similar citrate-malate shuttle has been proposed but never demonstrated6,23,24. By combining isotope tracing with genetic manipulation of ACL, SLC25A1 and MDH1, we provide direct evidence that the proposed citrate-malate shuttle indeed represents a bona fide cycle with differential activity across mammalian cell states. Potential advantages to non-canonical TCA cycle engagement include retaining, rather than combusting, reduced carbon and regenerating cytosolic NAD+ required to sustain glycolysis. By circumventing several steps of the mitochondrial TCA cycle, the non-canonical TCA cycle maintains oxaloacetate regeneration while minimizing mitochondrial NADH production, which may restrain cell proliferation25. Notably, in contrast to their in vitro counterparts, cancer cells growing in vivo exhibit little loss of glucose label between citrate and malate26,27, suggesting that differential TCA cycle engagement contributes to the discrepancy between in vitro and in vivo metabolic phenotypes. Consistently, pancreatic cancer cells are more reliant on Acly in vitro and more dependent upon Aco2 in vivo28. Collectively, these studies underscore the diversity of metabolic strategies that support cellular bioenergetics and reveal that TCA cycle behavior is dynamic and entwined with cell state.
Methods:
Metabolic co-essentiality analysis and network modeling.
To obtain metabolic gene essentiality scores, we analyzed CERES gene dependency values from the DepMap Portal Project Achilles29,30 20Q2 release in which 18,119 genes were perturbed by genome-wide loss of function CRISPR screens in 769 human cancer cell lines. We utilized two gene lists to perform our analysis. To focus on an unbiased set of metabolic genes corresponding to well-defined metabolic pathways, we created a gene set of 122 genes derived from four gene ontology (GO) terms31,32: tricarboxylic acid cycle (GO:0006099), canonical glycolysis (GO:0061621), 1-carbon metabolic process (GO:0006730) and fatty-acyl-CoA metabolic process (GO:0035337). To focus more specifically on the TCA cycle, we used a list of 27 core TCA cycle genes and then identified the top 10 correlates of these genes using Pearson correlation coefficients from DepMap gene essentiality scores above a minimum threshold (r > 0.25). Next, we identified the top 5 correlates of this expanded list again above a minimum threshold (r > 0.25), resulting in a list of 115 TCA-cycle associated genes.
To examine genetic co-dependency in these gene lists, Pearson correlation coefficients were calculated between metabolic gene essentiality scores across the 769 human cancer cell lines surveyed to generate a correlation matrix heatmap of codependent gene modules. To create the heatmap, the correlations were hierarchically clustered with the UPGMA algorithm using the scipy.cluster.hierarchy.linkage function from the SciPy Python package33, with the method argument set to ‘average’. The heatmap was graphed using the Seaborn Python package (https://seaborn.pydata.org/citing.html). To visualize codependent gene modules as a network diagram, we utilized the Python package NetworkX (http://networkx.org). Genes with no correlation partners or with low correlation scores (r < 0.25) were filtered out, and spring model layouts were generated using the method ‘neato’ from the Python package PyGraphviz (http://pygraphviz.github.io). Graph edges were weighted according to the strength of pairwise gene correlations and the final network diagram was created using the NetworkX draw function. Gene clusters with less than 3 members were removed.
Gene expression correlation.
NSCLC cell line isotope tracing data was obtained from Chen et al., 2019 (ref8). Gene expression data was obtained from the DepMap Cancer Cell Line Encyclopedia34. For the 68 cell lines present in both datasets, expression of each gene was correlated with the fractional enrichment of malate m+2 relative to citrate m+2 (Mal+2/Cit+2) derived from [U-13C]glucose. Genes were ranked by correlation with Mal+2/Cit+2, and gene set enrichment analysis35 of the gene set KEGG citric acid (TCA) cycle-associated genes (KEGG_CITRATE_CYCLE_TCA_CYCLE; M3985) was performed using GSEAPreranked version 4 with default parameters. Data were exported and graphed in GraphPad Prism version 9.
Cell culture.
Mouse embryonic stem cells (ESCs) were previously generated from C57BL/6 × 129S4/SvJae F1 male embryos36. Rex1::GFPd2 ESCs20 were a kind gift from Austin Smith, University of Exeter, United Kingdom. All other cell lines were obtained from ATCC. ESCs were maintained on gelatin-coated plates in the following media: serum/LIF, serum/LIF+2i, or 2i/LIF. Serum/LIF medium contained knockout DMEM (catalog no. 10829018; Thermo Fisher Scientific) supplemented with 10% fetal bovine serum (FBS; Gemini), 0.1 mM 2-mercaptoethanol, 2 mM L-glutamine and 1,000 U mL−1 LIF (Gemini). To generate serum/LIF+2i maintenance medium, serum/LIF medium was supplemented with 3 μM CHIR99021 (Stemgent) and 1 μM PD0325901 (Stemgent) (2i). 2i/LIF medium contained a 1:1 mix of DMEM/F-12 (catalog no. 11320033; Gibco) and Neurobasal medium (catalog no. 21103049; Gibco) including N-2 supplement (catalog no. 17502048; Gibo), B-27 supplement (catalog no. 17504044; Gibco), 2-mercaptoethanol, 2 mM L-glutamine, LIF and 2i. To generate ESCs in the naïve ground state of pluripotency, serum/LIF-cultured ESCs were adapted for 3 passages to serum/LIF+2i medium or 2i/LIF medium. Adapted cells were used for a maximum of 9 passages.
For exit from naïve pluripotency, serum/LIF+2i-cultured ESC were seeded at least 24 h prior to washing with PBS and changing into medium containing a 1:1 mix of glutamine-free DMEM (catalog no. 11960051; Gibco) and Neurobasal medium including N-2 supplement, B-27 supplement, 2-mercaptoethanol and 2 mM L-glutamine at the indicated time before harvest (24 or 40 h). 2i/LIF-cultured ESCs were seeded at least 24 h prior to being washed with PBS and changed into serum-free maintenance medium without 2i or LIF at the indicated time before harvest (12, 24 or 40 h). Unless otherwise noted, cells were adapted to serum/LIF+2i culture prior to exit from naïve pluripotency.
C2C12 cells were maintained at sub-confluence as myoblasts unless otherwise noted. All myoblast experiments were performed in high glucose DMEM supplemented with 10% FBS and 4 mM L-glutamine. For differentiation into myotubes, C2C12 cells were grown to 100% confluence for three days and then washed with PBS and changed into differentiation medium composed of high glucose DMEM supplemented with 2% horse serum (catalog no. 26050070; Gibco), 4 mM L-glutamine and 100X insulin-transferrin-selenium-ethanolamine (ITS-X; catalog no. 51500056; Gibco) for the indicated length of time (3, 5 or 7 days). Differentiation medium was refreshed every day. For non-small cell lung cancer (NSCLC) cell line studies, H2170, A549, and Calu-1 cell lines were thawed and passaged in RPMI-1640 supplemented with 10% FBS before being transitioned to high glucose DMEM supplemented with 10% FBS and 4mM L-glutamine for several passages prior to experiments. 143B cells were maintained in high glucose DMEM supplemented with sodium pyruvate, 10% FBS and penicillin-streptomycin. Cell lines treated with inhibitors were cultured as described above but medium was supplemented with DMSO, 50 μM BMS-303141 (catalog no. SML0784; Sigma), 5 mM dichloroacetate (catalog no. 3447795; Sigma) or 10 μM UK-5099 (catalog no. 4186; Tocris) for 24 h prior to harvest or for the duration of the exit from pluripotency. All cells routinely tested negative for Mycoplasma.
Generation of clonal ESC lines.
Single guide (sg)RNA sequences targeting Acly, Aco2, Slc25a1, Mdh1 or a control, non-genic region on mouse chromosome 8 (chr8)37 were cloned into the pSpCas9(BB)-2A-GFP plasmid (PX458, Addgene plasmid number 48138), as previously described38. See Supplementary Table 2 for sgRNA sequences. ESCs (4 × 10⁵ per condition) were electroporated using a 4D-Nucleofector (Amaxa, Lonza) with 5 μg PX458 plasmid encoding Cas9, EGFP and sgRNA sequences. After electroporation, cells were plated onto a layer of mitotically inactivated feeder mouse embryonic fibroblasts (MEFs). After 48 h, cells were dissociated with Accutase (Invitrogen) and sorted using the BD FACSAria III sorter (BD Biosciences) to enrich for GFP-positive cells. Approximately 10,000 fluorescence-activated cell sorting (FACS)-sorted GFP-positive cells per experimental condition were immediately reseeded onto 10 cm plates (on feeder MEFs) to enable clonal growth. After 7 days, individual clones were picked and expanded (initially on feeder MEFs then on gelatin-coated tissue culture plates) and loss of target gene expression was validated by immunoblot (see below).
Generation of Tcf7l1-edited ESC lines.
Cas9 cDNA from a lentiCas9-Blast plasmid (Addgene plasmid number 52962) was cloned into Piggybac (pCAGGS-IRES-Neo, a kind gift from H. Niwa, Institute of Molecular Embryology and Genetics, Kumamoto, Japan). ESCs were transfected with Piggybac plus transposase (pBase) at a 3:1 ratio using Fugene HD (catalog no. E2691; Promega). Following selection with G418 (300 μg/mL, catalog no. 10131–035; Gibco), cells were plated on feeder MEFs at single cell density to generate clonal Cas9+ ESC lines.
sgRNA sequences targeting Tcf7l1(ref39) or a non-genic region on mouse chromosome 8 (chr8) were cloned into the pUSEPB plasmid40 (kind gift from S. Lowe, Memorial Sloan Kettering Cancer Center, USA) as previously described38. See Supplementary Table 2 for gRNA sequences. Lentivirus was generated by the co-transfection of sgRNA vectors with the packaging plasmids psPAX2 and pMD2.G (Addgene) into 293T cells. Virus-containing supernatant was cleared of cellular debris by 0.45-μM filtration and was concentrated using Lenti-X (catalog no. 631231; Takara). Cas9-ESCs were exposed to concentrated viral supernatant with 6 μg/mL polybrene for 24 h before being washed, grown for 24 h in fresh medium, and subjected to antibiotic selection. Cells were expanded and loss of target gene expression was validated by immunoblot (see below).
sgRNA editing analysis.
For clonal ESC lines, genomic DNA was extracted (Qiagen) and amplification of edited regions was performed from 50 ng of genomic DNA using Platinum Taq DNA Polymerase (Invitrogen), per the manufacturer’s instructions. See Supplementary Table 3 for sequencing primers. Primers were optimized to produce an amplicon between 200 and 280 bp long and containing the edited locus within the first 100 bp (from either the 5’-end or 3’-end). PCR products were column purified (Qiagen) and detection of CRISPR variants from NGS reads (CRISPR sequencing) was performed by the CCIB DNA Core Facility at Massachusetts General Hospital (Cambridge, MA). Briefly, Illumina compatible adapters with unique barcodes were ligated onto each sample during library construction. Libraries were pooled in equimolar concentrations for multiplexed sequencing on the Illumina MiSeq platform with 2×150 run parameters. Upon completion of the NGS run, data were demultiplexed and subsequently entered into an automated de novo assembly pipeline, UltraCycler v1.0 (Brian Seed and Huajun Wang, unpublished). Sequenced amplicons produced for each clonal ESC line are listed and annotated in Supplementary Table 3.
Lentiviral production and infection.
Renilla Luciferase-, Acly- and Aco2-targeting shRNAs were introduced into C2C12 cells to enable doxycycline-inducible expression using lentiviral LT3GEPIR41 (see Supplementary Table 2 for shRNA sequences). Lentivirus was generated by the co-transfection of shRNA-expressing viral vectors with the packaging plasmids psPAX2 and pMD2.G (Addgene) into 293T cells. Virus-containing supernatants were cleared of cellular debris by 0.45-μm filtration and mixed with 8 μg/mL polybrene. C2C12 cells were exposed to viral supernatants for two 24 h periods before being passaged and grown for 24 h in fresh medium and then subjected to antibiotic selection with 1 μg/mL puromycin. Cells were maintained under antibiotic selection until all cells on an uninfected control well were eliminated.
Viability assays.
Serum/LIF+2i-adapted ESCs were seeded at a density of 24,000 cells per well of a 24-well plate in triplicate or quadruplicate. 24 h later, cells were washed with PBS and changed into either fresh serum/LIF+2i medium or medium containing a 1:1 mix of glutamine-free DMEM and Neurobasal medium including N-2 supplement, B-27 supplement, 2-mercaptoethanol and 2 mM L-glutamine for 40 h. Cells were evaluated for propidium iodide (PI) on an LSRFortessa flow cytometer using FACSDiva software v8.0 (BD Biosciences). Analysis of PI exclusion was performed with FCS Express v.7.05 or FlowJo v10.8.0.
Growth curves.
ESCs were seeded at a density of 40,000 cells per well of a 12-well plate. The following day, three wells of each line were counted to determine starting cell number. The remaining cells were washed with PBS and changed to either media containing serum/LIF+2i or induced to exit from naïve pluripotency as indicated above. Cells were counted 40 h later using a Beckman Coulter Multisizer 4e with a cell volume gate of 400–10,000 fl. Cell counts were normalized to starting cell number. All curves were performed at least two independent times.
Naïve pluripotency conversion growth curve.
ESCs were seeded in standard culture medium (serum/LIF) in six-well plates; 48 h later, cells were counted to establish a baseline measurement of proliferation for each line under serum/LIF culturing conditions. Following this count, ESCs were seeded into serum/LIF+2i maintenance medium and passaged and counted every 48 h for 6 days (3 passages). Cumulative population doublings were assessed by summing population doublings measured at each passage. Cells were counted using a Beckman Coulter Multisizer 4e with a cell volume gate of 400–10,000 fl.
O-propargyl-puromycin (OP-puro) assay.
60 min prior to harvest, all cells were washed with PBS and changed into fresh medium. For cycloheximide control samples, 10 μg/mL cycloheximide was added to wells at this time. At 30 min prior to harvest, 20 μM O-propargyl-puromycin (OP-puro, catalog no. HY-15680; MedChemExpress) was added to cells. Cells were harvested and stained with fixable viability dye (catalog no. 65–0863-14; Thermo Fisher Scientific), followed by fixation with 4% PFA in PBS and permeabilization with 0.25% Triton-X-100. Fixed and permeabilized cells were stained using Click-iT Plus Alexa Fluor 647 Picolyl Azide Toolkit (catalog no. C10643; Thermo Fisher Scientific) and AZDye 647 Picoyl Azide (catalog no. 1300–1; Click Chemistry Tools) according to manufacturer’s instructions and analyzed on a LSRFortessa flow cytometer using FACSDiva software v8.0 (BD Biosciences). Analysis of OP-puro incorporation was performed with FCS Express v7.05 or FlowJo v10.8.0.
Rex1::GFPd2 analysis.
On the day of analysis, cells were trypsinized and resuspended in FACS buffer (PBS + 2% FBS + 1mM EDTA) containing 4,6-diamidino-2-phenylindole (DAPI, 1 μg/mL). Cells were evaluated for DAPI and GFP on an LSRFortessa flow cytometer using FACSDiva software v8.0 (BD Biosciences). Viable cells were those excluding DAPI. Rex1::GFPd2 expression was measured by GFP mean fluorescence intensity (MFI) and quantified using FCS Express v7.0.5 or FlowJo v10.8.0.
Metabolic analyses.
For isotope tracing experiments, ESCs were seeded in standard culture medium in six-well plates; 24 h or 40 h later, cells were washed with PBS and changed into experimental medium containing a 1:1 mix of glutamine-free DMEM and glutamine-free Neurobasal medium including 10% dialyzed FBS, 2-mercaptoethanol, LIF and 2 mM L-glutamine with or without 2i. The next day, cells were washed with PBS and changed into medium containing a 1:1 combination of glucose- and glutamine-free DMEM and glucose- and glutamine-free Neurobasal-A medium including 10% dialyzed FBS, 2-mercaptoethanol, LIF and 2i as specified and supplemented with [12C]glucose (Sigma-Aldrich) and [12C]glutamine (Gibco) or the labeled versions of each metabolite: [U-13C]glucose, [4-2H]glucose or [U-13C]glutamine (Cambridge Isotope Laboratories) to a final concentration of 20 mM (glucose) and 2 mM (glutamine) for 4 h prior to harvest. To analyze metabolites in serum/LIF+2i-cultured ESCs undergoing exit from pluripotency, ESCs were seeded in maintenance medium in six-well plates overnight. Either 24 or 40 h prior to harvest, cells were washed with PBS and changed into medium containing a 1:1 mix of glutamine-free DMEM and Neurobasal medium including N-2 supplement, B-27 supplement, 2-mercaptoethanol and 2 mM L-glutamine. To analyze metabolites in 2i/LIF-cultured ESCs undergoing exit from pluripotency, ESCs were seeded in serum-free maintenance medium in six-well plates overnight. Either 24 or 40 h prior to harvest, cells were washed with PBS and changed into serum-free maintenance medium without 2i or LIF. In all cases, 4 h prior to harvest, cells were washed with PBS and changed into medium containing a 1:1 combination of glucose- and glutamine-free DMEM and glucose- and glutamine-free Neurobasal-A medium including N-2 and B-27 supplements and 2-mercaptoethanol and supplemented with [12C]glucose and [12C]glutamine or the labeled versions of each metabolite to a final concentration of 20 mM (glucose) and 2 mM (glutamine).
For mass spectrometric analyses in C2C12 myoblasts and NSCLC cell lines, cells were seeded in six-well plates and medium was changed 24 h or 48 h later. The next day, cells were washed with PBS and changed into medium containing glucose- and glutamine-free DMEM including 10% dialyzed FBS and supplemented with [12C]glucose and [12C]glutamine or the labeled versions of each metabolite: [U-13C]glucose, [4-2H]glucose or [U-13C]glutamine (Cambridge Isotope Laboratories)to a final concentration of 20 mM (glucose) and 4 mM (glutamine) for 4 h prior to harvest. 48 h prior to harvest, myoblasts were supplemented with 1 μg/mL doxycycline to induce shRNA expression. For analysis of myotubes, cells seeded in six-well plates were grown to 100% confluence for 3 days, washed with PBS and changed to differentiation medium that was refreshed every day for 5 or 7 days. On the final day of differentiation, cells were washed with PBS and changed to experimental medium described above. For analysis of C2C12 myotube genetic hairpin lines, cells were processed as described above but medium was supplemented with 1 μg/mL doxycycline for the final four days of differentiation to induce shRNA expression. Cell lines treated with inhibitors were processed as described above but medium was supplemented with DMSO, 50 μM BMS-303141, 5 mM dichloroacetate or 10 μM UK-5099 for 24 h prior to harvest. At harvest, metabolites were extracted with 1 mL ice-cold 80% methanol containing 2 μM deuterated 2-hydroxyglutarate (d-2-hydroxyglutaric-2,3,3,4,4-d5 acid (d5–2HG)). After overnight incubation at −80 °C, lysates were collected and centrifuged at 21,000g for 20 min to remove protein. All extracts were further processed by LCMS (for analysis of the lactate/pyruvate ratio and deuterium labeling of NADH, lactate and succinate) or GCMS (for all other analyses) as described below.
143B cells were plated in six-well plates; 24 h later, media was changed to DMEM supplemented with 10% dialyzed FBS, 1 mM asparagine and DMSO or 50 μM BMS-303141. After 20 h, media was changed to DMEM supplemented with 10% dialyzed FBS, 1 mM [U-13C]asparagine and DMSO or 50 μM BMS-303141. Cells were extracted with 300 uL 80% methanol containing Valine-D8 as an internal control. 143B extracts were further processed by LCMS, described below.
Fatty acid analyses.
To analyze fatty acids in serum/LIF+2i-cultured ESCs undergoing exit from pluripotency, ESCs were seeded in maintenance medium in six-well plates overnight. The next day, cells were washed with PBS and changed into medium containing a 1:1 mix of glutamine-free DMEM and Neurobasal medium including N-2 supplement, B-27 supplement, 2-mercaptoethanol and 2 mM L-glutamine. 24 h prior to harvest, cells were washed with PBS and changed into medium containing a 1:1 combination of glucose- and glutamine-free DMEM and glucose- and glutamine-free Neurobasal-A medium including N-2 supplement, B-27 supplement, 2-mercaptoethanol, 2mM L-glutamine and 20 mM glucose supplemented with 5 mM [1,2-13C]sodium acetate (Cambridge Isotope Laboratories). At harvest, lysates were collected in PBS and centrifuged at 6,800 g for 5 min to pellet cells. To isolate fatty acids, cell pellets were resuspended in 400 μL HPLC grade methanol followed by 800 μl HPLC grade chloroform and samples were vortexed for 10 min at 4°C. 300 μL HPLC grade water then added to induce phase separation. 800 μL of the bottom chloroform layer was moved to a new tube and lyophilized. Dried samples were saponified by resuspending in 1 mL of 80% methanol with 0.3 M KOH and heating at 80°C for 1 h in a glass vial. Next, 1 mL of HPLC grade hexanes were added to the vial and briefly vortexed. 800 μL of the top hexane layer was moved to a new tube and lyophilized. Extracts were then further processed by LCMS, described below.
Gas chromatography-mass spectrometry.
Extracts were dried in an evaporator (Genevac EZ-2 Elite) and resuspended by incubating with shaking at 30 °C for 2 h in 50 μL of 40 mg mL−1 methoxyamine hydrochloride in pyridine. Metabolites were further derivatized by adding 80 μL of N-methyl-N-(trimethylsilyl) trifluoroacetamide with or without 1% TCMS (Thermo Fisher Scientific) and 70 μL ethyl acetate (Sigma-Aldrich) and then incubated at 37 °C for 30 min. Samples were analyzed using an Agilent 7890A Gas Chromatograph coupled to an Agilent 5977C mass selective detector. The gas chromatograph was operated in splitless injection mode with constant helium gas flow at 1 mL min−1; 1 μL of derivatized metabolites was injected onto an HP-5ms column and the gas chromatograph oven temperature ramped from 60 to 290 °C over 25 min. Peaks representing compounds of interest were extracted and integrated using the MassHunter software v.B.08 (Agilent Technologies) and then normalized to both the internal standard (d5–2HG) peak area and protein content of triplicate samples as determined by bicinchoninic acid assay (Thermo Fisher Scientific). Steady-state metabolite pool levels were derived by quantifying the following ions: d5–2HG, 354 m/z; αKG, 304 m/z; aspartate, 334 m/z; citrate, 465 m/z; fumarate, 245 m/z; malate, 335 m/z; and succinate, 247 m/z. All peaks were manually inspected and verified relative to known spectra for each metabolite. Enrichment of [13C] or [2H] was assessed by quantifying the abundance of the following ions: aspartate, 334–346 m/z; citrate, 465–482 m/z; fumarate, 245–254 m/z; and malate, 335–347 m/z. Correction for natural isotope abundance was performed using IsoCor software v.1.0 or v.2.042. Full isotopologue distributions generated by isotope tracing experiments can be found in Supplementary Table 4.
Liquid chromatography-mass spectrometry.
Lyophilized samples were resuspended in 80% methanol in water and transferred to liquid chromatography-mass spectrometry (LCMS) vials for measurement by LCMS. Metabolite quantitation was performed using a Q Exactive HF-X Hybrid Quadrupole-Orbitrap Mass Spectrometer equipped with an Ion Max API source and H-ESI II probe, coupled to a Vanquish Flex Binary UHPLC system (Thermo Scientific). Mass calibrations were completed at a minimum of every 5 days in both the positive and negative polarity modes using LTQ Velos ESI Calibration Solution (Pierce). Polar Samples were chromatographically separated by injecting a sample volume of either 1 μL in the MS1 mode or 5 μL in the SIM mode into a SeQuant ZIC-pHILIC Polymeric column (2.1 × 150 mm 5 mM, EMD Millipore). The flow rate was set to 150 mL/min, autosampler temperature set to 10 °C, and column temperature set to 30 °C. Mobile Phase A consisted of 20 mM ammonium carbonate and 0.1 % (v/v) ammonium hydroxide, and Mobile Phase B consisted of 100 % acetonitrile. The sample was gradient eluted (%B) from the column as follows: 0–20 min.: linear gradient from 85 % to 20 % B; 20–24 min.: hold at 20 % B; 24–24.5 min.: linear gradient from 20 % to 85 % B; 24.5 min.-end: hold at 85 % B until equilibrated with ten column volumes. Mobile Phase was directed into the ion source with the following parameters: sheath gas = 45, auxiliary gas = 15, sweep gas = 2, spray voltage = 2.9 kV in the negative mode or 3.5 kV in the positive mode, capillary temperature = 300 °C, RF level = 40 %, auxiliary gas heater temperature = 325 °C. Mass detection was conducted with a resolution of 240,000 in full scan mode or 120,000 in SIM mode, with an AGC target of 3,000,000 and maximum injection time of 250 msec for the full scan mode, or 100,000 and 100 msec for the SIM mode. Metabolites were detected over mass range of 70–1050 m/z in full scan positive mode, or SIM in positive mode using a quadrupole isolation window of 0.7 m/z. Non-Polar Samples were chromatographically separated by injecting 2 μL into an Accucore Vanquish C18+ column (2.1 × 100 mm, 1.5μm particle size, p/n 27101–102130, Thermo Scientific). The autosampler temperature was set at 10°C and the flow rate was 500 μL/minwith the column temperature set at 50°C. The largely isocratic gradient consisted of a mixture of water/5 mM ammonium acetate as “A” and acetonitrile as “B” where between 0–6.5 min, the solvent composition was held at 60% “B”, followed by a change to 98% “B” between 6.5–6.6 min. The composition was held at 98% “B” between 6.6–9.0 min, and then returned back to starting conditions at 60% “B” between 9.0–9.1 minutes. It was then held for an additional 4.4 minutes to re-equilibrate the column for the next run. Non-polar analytes were detected in the negative polarity mode at a resolution of 240,000 in the full scan setting, using a mass range of 240–650 m/z. The AGC target value was 3,000,000 with a maximum injection time of 200 ms. The chromatography peak width setting was 10 seconds (FWHM), and data were collected in profile mode. The parameters for the H-ESI source were as follows: sheath gas flow rate of 53 units, aux gas flow rate of 14 units, sweep gas flow rate of 3 units, with the spray voltage set at 3.00 kV. The funnel RF level was set at 40%, and the capillary and auxiliary gas heater temperatures were held at 300°C and 400°C respectively. Quantitation of all metabolites was performed using Tracefinder 4.1 (Thermo Scientific) referencing an in-house metabolite standards library using ≤ 5 ppm mass error. Data from stable isotope labeling experiments includes correction for natural isotope abundance using IsoCor software v.2.2. Isotopologue distributions can be found in Supplementary Table 4.
Oxygen consumption.
Oxygen consumption rate (OCR) was measured using a Seahorse XFe96 Extracellular Flux Analyzer (Agilent Technologies). ESCs were plated on gelatin-coated tissue culture-treated XF96 96-well plates (Agilent Technologies) at 2 × 10⁴ cells per well in standard maintenance medium. The following day, cells were washed twice with assay medium (Seahorse XF DMEM Medium supplemented with 10 mM glucose) and changed to assay medium containing 2 mM L-glutamine for 2 h prior to the assay. Baseline measurements of OCR were obtained three times. Following the assay, protein content was determined and averaged per condition and the OCR measurements were normalized to these values. The third baseline OCR reading was averaged across all 12 replicates; averaged values from three independent experiments are shown.
Western blotting.
Protein lysates were extracted in 1X RIPA buffer (Cell Signaling Technology), separated by SDS–polyacrylamide gel electrophoresis and transferred to nitrocellulose membranes (Bio-Rad). For histone blots, cell pellets were flash frozen in ethanol and resuspended in Laemmli buffer for sonication. Samples were mixed with 5% BME and 0.01% bromophenol blue prior to identical separation as for protein lysates. Membranes were blocked in 3% milk in Tris-buffered saline with 0.1% Tween 20 (TBST) or 5% BSA in TBST and incubated at 4 °C with primary antibodies overnight. After TBST washes the next day, membranes were incubated with horseradish peroxidase-conjugated secondary antibodies (mouse catalog no. NA931; rabbit catalog no. NA934; Cytiva) for at least 2 h, incubated with enhanced chemiluminescence (Thermo Fisher Scientific) and imaged with an SRX-101A X-ray Film Processor (Konica Minolta). The antibodies used (at 1:1,000 unless otherwise indicated) were: ACL (catalog no. 4332; Cell Signaling Technologies), ACO2 (catalog no. MA1–029; ThermoFisher ), SLC25A1 (catalog no. 15235–1-AP; ProteinTech), MDH1 (catalog no. sc-166879; Santa Cruz Biotechnology), ACACA (catalog no. MAB6898; R&D Systems), AceCS1/ACSS2 (catalog no. 3658; Cell Signaling Technologies), TCF7L1 (catalog no. sc-166411; Santa Cruz Biotechnology), Myogenin/MYOG (catalog no. 14–5643-82; ThermoFisher), MYH3 (catalog no. 22287–1-AP; ProteinTech), Vinculin (1:10,000; catalog no. V9131; Sigma), Tubulin (catalog no. T9026; Sigma-Aldrich), H3K9ac (catalog no. 9469; Cell Signaling Technology), H3K14ac (catalog no. 07–353; Millipore Sigma), H3K27ac (catalog no. 39133; Active Motif), H4K16ac, (1:500; catalog no. 39167; Active Motif), H3 (catalog no. Ab1791; Abcam), and H4 (1:500; catalog no. 07–108; Millipore Sigma). C2C12 myoblast genetic hairpin lines were maintained in medium supplemented with 1 μg/mL doxycycline for 48 h prior to protein lysate extraction to induce shRNA expression.
Colony formation assay.
ESCs adapted to 2i/LIF or serum/LIF+2i were subjected to exit from pluripotency in triplicate for 12, 24 or 40 h. On the day of harvest, cells were counted and reseeded at a density of 2,000 cells per well in technical triplicate in maintenance medium containing 2i and LIF. Medium was refreshed every 3 days. Six days after initial seeding, cells were fixed with citrate/acetone/3% formaldehyde for 30 s and stained with the Leukocyte Alkaline Phosphatase Kit (Sigma-Aldrich) according to the manufacturer’s instructions. Colonies were quantified using ImageJ’s particle analysis function and technical triplicates were averaged for each condition.
Quantification of gene expression.
RNA was isolated from six- or twelve-well plates using TRIzol (Invitrogen) according to the manufacturer’s instructions and 200 ng RNA was used for complementary DNA (cDNA) synthesis using the iScript cDNA Synthesis Kit (Bio-Rad). Quantitative real-time PCR analysis was performed in technical triplicate using QuantStudio 5 or 6 Flex (Applied Biosystems) with Power SYBR Green Master Mix (Thermo Fisher Scientific). All data were generated using cDNA from 3 independent wells for each condition. Actin was used as an endogenous control for all experiments. See Supplementary Table 2 for qRT-PCR primer sequences.
RNA-seq of myoblasts and myotubes.
RNA was isolated as described above and quantified using a Qubit 3.0 fluorometer. RNA-seq libraries were generated using TruSeq Stranded mRNA Library Prep Kit (catalog no. 20020594; Illumina) according to the manufacturer’s instructions. Samples were pooled and sequenced at the Memorial Sloan Kettering Cancer Center Integrated Genomics Operation. RNA-seq libraries were filtered and trimmed using fastp43 and mapped with STAR aligner44 against the mm10 mouse genome assembly using default parameters. featureCounts45 was used to calculate gene counts for input into DESeq246 for quality control analysis, size normalization and variance dispersion corrections.
Statistics and reproducibility.
Prism 9 (GraphPad Software) software was used for statistical analyses except for DepMap data. Error bars, P values and statistical tests are reported in the figures and figure legends. Statistical analyses on DepMap data were performed with Python v3.8. Experiments were performed in biological triplicate or as indicated in the figure legends and were repeated at least two, often many more, times.
Data availability.
RNA-seq data that support the findings of this study have been deposited in the Gene Expression Omnibus under the accession code GSE183434. Alignment was performed against the mouse mm10 genome assembly. Gene essentiality data and NSCLC gene expression data are available from the DepMap Portal (https://depmap.org/portal/). Source data for Figs. 1–4 and Extended Data Figs. 1–10 are provided with the paper. Isotopologue distributions from all mass spectrometric isotope tracing experiments can be found in Supplementary Table 4.
Code availability.
Code used to perform gene essentiality correlation and network modeling can be found at: https://github.com/finley-lab/coessentiality-network.
Extended Data
Extended Data Fig. 1: Metabolic gene essentiality correlations across cancer cell lines.

Heatmap depicting hierarchical clustering of pairwise gene essentiality score correlations of core metabolic pathway genes derived from four GO terms: tricarboxylic acid (TCA) cycle, canonical glycolysis, one-carbon metabolic process and fatty-acyl-CoA metabolic process. Genes are color coded to the left of the heatmap according to the GO term. TCA cycle genes are highlighted (red) in the dendrogram. Gene names and correlation scores can be found in Supplementary Table 1.
Extended Data Fig. 2: Effect of ACL inhibition on 13C labeling of TCA cycle metabolites.

a, Two-dimensional network diagram representing gene essentiality score correlations between TCA cycle genes and their top co-dependencies. The strength of the correlation between genes is represented by both the length and thickness of the connecting edge. Correlation scores are shown in Supplementary Table 1. b, c, Fractional enrichment of citrate (left) and malate (right) in three non-small cell lung cancer (NSCLC) cell lines cultured in medium containing [U-13C]glucose (b) or [U-13C]glutamine (c) and treated with vehicle or 50 μM BMS-303141(ACLi) for 24 h. d, Schematic depicting [U-13C]asparagine labeling of aspartate and citrate in cells expressing guinea pig asparaginase (ASNase). Asparagine-derived aspartate will generate m+4 labeled citrate. Top, m+4 labeled citrate metabolized via the canonical TCA cycle will lose two labeled carbons as CO2, ultimately regenerating citrate that retains two labeled carbons (m+2). Bottom, m+4 labeled citrate metabolized by ACL will yield m+4 labeled oxaloacetate that will ultimately regenerate m+4 labeled citrate. e, f, Fractional labeling of aspartate (left) and citrate (right) (e) or citrate m+2 relative to citrate m+4 (Cit+2/Cit+4) (f) in ASNase-expressing 143B human osteosarcoma cells cultured in medium containing [U-13C]asparagine and treated with vehicle or 50 μM ACLi for 24 h. Data are mean ± SD, n = 3 independent replicates. Significance was assessed in comparison to vehicle treatment by two-way ANOVA with Sidak’s multiple comparisons post-test (b-c, e) or using unpaired two-tailed Student’s t-test (f).
Extended Data Fig. 3: ACO2 and ACL disruption in embryonic stem cells.

a, Fractional m+2 enrichment of citrate and malate in mouse ESCs cultured in medium containing [U-13C]glucose. b, Fractional enrichment of malate m+2 relative to citrate m+2 (Mal+2/Cit+2) derived from [U-13C]glucose in ESCs following treatment with vehicle or 50 μM BMS-303141 (ACLi) for 24 h. c, d, Immunoblot of clonal mouse embryonic stem cells (ESCs) in which CRISPR/Cas9-mediated editing was used to target either a non-genic region of chromosome 8 (Ctrl) and Acly (ACLY-1 and ACLY-2) (c) or Aco2 (ACO2–1 and ACO2–2) (d). e, f, Assessment of the [U-13C]glucose-derived Mal+2/Cit+2 ratio (e) or steady-state levels of TCA cycle metabolites represented as the fold change (expressed in log2) relative to Ctrl (f) in control and Aco2-edited ESCs. g, h, j, k, Fractional m+1 enrichment of NADH (g), lactate (h), fumarate (j) and succinate (k) in control and Acly-edited ESCs cultured in medium containing [4-2H]glucose. i, Schematic depicting deuterium transfer from [4-2H]glucose first onto malate in the cytoplasm then onto TCA cycle metabolites in the mitochondria. l, Quantification of the lactate over pyruvate ratio in control and Acly-edited ESCs. m, The baseline oxygen consumption rate (OCR) in control and Acly-edited ESCs normalized to protein content. Twelve technical replicates were averaged for each of three independent experiments. Data are mean ± SD, n = 3 independent replicates unless otherwise noted. Significance was assessed using unpaired two-tailed Student’s t-test (a, b) or in comparison to control cells by one-way ANOVA with Sidak’s multiple comparisons post-test for all other panels.
Extended Data Fig. 4: SLC25A1 and MDH1 contribute to TCA cycle metabolism in embryonic stem cells.

a, b, Immunoblot of clonal mouse embryonic stem cells (ESCs) in which CRISPR/Cas9-mediated editing was used to target either a non-genic region of chromosome 8 (Ctrl) and Slc25a1 (SLC25A1–1 and SLC25A1–2) (a) or Mdh1 (MDH1–1 and MDH1–2) (b). c, d, Fractional m+1 enrichment of malate (Mal), fumarate (Fum), aspartate (Asp) and citrate (Cit) in control (Ctrl) and Slc25a1-edited ESCs (c) or Mdh1-edited ESCs (d) cultured in medium containing [4-2H]glucose. e, f, Fractional m+2 enrichment of citrate, fumarate, malate and aspartate derived from [U-13C]glucose in control and Slc25a1-edited (e) or Mdh1-edited (f) ESCs. g, Steady-state levels of TCA cycle metabolites in Slc25a1-edited or Mdh1-edited ESCs. Levels are represented as the fold change (expressed in log2) relative to chromosome 8-targeted control cells. Data are mean ± SD, n = 3 independent replicates. Significance was assessed in comparison to control cells by two-way ANOVA (c-f) with Sidak’s multiple comparisons post-test.
Extended Data Fig. 5: Effect of myogenic differentiation on 13C-glucose labeling of TCA cycle intermediates.

a, Immunoblot comparing expression of myogenesis markers MYOG and MYH3 between proliferating (Prolif) and 100% confluent (Conf) myoblasts and myotubes differentiated for 3, 5 or 7 days. b, Fractional labeling of citrate (left) and malate (right) in proliferating and confluent myoblasts and myotubes differentiated for 3, 5 or 7 days cultured in medium containing [U-13C]glucose. c, Fractional m+1 enrichment from [4-2H]glucose of malate (Mal), fumarate (Fum), aspartate (Asp) and citrate (Cit) in myoblasts and myotubes differentiated for 5 days. d, Immunoblot comparing expression of ACL and ACO2 in C2C12 cells expressing doxycycline-inducible shRNAs targeting Acly (shAcly-1 and shAcly-2), Aco2 (shAco2–1 and shAco2–2) or Renilla luciferase (shRen, used as a control). Cells were cultured on doxycycline for two days to induce shRNA expression. e-h, Fractional m+2 enrichment of citrate (left) and malate (right) or malate m+2 relative to citrate m+2 (Mal+2/Cit+2) in myoblasts (e, f) or myotubes (g, h) expressing doxycycline-inducible shRNAs targeting Acly, Aco2 or Renilla luciferase cultured in medium containing [U-13C]glucose. Myoblasts and myotubes were cultured on doxycycline for two or four days, respectively, to induce shRNA expression. Data are mean ± SD, n = 3 independent replicates. In b, significance was assessed using one-way ANOVA with Sidak’s multiple comparisons post-test to compare total metabolite fraction labeled relative to proliferating myoblasts. In remaining panels, significance was assessed by two-way ANOVA in comparison to myoblasts (c) or by one-way ANOVA in comparison to shRen-expressing myoblasts (e-f) or myotubes (g-h) with Sidak’s multiple comparisons post-test.
Extended Data Fig. 6: Transcriptional profiles associated with TCA cycle choice.

a, Gene set enrichment analysis showing that genes positively correlated with fractional enrichment of malate m+2 relative to citrate m+2 (Mal+2/Cit+2) derived from [U-13C]glucose in 68 non-small cell lung cancer (NSCLC) are enriched for KEGG citric acid (TCA) cycle-associated genes. b, c, Fractional m+2 enrichment of citrate (Cit), fumarate (Fum), malate (Mal) and aspartate (Asp) (b) or Mal+2/Cit+2 (c) derived from [U-13C]glucose in mouse embryonic stem cells (ESCs) following treatment with vehicle, 5 mM DCA or 10 μM MPCi for 24 h. Data are mean ± SD, n = 3 independent samples. In b-c, significance was assessed in comparison to vehicle treatment by two-way ANOVA (b) or one-way ANOVA (c) with Sidak’s multiple comparisons post-test.
Extended Data Fig. 7: ACL loss blunts exit from naïve pluripotency.

a, Experimental setup for cell fate transitions. Mouse embryonic stem cells (ESCs) cultured in serum and leukemia inhibitory factor (LIF) are a heterogenous population that can be converted to the naïve, ground state of pluripotency by addition of MEK and GSK3β inhibitors (2i) in either serum replete (serum/LIF+2i, d-f) or serum-free (2i/LIF, g-i) media formulations. Transition to serum-free medium lacking 2i/LIF (−2i/LIF) induces exit from the naïve pluripotent state, enabling ESCs to gain differentiation competence. b, qRT-PCR of pluripotency-associated (Nanog, Esrrb, Klf2, Rex1 and Oct4) and early differentiation-associated (Fgf5, Otx2 and Sox1) genes in 2i/LIF-cultured ESCs subjected to 2i/LIF withdrawal for 12, 24 or 40 h. Levels are represented as the fold change (expressed in log2) relative to naïve, 2i/LIF-cultured ESCs (0 h). c, Quantification of alkaline phosphatase (AP)-positive colonies representing ESCs that failed to exit from the pluripotent state. 2i/LIF-cultured ESCs were subjected to 2i/LIF withdrawal for 0, 12, 24 or 40 h and then reseeded at clonal density into medium containing 2i and LIF. d-f, Fractional labeling of citrate (Cit), malate (Mal) and aspartate (Asp) in serum/LIF+2i-cultured ESCs incubated with [U-13C]glucose (d), [U-13C]glutamine (e) or [4-2H]glucose (f) subjected to exit from pluripotency for the indicated times. g, Fractional enrichment of glucose-derived malate m+2 relative to citrate m+2 (Mal+2/Cit+2) in 2i/LIF-cultured ESCs subjected to 2i/LIF withdrawal for the indicated times. h, i, Fractional labeling of citrate, malate and aspartate in 2i/LIF-cultured ESCs cultured in medium containing [U-13C]glucose (h) or [U-13C]glutamine (i) subjected to 2i/LIF withdrawal for the indicated times. j, Immunoblot of polyclonal ESCs in which CRISPR/Cas9-mediated editing was used to target either a non-genic region of chromosome 8 (sgChr8) or Tcf7l1 (sgTcf7l1). k, qRT-PCR of pluripotency-associated (Nanog,Esrrb, and Rex1) and early differentiation-associated (Sox1) genes in control and Tcf7l1-edited ESCs adapted to the naïve, ground state and subjected to 2i/LIF withdrawal for the indicated times. Levels are represented as the fold change (expressed in log2) relative to chromosome 8-targeted control cells in the naïve, ground state (0 h). l, m, Fractional labeling of citrate (left) and malate (right) (l) and glucose-derived Mal+2/Cit+2 ratio (m) in chromosome 8-targeted control or Tcf7l1-edited ESCs cultured in medium containing [U-13C]glucose subjected to 2i/LIF withdrawal for the indicated times. Data are mean ± SD, n = 3 independent replicates. In d-e, h-i, and l, significance was assessed using one-way ANOVA (d-e, h-i) or two-way ANOVA (l) with Sidak’s multiple comparisons post-test to compare total metabolite fraction labeled relative to the 0 h timepoint (d-e, h-i) or control cells (l). In remaining panels, significance was assessed relative to the 0 h timepoint using one-way ANOVA (c, f-g) or chromosome 8-targeted control cells at each time point using two-way ANOVA (k, m) with Sidak’s multiple comparisons post-test.
Extended Data Fig. 8: Acetate does not reverse the effects of ACL loss on exit from pluripotency.

a, b, Fractional labeling of citrate (Cit), malate (Mal) and aspartate (Asp) in control and Acly-edited ESCs cultured in medium containing [U-13C]glucose (a) or [U-13C]glutamine (b) following 40 h of 2i/LIF withdrawal. c, d, Fractional enrichment of malate m+2 relative to citrate m+2 (Mal+2/Cit+2) derived from [U-13C]glucose (c) or steady-state levels of TCA cycle metabolites (d) in naïve, 2i-adapted control (Ctrl) and Acly-edited (ACLY-1 and ACLY-2) ESCs. Steady-state levels are represented as the fold change (expressed in log2) relative to control cells. e, f, Assessment of the [U-13C]glucose-derived Mal+2/Cit+2 ratio (e) and steady-state levels of TCA cycle metabolites (f) in control and Acly-edited ESCs subjected to 2i/LIF withdrawal for 40 h. g, Relative viability (measured by PI exclusion) of control and Acly-edited ESCs maintained in the naïve pluripotent state (+2i/LIF, left) or subjected to 2i/LIF withdrawal for 40 h (−2i/LIF, right). h, Immunoblot showing expression of ACSS2, the enzyme that converts acetate to acetyl-CoA in the cytosol, in naïve, ground state ESCs subjected to 2i/LIF withdrawal for the indicated times. i, Fractional labeling of palmitate in control and Acly-edited ESCs cultured in medium containing [U-13C]acetate following 40 h of 2i/LIF withdrawal. Each bar represents one independent sample. j, Immunoblot comparing levels of acetylation (ac) at indicated histone lysine residues in control and Acly-edited ESCs subjected to 2i/LIF withdrawal for 40 h in the presence of vehicle or 5 mM sodium acetate. k, Relative viability of control and Acly-edited ESCs subjected to 2i/LIF withdrawal for 40 h in the presence of vehicle or 5 mM sodium acetate. l, Quantification of GFP mean fluorescence intensity (MFI) encoded by the Rex1::GFPd2 reporter in ESCs subjected to 2i/LIF withdrawal for 40 h in the presence of vehicle or 50 μM BMS-303141 (ACLi). Naïve ESCs (+2i/LIF) are included as a control. Representative histograms are shown in Fig. 4d. m, qRT-PCR of pluripotency-associated (Nanog, Esrrb and Rex1) and early differentiation-associated (Sox1) genes in control and Acly-edited ESCs subjected to 2i/LIF withdrawal for 40 h. Levels are represented as the fold change (expressed in log2) relative to chromosome 8-targeted control cells. n, Alkaline phosphatase (AP) staining of colony formation assay representing control and Acly-edited ESCs that failed to exit the naïve pluripotent state. 2i-adapted ESCs were subjected to 2i/LIF withdrawal for 40 h and then reseeded at clonal density into medium containing 2i/LIF. Quantification is shown in Fig. 4e. o, qRT-PCR of pluripotency-associated genes in control and Acly-edited ESCs subjected to 2i/LIF withdrawal for 40 h in the presence of vehicle or 5 mM sodium acetate. p, Quantification of GFP MFI encoded by the Rex1::GFPd2 reporter in ESCs subjected to 2i/LIF withdrawal for 40 h in the presence of DMSO or 50 μM BMS-303141(ACLi) and vehicle or 5 mM sodium acetate. q, Quantification of AP-positive colonies representing control and Acly-edited ESCs that failed to exit from the pluripotent state. ESCs were subjected to 2i/LIF withdrawal for 40 h in the presence of vehicle or 5 mM sodium acetate prior to reseeding at clonal density into medium containing 2i and LIF. Data are mean ± SD, n = 5 (p), n = 4 (g, k, l) or n = 3 (all other experiments) independent replicates. In a-b, significance was assessed using one-way ANOVA with Sidak’s multiple comparisons post-test to compare total metabolite fraction labeled relative to control cells. In remaining panels, significance was assessed by two-way ANOVA relative to control cells (k, q) or DMSO treatment (p) with Sidak’s multiple comparisons post-test, or by one-way ANOVA in comparison to control cells (c, e, g) with Sidak’s multiple comparisons post-test or in the indicated comparisons (l) with Tukey’s multiple comparisons post-test.
Extended Data Fig. 9: Effect of SLC25A1 and MDH1 loss in exit from naïve pluripotency.

a, b, Relative viability (measured by PI exclusion) of control and Slc25a1-edited (left) and Mdh1-edited (right) ESCs maintained in the naïve pluripotent state (+2i/LIF, a) or subjected to 2i/LIF withdrawal for 40 h (−2i/LIF, b). c, Steady-state levels of TCA cycle metabolites in control and Slc25a1-edited (left) and Mdh1-edited (right) ESCs subjected to 2i/LIF withdrawal for 40 h. Steady-state levels are represented as the fold change (expressed in log2) relative to control cells. d, e, Relative O-propargyl-puromycin (OP-puro) mean fluorescence intensity (MFI) in control, Slc25a1-edited, Acly-edited and Mdh1-edited ESCs that have been maintained in the naïve pluripotent state (d) or subjected to 2i/LIF withdrawal for 40 h (e). Dotted line represents OP-puro MFI following cycloheximide (CHX) treatment as a control. f, g, Population doublings of control, Slc25a1-edited, Acly-edited and Mdh1-edited ESCs that have been maintained in the naïve pluripotent state (f) or subjected to 2i/LIF withdrawal for 40 h (g). h, i, qRT-PCR of pluripotency-associated (Nanog, Esrrb and Rex1) and early differentiation-associated (Sox1) genes in control and Slc25a1-edited (h) and Mdh1-edited (i) ESCs subjected to 2i/LIF withdrawal for 40 h. Data are mean ± SD, n = 3 independent samples. Significance was assessed in comparison to control cells by one-way ANOVA with Sidak’s multiple comparisons post-test.
Extended Data Fig. 10: Mode of TCA cycle engagement regulates cell fate.

a, Population doublings of control and Aco2-edited ESCs cultured in metastable (serum/LIF) conditions. b, Cumulative population doublings over the indicated passages of control and Aco2-edited ESCs upon conversion to the naïve, ground state of pluripotency via addition of MEK and GSK3β inhibitors (+2i). c, qRT-PCR of pluripotency-associated genes at the indicated passages in control and Aco2-edited ESCs following addition of 2i. Gene expression at every passage was normalized to passage 0 (p0). Data are mean ± SD, n = 1 (b) or n = 3 (a, c) independent replicates. Significance was assessed in comparison to control cells by one-way ANOVA with Sidak’s multiple comparisons post-test (a) or relative to control cells at each timepoint with P values colored according to comparison by two-way ANOVA with Sidak’s multiple comparisons post-test (c).
Supplementary Material
Acknowledgements.
We thank members of the Finley laboratory for discussion and A. Boire, A. Intlekofer, S. Vardhana, E. Reznik and K.S. Tan for critical feedback. Rex1::GFPd2 cells were a kind gift from A. Smith, University of Exeter, United Kingdom. P.K.A. is an NICHD Ruth L. Kirschstein Predoctoral fellow (F31HD098824). B.T.J. is a Gerstner Sloan Kettering Grayer Fellow and is supported by a Medical Scientist Training Program grant from the NIGMS of the National Institutes of Health under award number T32GM007739 to the Weill Cornell/Rockefeller/Sloan Kettering Tri-Institutional MD-PhD Program. K.I.P. is supported by a Bruce Charles Forbes Pre-Doctoral Fellowship (MSKCC). J.S.B. is supported by a Human Frontier Science Program Fellowship (LT000200/2021-L). L.B.S. is supported by R00CA218679 and P30CA015704. L.W.S.F. is a Searle Scholar. This research was additionally supported by grants to L.W.S.F. from the Pershing Square Sohn Prize for Cancer Research, the Starr Foundation (I12-0051), the NIH/NCI (R37 CA252305) and the Anna Fuller Fund as well as the Memorial Sloan Kettering Cancer Center Support Grant P30CA008748.
Footnotes
Competing interests. P.K.A., B.T.J. and L.W.S.F. are inventors on a provisional patent application (U.S. Provisional Application No. 63/272,940) filed by Memorial Sloan Kettering Cancer Center. The patent application covers the use of ACL inhibitors to modify self-renewal potential of ESCs. The remaining authors declare no conflicts of interest.
Additional information.
Supplementary information is available for this paper.
References:
- 1.DeBerardinis RJ & Chandel NS Fundamentals of cancer metabolism. Sci Adv 2, e1600200, doi: 10.1126/sciadv.1600200 (2016). [DOI] [PMC free article] [PubMed] [Google Scholar]
- 2.Kim J & DeBerardinis RJ Mechanisms and Implications of Metabolic Heterogeneity in Cancer. Cell metabolism 30, 434–446, doi: 10.1016/j.cmet.2019.08.013 (2019). [DOI] [PMC free article] [PubMed] [Google Scholar]
- 3.Muir A, Danai LV & Vander Heiden MG Microenvironmental regulation of cancer cell metabolism: implications for experimental design and translational studies. Dis Model Mech 11, doi: 10.1242/dmm.035758 (2018). [DOI] [PMC free article] [PubMed] [Google Scholar]
- 4.Tsherniak A et al. Defining a Cancer Dependency Map. Cell 170, 564–576 e516, doi: 10.1016/j.cell.2017.06.010 (2017). [DOI] [PMC free article] [PubMed] [Google Scholar]
- 5.Wainberg M et al. A genome-wide almanac of co-essential modules assigns function to uncharacterized genes. bioRxiv, 827071, doi: 10.1101/827071 (2019). [DOI] [PMC free article] [PubMed] [Google Scholar]
- 6.Hatzivassiliou G et al. ATP citrate lyase inhibition can suppress tumor cell growth. Cancer cell 8, 311–321, doi: 10.1016/j.ccr.2005.09.008 (2005). [DOI] [PubMed] [Google Scholar]
- 7.Zhao S et al. ATP-Citrate Lyase Controls a Glucose-to-Acetate Metabolic Switch. Cell Rep 17, 1037–1052, doi: 10.1016/j.celrep.2016.09.069 (2016). [DOI] [PMC free article] [PubMed] [Google Scholar]
- 8.Chen PH et al. Metabolic Diversity in Human Non-Small Cell Lung Cancer Cells. Molecular cell 76, 838–851 e835, doi: 10.1016/j.molcel.2019.08.028 (2019). [DOI] [PMC free article] [PubMed] [Google Scholar]
- 9.Alves TC et al. Integrated, Step-Wise, Mass-Isotopomeric Flux Analysis of the TCA Cycle. Cell metabolism 22, 936–947, doi: 10.1016/j.cmet.2015.08.021 (2015). [DOI] [PMC free article] [PubMed] [Google Scholar]
- 10.Sullivan LB et al. Aspartate is an endogenous metabolic limitation for tumour growth. Nat Cell Biol 20, 782–788, doi: 10.1038/s41556-018-0125-0 (2018). [DOI] [PMC free article] [PubMed] [Google Scholar]
- 11.Lewis CA et al. Tracing compartmentalized NADPH metabolism in the cytosol and mitochondria of mammalian cells. Molecular cell 55, 253–263, doi: 10.1016/j.molcel.2014.05.008 (2014). [DOI] [PMC free article] [PubMed] [Google Scholar]
- 12.Williamson DH, Lund P & Krebs HA The redox state of free nicotinamide-adenine dinucleotide in the cytoplasm and mitochondria of rat liver. The Biochemical journal 103, 514–527, doi: 10.1042/bj1030514 (1967). [DOI] [PMC free article] [PubMed] [Google Scholar]
- 13.Birsoy K et al. An Essential Role of the Mitochondrial Electron Transport Chain in Cell Proliferation Is to Enable Aspartate Synthesis. Cell 162, 540–551, doi: 10.1016/j.cell.2015.07.016 (2015). [DOI] [PMC free article] [PubMed] [Google Scholar]
- 14.Krebs HA & Eggleston LV The oxidation of pyruvate in pigeon breast muscle. The Biochemical journal 34, 442–459, doi: 10.1042/bj0340442 (1940). [DOI] [PMC free article] [PubMed] [Google Scholar]
- 15.Shintaku J et al. MyoD Regulates Skeletal Muscle Oxidative Metabolism Cooperatively with Alternative NF-kappaB. Cell Rep 17, 514–526, doi: 10.1016/j.celrep.2016.09.010 (2016). [DOI] [PMC free article] [PubMed] [Google Scholar]
- 16.Stacpoole PW The pharmacology of dichloroacetate. Metabolism 38, 1124–1144, doi: 10.1016/0026-0495(89)90051-6 (1989). [DOI] [PubMed] [Google Scholar]
- 17.Kalkan T et al. Tracking the embryonic stem cell transition from ground state pluripotency. Development 144, 1221–1234, doi: 10.1242/dev.142711 (2017). [DOI] [PMC free article] [PubMed] [Google Scholar]
- 18.Vardhana SA et al. Glutamine independence is a selectable feature of pluripotent stem cells. Nature Metabolism 1, 676–687, doi: 10.1038/s42255-019-0082-3 (2019). [DOI] [PMC free article] [PubMed] [Google Scholar]
- 19.Pereira L, Yi F & Merrill BJ Repression of Nanog gene transcription by Tcf3 limits embryonic stem cell self-renewal. Molecular and cellular biology 26, 7479–7491, doi: 10.1128/MCB.00368-06 (2006). [DOI] [PMC free article] [PubMed] [Google Scholar]
- 20.Wray J et al. Inhibition of glycogen synthase kinase-3 alleviates Tcf3 repression of the pluripotency network and increases embryonic stem cell resistance to differentiation. Nat Cell Biol 13, 838–845, doi: 10.1038/ncb2267 (2011). [DOI] [PMC free article] [PubMed] [Google Scholar]
- 21.Moussaieff A et al. Glycolysis-mediated changes in acetyl-CoA and histone acetylation control the early differentiation of embryonic stem cells. Cell metabolism 21, 392–402, doi: 10.1016/j.cmet.2015.02.002 (2015). [DOI] [PubMed] [Google Scholar]
- 22.Sullivan LB et al. Supporting Aspartate Biosynthesis Is an Essential Function of Respiration in Proliferating Cells. Cell 162, 552–563, doi: 10.1016/j.cell.2015.07.017 (2015). [DOI] [PMC free article] [PubMed] [Google Scholar]
- 23.Borst P The malate-aspartate shuttle (Borst cycle): How it started and developed into a major metabolic pathway. IUBMB Life 72, 2241–2259, doi: 10.1002/iub.2367 (2020). [DOI] [PMC free article] [PubMed] [Google Scholar]
- 24.Assmann N et al. Srebp-controlled glucose metabolism is essential for NK cell functional responses. Nat Immunol 18, 1197–1206, doi: 10.1038/ni.3838 (2017). [DOI] [PubMed] [Google Scholar]
- 25.Luengo A et al. Increased demand for NAD(+) relative to ATP drives aerobic glycolysis. Molecular cell, doi: 10.1016/j.molcel.2020.12.012 (2020). [DOI] [PMC free article] [PubMed] [Google Scholar]
- 26.Davidson SM et al. Environment Impacts the Metabolic Dependencies of Ras-Driven Non-Small Cell Lung Cancer. Cell metabolism 23, 517–528, doi: 10.1016/j.cmet.2016.01.007 (2016). [DOI] [PMC free article] [PubMed] [Google Scholar]
- 27.Marin-Valencia I et al. Analysis of tumor metabolism reveals mitochondrial glucose oxidation in genetically diverse human glioblastomas in the mouse brain in vivo. Cell metabolism 15, 827–837, doi: 10.1016/j.cmet.2012.05.001 (2012). [DOI] [PMC free article] [PubMed] [Google Scholar]
- 28.Zhu XG et al. Functional Genomics In Vivo Reveal Metabolic Dependencies of Pancreatic Cancer Cells. Cell metabolism 33, 211–221 e216, doi: 10.1016/j.cmet.2020.10.017 (2021). [DOI] [PMC free article] [PubMed] [Google Scholar]
- 29.Dempster JM et al. Extracting Biological Insights from the Project Achilles Genome-Scale CRISPR Screens in Cancer Cell Lines. bioRxiv, 720243, doi: 10.1101/720243 (2019). [DOI] [Google Scholar]
- 30.Meyers RM et al. Computational correction of copy number effect improves specificity of CRISPR-Cas9 essentiality screens in cancer cells. Nature genetics 49, 1779–1784, doi: 10.1038/ng.3984 (2017). [DOI] [PMC free article] [PubMed] [Google Scholar]
- 31.Ashburner M et al. Gene ontology: tool for the unification of biology. The Gene Ontology Consortium. Nature genetics 25, 25–29, doi: 10.1038/75556 (2000). [DOI] [PMC free article] [PubMed] [Google Scholar]
- 32.The Gene Ontology C The Gene Ontology Resource: 20 years and still GOing strong. Nucleic Acids Res 47, D330–D338, doi: 10.1093/nar/gky1055 (2019). [DOI] [PMC free article] [PubMed] [Google Scholar]
- 33.Virtanen P et al. SciPy 1.0: fundamental algorithms for scientific computing in Python. Nat Methods 17, 261–272, doi: 10.1038/s41592-019-0686-2 (2020). [DOI] [PMC free article] [PubMed] [Google Scholar]
- 34.Ghandi M et al. Next-generation characterization of the Cancer Cell Line Encyclopedia. Nature 569, 503–508, doi: 10.1038/s41586-019-1186-3 (2019). [DOI] [PMC free article] [PubMed] [Google Scholar]
- 35.Subramanian A et al. Gene set enrichment analysis: a knowledge-based approach for interpreting genome-wide expression profiles. Proceedings of the National Academy of Sciences of the United States of America 102, 15545–15550, doi: 10.1073/pnas.0506580102 (2005). [DOI] [PMC free article] [PubMed] [Google Scholar]
- 36.Carey BW, Finley LW, Cross JR, Allis CD & Thompson CB Intracellular alpha-ketoglutarate maintains the pluripotency of embryonic stem cells. Nature 518, 413–416, doi: 10.1038/nature13981 (2015). [DOI] [PMC free article] [PubMed] [Google Scholar]
- 37.Dow LE et al. Inducible in vivo genome editing with CRISPR-Cas9. Nat Biotechnol 33, 390–394, doi: 10.1038/nbt.3155 (2015). [DOI] [PMC free article] [PubMed] [Google Scholar]
- 38.Ran FA et al. Genome engineering using the CRISPR-Cas9 system. Nature protocols 8, 2281–2308, doi: 10.1038/nprot.2013.143 (2013). [DOI] [PMC free article] [PubMed] [Google Scholar]
- 39.MacDougall MS, Clarke R & Merrill BJ Intracellular Ca(2+) Homeostasis and Nuclear Export Mediate Exit from Naive Pluripotency. Cell stem cell 25, 210–224 e216, doi: 10.1016/j.stem.2019.04.015 (2019). [DOI] [PMC free article] [PubMed] [Google Scholar]
- 40.Morris J. P. t. et al. alpha-Ketoglutarate links p53 to cell fate during tumour suppression. Nature, doi: 10.1038/s41586-019-1577-5 (2019). [DOI] [PMC free article] [PubMed] [Google Scholar]
- 41.Fellmann C et al. An optimized microRNA backbone for effective single-copy RNAi. Cell Rep 5, 1704–1713, doi: 10.1016/j.celrep.2013.11.020 (2013). [DOI] [PubMed] [Google Scholar]
- 42.Millard P et al. IsoCor: isotope correction for high-resolution MS labeling experiments. Bioinformatics 35, 4484–4487, doi: 10.1093/bioinformatics/btz209 (2019). [DOI] [PubMed] [Google Scholar]
- 43.Chen S, Zhou Y, Chen Y & Gu J fastp: an ultra-fast all-in-one FASTQ preprocessor. Bioinformatics 34, i884–i890, doi: 10.1093/bioinformatics/bty560 (2018). [DOI] [PMC free article] [PubMed] [Google Scholar]
- 44.Dobin A et al. STAR: ultrafast universal RNA-seq aligner. Bioinformatics 29, 15–21, doi: 10.1093/bioinformatics/bts635 (2013). [DOI] [PMC free article] [PubMed] [Google Scholar]
- 45.Liao Y, Smyth GK & Shi W featureCounts: an efficient general purpose program for assigning sequence reads to genomic features. Bioinformatics 30, 923–930, doi: 10.1093/bioinformatics/btt656 (2014). [DOI] [PubMed] [Google Scholar]
- 46.Love MI, Huber W & Anders S Moderated estimation of fold change and dispersion for RNA-seq data with DESeq2. Genome biology 15, 550, doi: 10.1186/s13059-014-0550-8 (2014). [DOI] [PMC free article] [PubMed] [Google Scholar]
Associated Data
This section collects any data citations, data availability statements, or supplementary materials included in this article.
Supplementary Materials
Data Availability Statement
RNA-seq data that support the findings of this study have been deposited in the Gene Expression Omnibus under the accession code GSE183434. Alignment was performed against the mouse mm10 genome assembly. Gene essentiality data and NSCLC gene expression data are available from the DepMap Portal (https://depmap.org/portal/). Source data for Figs. 1–4 and Extended Data Figs. 1–10 are provided with the paper. Isotopologue distributions from all mass spectrometric isotope tracing experiments can be found in Supplementary Table 4.