Abstract
Background
Colon adenocarcinoma (COAD) is one of the common cancers worldwide. Collagen triple helix repeat containing 1 (CTHRC1) has been reported to be involved in cell invasion, angiogenesis, and the promotion of epithelial-mesenchymal transformation by mediating multiple signaling pathways. However, the role of CTHRC1 in COAD has not yet been determined.
Methods
Differentially expressed genes were evaluated using gene expression data from the Oncomine and TIMER databases. Correlations between CTHRC1 gene expression and clinicopathological factors were analyzed using gene expression data from UALCAN databases. Then, we searched the GEPIA database to evaluate the association of CTHRC1 gene expression with clinical outcomes. The cBioPortal database was used to analyze CTHRC1 genetic alterations. Subsequently, the TIMER website was chosen to assess the correlation of CTHRC1 with the tumor immune cell infiltration level. The TCGA dataset was used for a gene set enrichment analysis (GSEA).
Result
CTHRC1 was highly expressed in COAD patients, and significantly related to poor prognosis. In addition, elevated expression of CTHRC1 was related to the clinical stage and pathological type of COAD. The GSEA analysis showed that CTHRC1 was enriched in Gα signaling, GCPR ligand binding, neutrophil degranulation, interleukin signaling, and tumor-associated pathways. In addition, CTHRC1 was significantly associated with the expression of multiple immune markers related to specific immune cells.
Conclusion
This study suggest that CTHRC1 expression is related to the prognosis and immune infiltration of COAD patients. Therefore, CTHRC1 may be a new candidate prognostic biomarker for determining immune infiltration levels and providing COAD prognoses.
Keywords: CTHRC1, COAD, Prognosis, Biomarker, Immune infiltration
Introduction
Colon adenocarcinoma (COAD) is a common malignant cancer and the second most common cause of cancer-related deaths worldwide [1]. The internal epithelial cells of colorectal tissues are derived from endodermal cells, and a multi-step process occurs from normal epithelium to adenomatous polyps to invasive colorectal cancer, which is achieved by inactivating tumor suppressor genes and activating oncogenes [2]. The treatment response and survival rate of patients with advanced COAD are still very low compared to the early stage of COAD, with 5-year survival rates dropping from 50 to 10% in more advanced cases. Surgical tumor resection is the mainstay treatment of radical treatment for locally advanced COAD, while a treatment strategy is not available for metastatic tumors that cannot be surgically resected or have poor efficacy of chemotherapy and radiotherapy [3]. Quantitative analyses of COAD indicate that stem cells are initially transformed into malignant tumor cells over a 10-year period, and then these tumor cells acquire the ability to metastasize over the next 5 years [4]. Early and accurate detection of COAD is important for disease control and prevention because approximately 30–40% of COAD patients relapse after treatment [5]. Given the clinical challenges of the effectiveness of therapeutic strategies to improve the outcome of COAD patients, a significant proportion of patients receiving conventional treatment still experience relapse. Therefore, it is imperative to find new methods, especially molecular markers, to perform timely diagnosis and assessments of colorectal cancer, identify new drug targets, and to better understand the basic molecular mechanisms of COAD for the successful development of effective treatment.
Many studies have reported that the abnormal expression of many genes in tumor tissues may increase the risk of cancer [6]. Therefore, the identification of changes in gene expression levels will provide new insights for studying the pathogenesis of COAD. The collagen triple helix repeat containing 1 (CTHRC1) gene is located on human chromosome 8q22.3 and was initially identified in balloon injury and normal rat arteries [7]. Its overexpression in fibroblasts is related to an increase in cell migration, motility and invasion [8]. In adults, CTHRC1 is expressed only in the bone matrix and periosteum. CTHRC1 is also present in atherosclerotic plaques and mineralized bone matrix [8]. In other tissues, CTHRC1 is expressed at sites that significantly overlap with interstitial collagen and members of the transforming growth factor-β (TGF-β) family, particularly bone morphogenetic proteins (BMPs) [9]. In addition, the expression of CTHRC1 was positively correlated with lymph node metastasis, tumor stage, and disease prognosis. CTHRC1 is widely upregulated in several solid tumors, including melanoma, gastrointestinal cancer, breast cancer, thyroid cancer, liver cancer, and pancreatic cancer [10]. Recent studies have shown that CTHRC1 can trigger tumor metastasis by promoting epithelial-mesenchymal transformation, promoting cell invasion, and inducing angiogenesis through a variety of signaling pathways [11]. Although the high expression of CTHRC1 and the prognostic value of COAD patients have been highlighted by previous studies, the predictive accuracy of CTHRC1 as a biomarker can vary widely in heterogeneous diseases such as COAD due to the lack of adequate sample sizes and stringent inclusion criteria.
Dysregulation of CTHRC1 expression in COAD and its relationship with clinical pathological features and prognosis have been partially reported. However, bioinformatics analysis has not been applied to explore the role of CTHRC1 in COAD. With the development of RNA-seq technology, genome sequencing has experienced huge changes. In this study, the Cancer Genome Atlas (TCGA) and Oncomine database were employed to investigate the expression and function of CTHRC1 in COAD. The relationship between CTHRC1 levels and clinical pathological parameters was analyzed, and CTHRC1 was identified as a potential biomarker of tumor progression for COAD. Furthermore, we analyzed mutations of CTHRC1 in COAD to determine its expression pattern, potential function, and prognostic value.
Materials and methods
TCGA database
TCGA (www.tcga-data.nci.nih.gov/tcga/) contains more than 10,000 samples of 39 tumor types (16). The TCGA-COAD dataset was acquired from UCSC Xena database (http://xena.ucsc.edu/), and it is processed uniformly by the TOIL process, which is free of computational batch effects [12].
Oncomine database analysis
Oncomine (http://www.oncomine.org) is a gene chip-based database for gene expression analysis, coexpression analysis, enrichment analysis, and interaction network analysis in various cancers [13]. It contains 715 datasets and 86,733 samples. This database uses Student’s t test to compare the transcription levels of CTHRC1 in normal controls and clinical cancer specimens. The p value was set as 0.05 and the fold change was set as 1.5.
UALCAN database analysis
The UALCAN database (http://ualcan.path.uab.edu/) is available for online analysis of differential gene expression in cancer and normal tissue from TCGA and MET500 data [14]. This study used the UALCAN database to determine the correlation between CTHRC1 gene expression and various sub-groups of clinical characteristics. p < 0.05 was considered statistically significant.
GEPIA database analysis
GEPIA (http://gepia.cancer-pku.cn) is a newly developed interactive web server for gene expression analysis based on TCGA and GTEx data [15]. It includes 9736 tumor and 8587 normal samples. In the current study, survival analysis of CTHRC1 was evaluated using TCGA-COAD datasets with a median cut-off. Kaplan–Meier (KM) plots are presented with hazard ratios (HRs), 95% confidence intervals (CIs), and log-rank p values.
PrognoScan database analysis
The correlation between CTHRC1 expression and COAD survival was also analyzed by the PrognoScan database (http://www.abren.net/PrognoScan/) [16]. To select the datasets to be included in this study, the screening parameters were set as follows: “Cancer Type” as COAD, “Gene” as CTHRC1. The HR with 95% CIs was calculated. The threshold was adjusted to a Cox p value < 0.05.
TISIDB database analysis
TISIDB (http://cis.hku.hk/TISIDB/index.php) is a web portal for tumor and immune system interactions that integrates multiple heterogeneous data types [17]. It contains genomics and transcriptomics of 30 cancer types from TCGA, RNA sequencing data set of patient cohorts treated with immunotherapy. It was used to investigate correlations between CTHRC1 and different immune genes.
Tumor-infiltrating immune cell analysis
Tumor-infiltrating immune cell analysis (TIMER) (http://www.timer.cistrome.org/) is a website used to analyze the expression of various types of cancer-associated genes and tumor-infiltrating immune cells [18]. It integrates 10,897 samples across 32 types of cancer in the TCGA. The site provides estimates of immune invasion abundance through multiple immunodeconvolution methods and allows users to dynamically generate high-quality numbers to comprehensively explore tumor immunological, clinical, and genomic characteristics. In this study, the correlations of CTHRC1 expression with immune infiltration in COAD were evaluated by purity-correlated partial Spearman’s correlation values and the statistical significance.
cBioPortal database analysis
cBioPortal (http://www.cbioportal.org) is an online access database used to explore cancer genomic data from multiple perspectives [19]. The gene mutation and survival data derive from 640 COAD samples in the TCGA database in cBioPortal. The genome atlas includes mutations and putative copy number changes in the genome identification of important cancer targets. OncoPrint was constructed to directly reflect all types of changes in CTHRC1 gene amplification, deletion, mRNA upregulation, and mRNA downregulation in COAD patients. In addition, the overall survival (OS) and disease-free survival (DFS) of CTHRC1 gene alteration were analyzed through the “Comparison/Survival” module in cBioPortal.
Gene–gene interaction and protein–protein interaction networks (GeneMANIA)
GeneMANIA (http://www.genemania.org) can be used to generate hypotheses about gene functions, analyze gene lists, and preferentially select genes for functional analysis [20]. A protein-protein interaction network between CTHRC1 and its 50 adjacent genes was constructed by GeneMANIA. Then, these 50 genes were analyzed by gene ontology (GO). GO enrichment analysis predicts the functional role of target host genes based on three aspects, including molecular function, biological processes, and cellular components.
Gene set enrichment analysis
Gene set enrichment analysis (GSEA) is a calculation method based on the entire gene expression matrix and an analysis method that determines whether a previously defined set of genes shows statistically significant and consistent differences between two phenotypes. In this study, ClusterProfiler 3.11 was used to analyze the TCGA-COAD dataset to elucidate significant functional and signaling pathway differences between the high and low CTHRC1 groups. The CTHRC1 gene expression level was used as a phenotypic marker, and each analysis carried out 1000 permutations of gene sets. In this study, H.all.v7.0.symbols.gmt from MSigDB Collections was selected as the reference gene set. The statistically significant GSEA threshold was set as p < 0.05 and FDR < 0.25. The enrichment of phenotypic was sequenced using calibrated p values and normalized enrichment scores.
Statistical analysis
CTHRC1 expression was analyzed via the Oncomine, TIMER, and UALCAN databases. The results of PrognoScan and GEPIA are displayed with HR and P or Cox p values from a log-rank test. Spearman’s correlation analysis was performed to evaluate the correlation of gene expression in TIMER. The GO and GSEA analysis were performed by “ClusterProfiler” R package. All R packages were operated using R software version v3.6.3. p values < 0.05 were considered statistically significant.
Result
Expression of CTHRC1 in different cancers
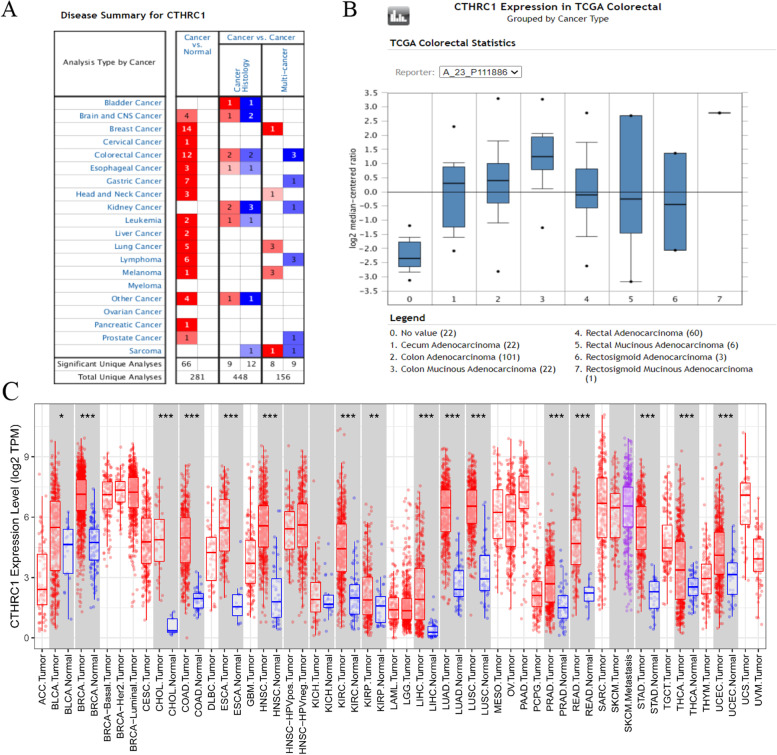
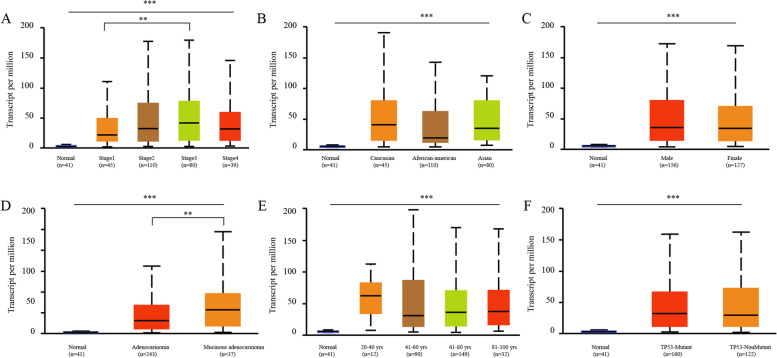
Oncomine and TIMER were used to analyze the expression of CTHRC1 mRNA in COAD and normal tissues. The results showed that CTHRC1 mRNA levels in various cancer tissues were significantly higher than those in normal tissues (Fig. 1A). In addition, CTHRC1 mRNA was significantly upregulated in all intestinal tumors (Fig. 1B). Then, we further assessed these data through the TIMER database and found that CTHRC1 mRNA expression was significantly elevated in most tumors compared with normal tissues, especially in COAD (Fig. 1C). According to TCGA data, CTHRC1 expression was 6.222-fold higher in colorectal adenocarcinoma, 10.224-fold higher in mucinous colon adenocarcinoma, 4.803-fold higher in rectal adenocarcinoma, and 4.643-fold higher in cecum adenocarcinoma compared with normal tissues (Table 1). Then, we evaluated the correlation between the expression of CTHRC1 and the clinicopathological features (age, gender, race, clinical stage, histological, and TP53 mutation status) of COAD through the online cancer OMICS database of UALCAN. According to age, gender, race, clinical stage, histological, and TP53 mutation status, CTHRC1 expression was significantly upregulated in COAD patients compared to the corresponding normal controls (Fig. 2). In COAD patients, CTHRC1 expression levels were positively associated with clinical stages and histological status. The expression of CTHRC1 in stage 3 was higher than in stage 1 (p < 0.05). The expression of CTHRC1 in mucinous adenocarcinoma was higher than in adenocarcinoma (p < 0.05)
Fig. 1.
Expression analysis of CTHRC1 by Oncomine and TIMER databases. A Expression of CTHRC1 in different types of human cancers in the Oncomine database. B CTHRC1 is over-expression in different types of intestinal tumor. C Expression of CTHRC1 in different types of human cancers in the TIMER database
Table 1.
The significant changes of CTHRC1 expression in transcription level between different types of intestinal tumor and normal intestinal tissues (Oncomine database)
| Types of CRC vs. normal | Fold change | p value | t test | Source | |
|---|---|---|---|---|---|
| CTHRC1 | Colon Adenocarcinoma vs. Normal | 6.222 | 1.66E-29 | 17.582 | TCGA |
| Colon Mucinous Adenocarcinoma vs. Normal | 10.224 | 4.01E-15 | 13.761 | TCGA | |
| Rectal Adenocarcinoma vs. Normal | 4.803 | 6.58E-20 | 12.027 | TCGA | |
| Cecum Adenocarcinoma vs. Normal | 4.643 | 3.89E-9 | 8.174 | TCGA |
Fig. 2.
Box plot revealing the relationship between CTHRC1 expression and different clinical indicators. A Clinical stages, B race, C gender, D histological status, E age, F TP53-mutant. **p < 0.01, ***p < 0.001
High expression of CTHRC1 was related to poor prognosis in COAD patients
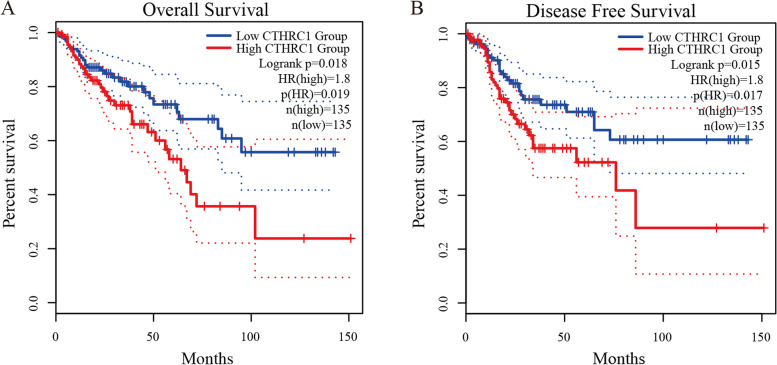
We further explored the critical efficiency of CTHRC1 in the survival of patients with COAD by using Kaplan–Meier Plotter. The Kaplan–Meier curve and log-rank test analyses revealed that increased CTHRC1 mRNA levels were significantly correlated with overall survival (OS) and disease-free survival (DFS) (Fig. 3A, B). COAD patients with high CTHRC1 expression had poor prognosis (OS, HR = 1.8, p = 0.018; DFS, HR = 1.8, p = 0.015). Moreover, the PrognoScan Database showed that overexpression of CTHRC1 was significantly related to low OS, DFS, and disease-specific survival (DSS) (Table 2).
Fig. 3.
Prognostic value of the CTHRC1 expression in COAD. Survival curves using the Kaplan–Meier plots are shown for OS (A), PFS (B). HR hazard ratio
Table 2.
CTHRC1 expression and survival data of COAD patients using the PrognoScan database
Genetic alterations of CTHRC1 in COAD
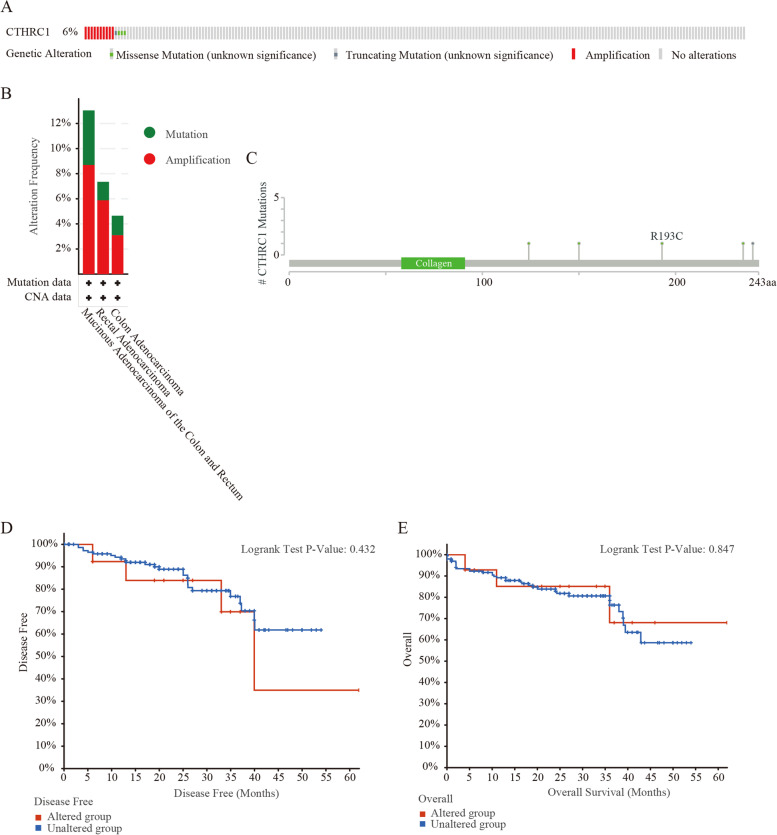
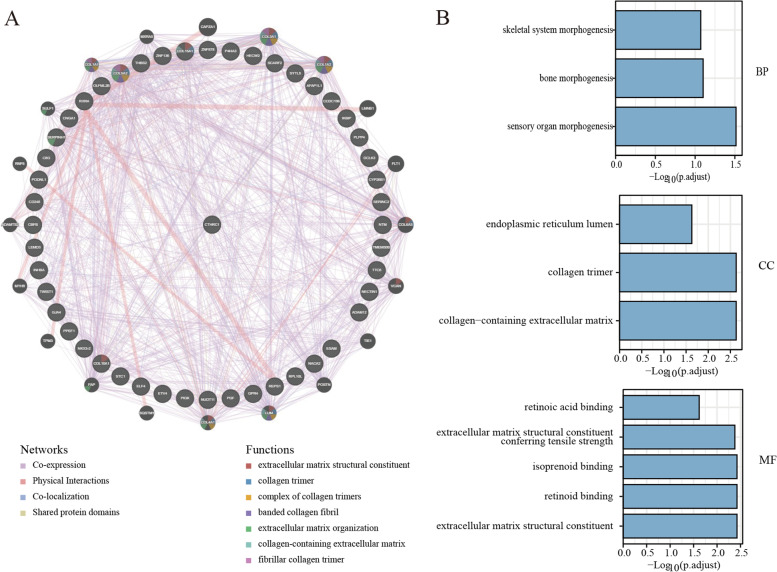
Gene alterations in CTHRC1 were found to occur in 6% of the 220 colorectal adenocarcinoma cases in the data obtained from the OncoPrint schematic of cBioPortal. The mutation rate of COAD was 4.56%. Meanwhile, missense mutations and amplification were the main alteration types in mucinous adenocarcinoma of the colon and rectum, rectal adenocarcinoma and colon adenocarcinoma (Fig. 4A, B). Figure 4C summarizes the details of all mutations: CTHRC1 has one truncation mutation and four missense mutations. In addition, we assessed the association of CTHRC1 gene alterations with survival in patients with colorectal adenocarcinoma. However, the OS and DFS were not associated with changes in the CTHRC1 gene in colorectal adenocarcinoma patients. We then constructed the protein-protein interactions network for CTHRC1 and the 50 altered neighboring genes by using GeneMANIA. The results showed that ELF4, PGF, IKBIP, SERPINH1, ESAM, COL15A1, THBS2, COL5A2, COL10A1, ADAM12, OLFML2B, GJA4, CD248, INHBA, PLPP4, HECW2, P4HA3, COL3A1, COL1A2, FLT1, COL6A3, VCNA, TIE1, LUM, COL4A1, FAP, MYH9, ADAMTS2, COL1A1, MXRA5, and SULF1 genes were closely related to CTHRC1 alterations (Fig. 5A). The functions of CTHRC1 and the genes significantly associated with CTHRC1 alterations were predicted by analyzing GO. GO enrichment analysis predicts the functional role of target host genes from three aspects: biological process, cell composition, and molecular function. The results showed that morphogenesis, collagen trimer, endoplasmic reticulum lumen, and other processes were controlled by changes in CTHRC1 (Fig. 5B) (Table 3). The GO enrichment analysis comprised three aspects: a biological process (BP), a molecular function (MF), and a cellular component (CC). The results showed that morphogenesis, collagen trimer, endoplasmic reticulum lumen, and other processes were significantly regulated by the CTHRC1 alterations (Fig. 5B) (Table 3).
Fig. 4.
CTHRC1 gene expression and mutation analysis in colorectal adenocarcinoma (cBioPortal). A The mutations in CTHRC1 in colorectal adenocarcinoma tissues were shown from top to bottom. B Frequency of gene alterations in CTHRC1 in different types of colorectal adenocarcinoma. C The details of all mutations in colorectal adenocarcinoma. D Kaplan–Meier Plots are used to analyze the correlation between gene alterations in CTHRC1 and DFS, as well as the OS E of colorectal adenocarcinoma patients
Fig. 5.
Gene regulation network. A The network for CTHRC1 and the 50 most frequently altered neighbor genes. B GO enrichment analysis predicted the functional roles of target host genes based on three aspects, including A biological processes, B cellular components, and C molecular functions
Table 3.
Results of GO analysis
| ONTOLOGY | ID | Description | GeneRatio | BgRatio | p value | p.adjust | q value |
|---|---|---|---|---|---|---|---|
| BP | GO:0090596 | Sensory organ morphogenesis | 6/44 | 256/18670 | 2.86e-05 | 0.031 | 0.026 |
| BP | GO:0060349 | Bone morphogenesis | 4/44 | 114/18670 | 1.48e-04 | 0.079 | 0.068 |
| BP | GO:0048705 | Skeletal system morphogenesis | 5/44 | 239/18670 | 2.38e-04 | 0.085 | 0.073 |
| CC | GO:0062023 | Collagen-containing extracellular matrix | 7/47 | 406/19717 | 4.61e-05 | 0.002 | 0.002 |
| CC | GO:0005581 | Collagen trimer | 4/47 | 87/19717 | 5.46e-05 | 0.002 | 0.002 |
| CC | GO:0005788 | Endoplasmic reticulum lumen | 5/47 | 309/19717 | 8.19e-04 | 0.023 | 0.019 |
| MF | GO:0005201 | Extracellular matrix structural constituent | 5/43 | 163/17697 | 4.52e-05 | 0.004 | 0.003 |
| MF | GO:0005501 | Retinoid binding | 3/43 | 35/17697 | 8.28e-05 | 0.004 | 0.003 |
| MF | GO:0019840 | Isoprenoid binding | 3/43 | 36/17697 | 9.02e-05 | 0.004 | 0.003 |
| MF | GO:0030020 | Extracellular matrix structural constituent conferring tensile strength | 3/43 | 41/17697 | 1.34e-04 | 0.004 | 0.003 |
| MF | GO:0001972 | Retinoic acid binding | 2/43 | 19/17697 | 9.61e-04 | 0.024 | 0.019 |
BP biological processes, CC cellular components, MF molecular functions
GSEA identifies signaling pathways associated with CTHRC1
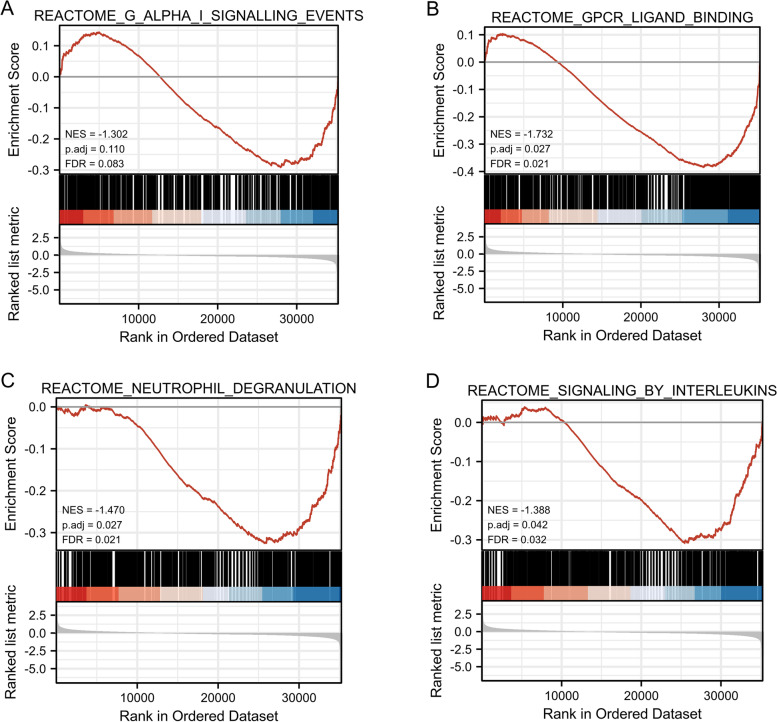
We acquired the CTHRC1 expression dataset from the TCGA-COAD data (480 patients with COAD and 41 normal tissues) for the GSEA analysis to identify different activated signaling pathways in COAD. Gene sets associated with Gα signaling, GPCR ligand binding, neutrophil degranulation, interleukin signaling, and tumor-associated pathways showed varying degrees of enrichment in the highly expressed phenotype of the CTHRC1 gene (Fig. 6) (Table 4).
Fig. 6.
Enrichment plots from GSEA. Gene set enrichment plots of A G Alpha I, B GPCR ligand binding, C neutrophil degranulation, D signaling by interleukins in COAD cases with high CTHRC1 expression. RNA sequence data from 480 patients with COAD and 41 normal tissues
Table 4.
Results of GSEA
| Description | setSize | Enrichment score | NES | p value | p.adjust | q values |
|---|---|---|---|---|---|---|
| REACTOME_G_ALPHA_I_SIGNALLING_EVENTS | 401 | 0.535 | 1.560 | 0.001 | 0.015 | 0.010 |
| REACTOME_GPCR_LIGAND_BINDING | 459 | 0.608 | 1.774 | 0.001 | 0.015 | 0.010 |
| REACTOME_NEUTROPHIL_DEGRANULATION | 474 | 0.547 | 1.600 | 0.001 | 0.015 | 0.010 |
| REACTOME_SIGNALING_BY_INTERLEUKINS | 458 | 0.543 | 1.586 | 0.001 | 0.015 | 0.010 |
| KEGG_PATHWAYS_IN_CANCER | 325 | 0.503 | 1.459 | 0.001 | 0.015 | 0.010 |
| NABA_SECRETED_FACTORS | 342 | 0.597 | 1.735 | 0.001 | 0.015 | 0.010 |
| REACTOME_CLASS_A_1_RHODOPSIN_LIKE_RECEPTORS_ | 327 | 0.643 | 1.867 | 0.001 | 0.015 | 0.010 |
| REACTOME_EXTRACELLULAR_MATRIX_ORGANIZATION | 300 | 0.713 | 2.068 | 0.001 | 0.015 | 0.010 |
| REACTOME_LEISHMANIA_INFECTION | 306 | 0.623 | 1.808 | 0.001 | 0.014 | 0.010 |
| WP_FOCAL_ADHESIONPI3KAKTMTORSIGNALING_PATHWAY | 303 | 0.590 | 1.711 | 0.001 | 0.014 | 0.010 |
NES normalized enrichment score
Relationship between CTHRC1 expression and immune checkpoint genes
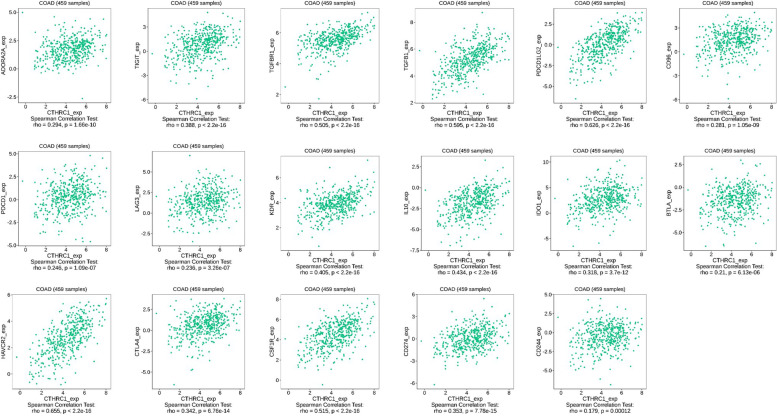
With increased awareness of immune checkpoint function in humans, immune checkpoint inhibitors have made great progress in cancer treatment. We assessed whether the expression of CTHRC1 was associated with immune checkpoint genes. We used the TISIDB database to study the relationship between CTHRC1 expression and immunosuppressive effects. The results showed that CTHRC1 was associated with ADORA2A, TIGT, TGFBR1, TGFB1, PDCD1LG2, CD96, PDCD1, LAG3, KDR, IL10, IDO1, BTLA, HAVCR2, CTLA4, CSF1R, CD274, and CD244 (Fig. 7).
Fig. 7.
Correlations of CTHRC1 expression and expression of different immune genes in COAD
Relationship between CTHRC1 expression and immune infiltration
In patients with cancer, the level of immune cells is closely related to the proliferation and development of cancer cells. Then, we used the TIMER database to explore the relationship between CTHRC1 expression and the degree of immune cell infiltration. CTHRC1 expression was positively correlated with CD4+T cell infiltration, CD8+T cell infiltration, macrophage infiltration, neutrophil infiltration, and dendritic cell infiltration, expect at the B cell level (Fig. 8). To further explore the relationship between CTHRC1 expression in COAD and immune cell invasion level, we identified the correlation between CTHRC1 expression and various immune invasion-associated biomarkers. Our results showed that CTHRC1 expression was significantly correlated with most B cells, T cells, CD8+T cells, macrophages, neutrophils, dendritic cells, and NK cell markers (Table 5).
Fig. 8.
Correlation of CTHRC1 expression with immune infiltration levels in COAD
Table 5.
Correlation analysis between CTHRC1 and relate genes and markers of immune cells in TIMER
| Description | Gen markers | COAD | |||
|---|---|---|---|---|---|
| None | Purity | ||||
| Cor | p | Cor | p | ||
| B cell | CD19 | 0.204084 | 1.07E-05 | 0.204084 | 1.07E-05 |
| CD79A | 0.285476 | 4.89E-10 | 0.285476 | 4.89E-10 | |
| T cell (general) | CD3D | 0.292765 | 1.67E-10 | 0.292765 | 1.67E-10 |
| CD3E | 0.367829 | 4.04E-16 | 0.367829 | 4.04E-16 | |
| CD2 | 0.383322 | 1.77E-17 | 0.383322 | 1.77E-17 | |
| CD8+T cell | CD8A | 0.346485 | 2.30E-14 | 0.346485 | 2.30E-14 |
| CD8B | 0.215771 | 3.16E-06 | 0.215771 | 3.16E-06 | |
| CD86 | 0.686509 | 4.24E-65 | 0.686509 | 4.24E-65 | |
| CSF1R | 0.585082 | 2.04E-43 | 0.585082 | 2.04E-43 | |
| TAM | CCL2 | 0.710411 | 1.42E-71 | 0.710411 | 1.42E-71 |
| CD68 | 0.467805 | 2.78E-26 | 0.467805 | 2.78E-26 | |
| IL10 | 0.512319 | 5.17E-32 | 0.512319 | 5.17E-32 | |
| M1 macrophage | IRF5 | 0.308985 | 1.37E-11 | 0.308985 | 1.37E-11 |
| PTGS2 | 0.289882 | 2.56E-10 | 0.289882 | 2.56E-10 | |
| NOS2 | -0.2026 | 1.25E-05 | -0.2026 | 1.25E-05 | |
| M2 macrophage | CD163 | 0.679957 | 1.97E-63 | 0.679957 | 1.97E-63 |
| VSIG4 | 0.658727 | 2.56E-58 | 0.658727 | 2.56E-58 | |
| MS4A4A | 0.662905 | 2.72E-59 | 0.662905 | 2.72E-59 | |
| Neutrophils | CEACAM8 | -0.18625 | 6.07E-05 | -0.18625 | 6.07E-05 |
| ITGAM | 0.670462 | 4.31E-61 | 0.670462 | 4.31E-61 | |
| CCR7 | 0.311286 | 9.52E-12 | 0.311286 | 9.52E-12 | |
| Natural killer cell | KIR2DL1 | 0.196671 | 2.25E-05 | 0.196671 | 2.25E-05 |
| KIR2DL3 | 0.160361 | 0.000571 | 0.160361 | 0.000571 | |
| KIR2DL4 | 0.19043 | 4.10E-05 | 0.19043 | 4.10E-05 | |
| KIR3DL1 | 0.225887 | 1.04E-06 | 0.225887 | 1.04E-06 | |
| KIR3DL2 | 0.207018 | 7.94E-06 | 0.207018 | 7.94E-06 | |
| KIR3DL3 | 0.052956 | 0.258054 | 0.052956 | 0.258054 | |
| KIR2DS4 | 0.168361 | 0.000296 | 0.168361 | 0.000296 | |
| Dendritic cell | HLA-DPB1 | 0.504539 | 5.98E-31 | 0.504539 | 5.98E-31 |
| HLA-DQB1 | 0.32912 | 4.95E-13 | 0.32912 | 4.95E-13 | |
| HLA-DRA | 0.507051 | 2.73E-31 | 0.507051 | 2.73E-31 | |
| HLA-DPA1 | 0.513432 | 3.63E-32 | 0.513432 | 3.63E-32 | |
Discussion
The incidence of COAD has increased dramatically in recent years, and the heterogeneity of colorectal cancer makes it difficult to determine which patients require further treatment after surgical resection and which have a poor prognosis. Diagnostic and prognostic tools for the early detection and prediction of patient survival are limited. Many studies have focused on this question, and there have been many advances in uncovering the underlying mechanisms by which cancer occurs. Therefore, finding reliable diagnostic markers for COAD is still an important research focus.
The results showed that CTHRC1 expression in COAD tissues was higher than that in normal tissues, and the difference was statistically significant. This finding is consistent with previous studies, which also found that CTHRC1 protein is highly expressed in various types of cancer, such as lung, stomach, cervical, and breast cancers. Our analysis further confirmed this finding because we found that CTHRC1 was significantly overexpressed in most of the tumors in the TCGA data. These results suggest that CTHRC1 may be a diagnostic marker of multiple cancers. In addition, we found that CTHRC1 was associated with the clinical staging and histological subtypes of COAD. Previous studies have reported that CTHRC1 promotes tumor cell progression by affecting specific pathways in different cancer types. For example, CTHRC1 is elevated in cervical cancer and promotes metastasis via the Wnt/PCP pathway [21]. In contrast, CTHRC1 regulates the aggressiveness of NSCLC through the GSK-3β/β-catenin pathway [22]. Current studies have found that CTHRC1 is an intrinsic marker of COAD metastasis, and further revealed that CTHRC1 promotes COAD liver metastasis through TGF-β signaling remodeling infiltrated macrophages [23]. This suggested that CTHRC1 expression may be a convenient diagnostic biomarker for a variety of tumors, including COAD. In addition, CTHRC1 is highly expressed in COAD and associated with poor prognosis. This result is consistent with previous findings that high CTHRC1 expression is associated with poor COAD survival [24].
Gene mutations have important implications, including altering genetic content, disrupting genes, and causing phenotypic differences. We found that the main type of CTHRC1 change was mRNA upregulation, and copy number variation was the most common type which may be the reason for the high expression of CTHRC1 in COAD. Changes in the chromosomal structure of the CTHRC1 gene can lead to abnormal expression and dysfunction. In the current study, gene mutations in CTHRC1 accounted for 6% of colorectal adenocarcinomas. The gene mutation of CTHRC1 in COAD was 4.65%, and the change frequency of CTHRC1 in mucinous adenocarcinoma of the colon and rectum was the highest, up to 13.04%. These results suggest that high CTHRC1 mutation may increase the carcinogenesis of COAD. According to the GO analysis, we found that the functional network of CTHRC1 in COAD is involved in morphogenesis, endoplasmic reticulum lumen, extracellular matrix structural components, and collagen trimers, suggesting that CTHRC1 plays a biological role in morphogenesis and cytoskeletal tumorigenesis. These findings suggest that CTHRC1 may regulate transcription to influence cell biological function.
In addition, it is important to understand how changes in proteins that regulate normal transcription are involved in cancers. It has been reported that genomic instability may lead to the transformation of normal cells into a carcinogenic state, and protein kinases and their related signaling pathways will help stabilize and repair genomic DNA [25]. To further investigate the role of CTHRC1 in COAD, we used TCGA data for GSEA. The results showed that the high expression of CTHRC1 was enriched in various pathways and key biological functions, and was related to the occurrence of tumors, such as Gα signaling, GPCR ligand binding, neutrophil degranulation, interleukin signaling, and tumor-associated pathways. The mechanism of Gα classical signaling is to inhibit the cAMP-dependent pathway by inhibiting adenylate cyclase. The reduced production of cAMP in ATP results in decreased cAMP-dependent protein kinase activity, and mutations in Gα subunits lead to specific cancers [26]. Additionally, many cancer cells abnormally express GPCRs, including those from lung, prostate, colon, pancreas, and mesenchymal cancer cells, which stimulate cell proliferation, migration, invasion, and angiogenesis [27]. Among members of the GPCR family, gonadotropin-releasing hormone receptor (GnRH) has been reported to be overexpressed in various tumor cells such as melanoma, prostate and endometrial cancer, leiomyoma, breast cancer, choriocarcinoma, epithelial ovarian tumor, and stromal ovarian tumor [28]. Therefore, the GnRH receptor is a reliable target for the clinical treatment of cancer [29]. The molecular basis of neutrophil degranulation is not fully understood, although the SNARE and Rab proteins seem to play a central role [30]. The presence of neutrophil components in cytoplasmic granules is involved in tumor metastasis and angiogenesis and may be considered a biomarker for tumor prognosis [31]. The tumor microenvironment is an increasingly popular topic that may influence tumor progression and recurrence. Studies have shown that immune cells in the TME have protumor or antitumor activity [32]. They are considered to be important determinants of clinical outcome and immunotherapy response. We observed that CTHRC1 expression was closely related to COAD immune infiltration. For example, CTHRC1 expression was significantly positively correlated with multiple immune cells and immune cell markers. It is suggested that CTHRC1 may reflect not only the prognosis of the disease but also the immune status of the body. In conclusion, these results underlie the ability of CTHRC1 to potentially regulate immune cell recruitment and activation in COAD.
The present study improves our understanding of the relationship between CTHRC1 and COAD, although some limitations still exist. First, all the data analyzed in this study were retrieved from online databases, and further studies consisting of in vitro and in vivo experiments are required to validate our findings. Second, most of the analyses in the present study were performed based on mRNA levels of CTHRC1. A deeper analysis, based on protein levels, would make the data more convincing.
Conclusion
This study systematically analyzed the relationship of CTHRC1 expression with COAD. The results showed that the expression of CTHRC1 is upregulated in COAD, and high CTHRC1 expression was correlated with clinical progression. In addition, Gα signaling, GPCR, neutrophil degranulation, and interleukin signal transduction may be the key pathways regulated by CTHRC1. The expression of CTHRC1 is closely related to the infiltration of various immune cells in COAD. Therefore, the biological function of CTHRC1 may play a vital role in the diagnosis and treatment of COAD.
Acknowledgements
Not applicable.
Abbreviations
- BMP
Bone morphogenetic proteins
- COAD
Colon adenocarcinoma
- CTHRC1
Collagen triple helix repeat containing 1
- DFS
Disease-free survival
- GSEA
Gene set enrichment analysis
- GO
Gene ontology
- TGF-β
Transforming growth factor-β
- TCGA
The Cancer Genome Atlas
Authors’ contributions
CM and JW study design and bioinformatics analysis. YZ researched literature. CM and DJJ critical revision of the manuscript. All authors contributed to manuscript revision, read, and approved the submitted version.
Funding
Not applicable.
Availability of data and materials
The data that support the findings of this study are openly available in TCGA database at https://portal.gdc.cancer.gov/.
Declarations
Ethics approval and consent to participate
Not applicable.
Consent for publication
Not applicable.
Competing interests
The authors declare that they have no competing interest.
Footnotes
Publisher’s Note
Springer Nature remains neutral with regard to jurisdictional claims in published maps and institutional affiliations.
References
- 1.Bray F, Ferlay J, Soerjomataram I, Siegel RL, Torre LA, Jemal A. Global cancer statistics 2018: GLOBOCAN estimates of incidence and mortality worldwide for 36 cancers in 185 countries. CA Cancer J Clin. 2018;68(6):394–424. doi: 10.3322/caac.21492. [DOI] [PubMed] [Google Scholar]
- 2.Arnold CN, Goel A, Blum HE, Boland CR. Molecular pathogenesis of colorectal cancer: implications for molecular diagnosis. Cancer. 2005;104(10):2035–2047. doi: 10.1002/cncr.21462. [DOI] [PubMed] [Google Scholar]
- 3.Vogel JD, Eskicioglu C, Weiser MR, Feingold DL, Steele SR. The American Society of Colon and Rectal Surgeons clinical practice guidelines for the treatment of colon cancer. Dis Colon Rectum. 2017;60(10):999–1017. doi: 10.1097/DCR.0000000000000926. [DOI] [PubMed] [Google Scholar]
- 4.Jones S, Chen WD, Parmigiani G, Diehl F, Beerenwinkel N, Antal T, et al. Comparative lesion sequencing provides insights into tumor evolution. Proc Natl Acad Sci U S A. 2008;105(11):4283–4288. doi: 10.1073/pnas.0712345105. [DOI] [PMC free article] [PubMed] [Google Scholar]
- 5.Jeffery M, Hickey BE, Hider PN. Follow-up strategies for patients treated for non-metastatic colorectal cancer. Cochrane Database Syst Rev. 2019;9:CD002200. doi: 10.1002/14651858.CD002200.pub4. [DOI] [PMC free article] [PubMed] [Google Scholar]
- 6.Zapater JL, Lednovich KR, Khan MW, Pusec CM, Layden BT. Hexokinase domain-containing protein-1 in metabolic diseases and beyond. Trends Endocrinol Metab. 2022;33(1):72–84. doi: 10.1016/j.tem.2021.10.006. [DOI] [PMC free article] [PubMed] [Google Scholar]
- 7.He W, Zhang H, Wang Y, Zhou Y, Luo Y, Cui Y, et al. CTHRC1 induces non-small cell lung cancer (NSCLC) invasion through upregulating MMP-7/MMP-9. BMC Cancer. 2018;18(1):400. doi: 10.1186/s12885-018-4317-6. [DOI] [PMC free article] [PubMed] [Google Scholar]
- 8.Li Y, Zhou J, Wang J, Chen X, Zhu Y, Chen Y. Mir-30b-3p affects the migration and invasion function of ovarian cancer cells by targeting the CTHRC1 gene. Biol Res. 2020;53(1):10. doi: 10.1186/s40659-020-00277-4. [DOI] [PMC free article] [PubMed] [Google Scholar]
- 9.Li J, Wang Y, Ma M, Jiang S, Zhang X, Zhang Y, et al. Autocrine CTHRC1 activates hepatic stellate cells and promotes liver fibrosis by activating TGF-beta signaling. EBioMedicine. 2019;40:43–55. doi: 10.1016/j.ebiom.2019.01.009. [DOI] [PMC free article] [PubMed] [Google Scholar]
- 10.Jiang N, Cui Y, Liu J, Zhu X, Wu H, Yang Z, et al. Multidimensional roles of collagen triple helix repeat containing 1 (CTHRC1) in malignant cancers. J Cancer. 2016;7(15):2213–2220. doi: 10.7150/jca.16539. [DOI] [PMC free article] [PubMed] [Google Scholar]
- 11.Ding X, Huang R, Zhong Y, Cui N, Wang Y, Weng J, et al. CTHRC1 promotes gastric cancer metastasis via HIF-1alpha/CXCR4 signaling pathway. Biomed Pharmacother. 2020;123:109742. doi: 10.1016/j.biopha.2019.109742. [DOI] [PubMed] [Google Scholar]
- 12.Vivian J, Rao AA, Nothaft FA, Ketchum C, Armstrong J, Novak A, et al. Toil enables reproducible, open source, big biomedical data analyses. Nat Biotechnol. 2017;35(4):314–316. doi: 10.1038/nbt.3772. [DOI] [PMC free article] [PubMed] [Google Scholar]
- 13.Rhodes DR, Kalyana-Sundaram S, Mahavisno V, Varambally R, Yu J, Briggs BB, et al. Oncomine 3.0: genes, pathways, and networks in a collection of 18,000 cancer gene expression profiles. Neoplasia. 2007;9(2):166–180. doi: 10.1593/neo.07112. [DOI] [PMC free article] [PubMed] [Google Scholar]
- 14.Chandrashekar DS, Bashel B, Balasubramanya SAH, Creighton CJ, Ponce-Rodriguez I, Chakravarthi B, et al. UALCAN: a portal for facilitating tumor subgroup gene expression and survival analyses. Neoplasia. 2017;19(8):649–658. doi: 10.1016/j.neo.2017.05.002. [DOI] [PMC free article] [PubMed] [Google Scholar]
- 15.Tang Z, Li C, Kang B, Gao G, Li C, Zhang Z. GEPIA: a web server for cancer and normal gene expression profiling and interactive analyses. Nucleic Acids Res. 2017;45(W1):W98–W102. doi: 10.1093/nar/gkx247. [DOI] [PMC free article] [PubMed] [Google Scholar]
- 16.Mizuno H, Kitada K, Nakai K, Sarai A. PrognoScan: a new database for meta-analysis of the prognostic value of genes. BMC Med Genet. 2009;2:18. doi: 10.1186/1755-8794-2-18. [DOI] [PMC free article] [PubMed] [Google Scholar]
- 17.Ru B, Wong CN, Tong Y, Zhong JY, Zhong SSW, Wu WC, et al. TISIDB: an integrated repository portal for tumor-immune system interactions. Bioinformatics. 2019;35(20):4200–4202. doi: 10.1093/bioinformatics/btz210. [DOI] [PubMed] [Google Scholar]
- 18.Li T, Fan J, Wang B, Traugh N, Chen Q, Liu JS, et al. TIMER: a web server for comprehensive analysis of tumor-infiltrating immune cells. Cancer Res. 2017;77(21):e108–ee10. doi: 10.1158/0008-5472.CAN-17-0307. [DOI] [PMC free article] [PubMed] [Google Scholar]
- 19.Gao J, Aksoy BA, Dogrusoz U, Dresdner G, Gross B, Sumer SO, et al. Integrative analysis of complex cancer genomics and clinical profiles using the cBioPortal. Sci Signal. 2013;6(269):pl1. doi: 10.1126/scisignal.2004088. [DOI] [PMC free article] [PubMed] [Google Scholar]
- 20.Mostafavi S, Ray D, Warde-Farley D, Grouios C, Morris Q. GeneMANIA: a real-time multiple association network integration algorithm for predicting gene function. Genome Biol. 2008;9 Suppl 1:S4. doi: 10.1186/gb-2008-9-s1-s4. [DOI] [PMC free article] [PubMed] [Google Scholar]
- 21.Zheng M, Zhou Q, Liu X, Wang C, Liu G. CTHRC1 overexpression promotes cervical carcinoma progression by activating the Wnt/PCP signaling pathway. Oncol Rep. 2019;41(3):1531–1538. doi: 10.3892/or.2019.6963. [DOI] [PMC free article] [PubMed] [Google Scholar]
- 22.Ke Z, He W, Lai Y, Guo X, Chen S, Li S, et al. Overexpression of collagen triple helix repeat containing 1 (CTHRC1) is associated with tumour aggressiveness and poor prognosis in human non-small cell lung cancer. Oncotarget. 2014;5(19):9410–9424. doi: 10.18632/oncotarget.2421. [DOI] [PMC free article] [PubMed] [Google Scholar]
- 23.Zhang XL, Hu LP, Yang Q, Qin WT, Wang X, Xu CJ, et al. CTHRC1 promotes liver metastasis by reshaping infiltrated macrophages through physical interactions with TGF-beta receptors in colorectal cancer. Oncogene. 2021;40(23):3959–3973. doi: 10.1038/s41388-021-01827-0. [DOI] [PubMed] [Google Scholar]
- 24.Tan F, Liu F, Liu H, Hu Y, Liu D, Li G. CTHRC1 is associated with peritoneal carcinomatosis in colorectal cancer: a new predictor for prognosis. Med Oncol. 2013;30(1):473. doi: 10.1007/s12032-013-0473-3. [DOI] [PubMed] [Google Scholar]
- 25.Alvarez-Quilon A, Terron-Bautista J, Delgado-Sainz I, Serrano-Benitez A, Romero-Granados R, Martinez-Garcia PM, et al. Endogenous topoisomerase II-mediated DNA breaks drive thymic cancer predisposition linked to ATM deficiency. Nat Commun. 2020;11(1):910. doi: 10.1038/s41467-020-14638-w. [DOI] [PMC free article] [PubMed] [Google Scholar]
- 26.Maziarz M, Federico A, Zhao J, Dujmusic L, Zhao Z, Monti S, et al. Naturally occurring hotspot cancer mutations in Galpha13 promote oncogenic signaling. J Biol Chem. 2020;295(49):16897–16904. doi: 10.1074/jbc.AC120.014698. [DOI] [PMC free article] [PubMed] [Google Scholar]
- 27.Nag JK, Rudina T, Maoz M, Grisaru-Granovsky S, Uziely B, Bar-Shavit R. Cancer driver G-protein coupled receptor (GPCR) induced beta-catenin nuclear localization: the transcriptional junction. Cancer Metastasis Rev. 2018;37(1):147–157. doi: 10.1007/s10555-017-9711-z. [DOI] [PubMed] [Google Scholar]
- 28.Freedland SJ, Abrahamsson PA. Androgen deprivation therapy and side effects: are GnRH antagonists safer? Asian J Androl. 2021;23(1):3–10. doi: 10.4103/aja.aja_22_20. [DOI] [PMC free article] [PubMed] [Google Scholar]
- 29.Abufaraj M, Iwata T, Kimura S, Haddad A, Al-Ani H, Abusubaih L, et al. Differential impact of gonadotropin-releasing hormone antagonist versus agonist on clinical safety and oncologic outcomes on patients with metastatic prostate cancer: a meta-analysis of randomized controlled trials. Eur Urol. 2021;79(1):44–53. doi: 10.1016/j.eururo.2020.06.002. [DOI] [PubMed] [Google Scholar]
- 30.Ramadass M, Johnson JL, Catz SD. Rab27a regulates GM-CSF-dependent priming of neutrophil exocytosis. J Leukoc Biol. 2017;101(3):693–702. doi: 10.1189/jlb.3AB0416-189RR. [DOI] [PMC free article] [PubMed] [Google Scholar]
- 31.Herrero-Turrion MJ, Calafat J, Janssen H, Fukuda M, Mollinedo F. Rab27a regulates exocytosis of tertiary and specific granules in human neutrophils. J Immunol. 2008;181(6):3793–3803. doi: 10.4049/jimmunol.181.6.3793. [DOI] [PubMed] [Google Scholar]
- 32.Zhu S, Yang N, Wu J, Wang X, Wang W, Liu YJ, et al. Tumor microenvironment-related dendritic cell deficiency: a target to enhance tumor immunotherapy. Pharmacol Res. 2020;159:104980. doi: 10.1016/j.phrs.2020.104980. [DOI] [PubMed] [Google Scholar]
Associated Data
This section collects any data citations, data availability statements, or supplementary materials included in this article.
Data Availability Statement
The data that support the findings of this study are openly available in TCGA database at https://portal.gdc.cancer.gov/.


