

A Message from France Mentré, Editor‐in‐Chief; Lena Friberg, Deputy Editor‐in‐Chief; Stacey Tannenbaum, Paolo Denti, and Colin Pillai, on behalf of the WCoP 2022 Organizing Committee
We are thrilled that we can share important and exciting pharmacometrics research from all across the globe from presentations at WCoP2022 – the hybrid conference on March 29 to April 1, 2022, in Cape Town, South Africa. CPT: Pharmacometrics & Systems Pharmacology (PSP) has already published conference abstracts submitted for the postponed 2020 meeting in a special supplement for those authors who preferred to not wait so long to share their research with the wider community. We hope that you found their research of interest, as we did, and that you’ll also find inspiration in the abstracts published herewith. Regardless of whether WCoP2022 was an in‐person or a virtual event for you, we hope that you will interact with all of these authors directly and expand the reach of pharmacometrics across the world.
119
Mechanistic modelling of maternal lymphoid and fetal plasma antiretroviral exposure during the third trimester
Babajide Shenkoya 1; Ibrahim Eniayewu1,2; Abdulafeez Akinloye1; Shakir Atoyebi3; Adeniyi Olagunju1,3
1Obafemi Awolowo University Ife‐Ife, Nigeria; 2University of Ilorin, Ilorin, Nigeria; 3University of Liverpool, Liverpool, UK
Background: Current knowledge of the extent of antiretroviral exposure in pregnant women's lymphoid and fetal compartments is limited due to their inaccessibility. The present study describes the pharmacokinetics of three ARVs in the maternal lymphoid and fetal plasma compartment during the third trimester using a validated materno‐fetal physiologically‐based pharmacokinetic (PBPK) model.
Methods: Maternal lymphatic and fetal compartments were integrated into our previously validated adult PBPK model using Simbiology® (MATLAB 2018b). Physiological and drug disposition processes were described using ordinary differential equations. For each drug, virtual pregnant women (n = 50 per simulation) received the standard dose during the third trimester. The model was qualified by comparison of predictions with published clinical data. Essential pharmacokinetic parameters, including Cmax, Cmin, and AUC (0‐24h) were computed in maternal lymph and fetal plasma at steady state.
Results: Model predictions were within 1.08 to 1.99 absolute average fold difference of published data. Maternal lymph concentrations 24 hours post‐dose exceeded the reported minimum effective concentration for efavirenz (11,514 vs. 800 ng/ml) and rilpivirine (118.8 vs. 50 ng/ml), but fetal plasma concentration was substantially higher for dolutegravir (927.4 vs. 300 ng/ml). In addition, predicted maternal lymph‐to‐plasma and fetal plasma‐to‐maternal plasma AUC ratios vary considerably between these drugs (Table).
Conclusion: This is an important new application of PBPK modeling to evaluate the adequacy of drug exposure in otherwise inaccessible compartments. Our model predictions align with recommendations of no dose adjustment despite moderate changes in exposure to these drugs during pregnancy.
TABLE Predicted Steady‐State Median (IQR) Maternal Plasma and Lymph Pharmacokinetic Parameters in the Third Trimester; and In‐Utero Fetal Plasma Pharmacokinetic Parameters of Efavirenz, Dolutegravir, And Rilpivirine
| Pharmacokinetic parameters | |||
|---|---|---|---|
| AUC (ng h/mL) | Cmax (ng/mL) | C24 (ng/mL) | |
| Efavirenz 600 mg (n = 50) | |||
| Maternal Plasma | 58120 (41149–78030) | 3270 (2478–4035) | 1724 (1132–2547) |
| Maternal Lymph | 373790 (264477–502688) | 19470 (14560–24579) | 11514 (7666–16852) |
| Lymph‐to‐plasma AUC ratio | 6.431 | ||
| Fetal Plasma | 34404 (24236–46364) | 1689 (1235–2170) | 1123 (758.4–1630) |
| Fetal‐to‐plasma AUC ratio | 0.5919 | ||
| Dolutegravir 50 mg (n = 50) | |||
| Maternal Plasma | 41166 (36660–48827) | 2899 (2707–3259) | 1035 (865.3–1313) |
| Maternal Lymph | 643.7 (571.7–759.9) | 39.26 (35.74–44.01) | 16.96 (14.29–21.49) |
| Lymph‐to‐plasma AUC ratio | 0.0156 | ||
| Fetal Plasma | 32152 (28905–38541) | 1742 (1620–2007) | 927.4 (784.7–1170) |
| Fetal‐to‐plasma AUC ratio | 0.781 | ||
| Rilpivirine 25 mg (n = 50) | |||
| Maternal Plasma | 2205 (1649–2674) | 121.8 (96.71–141.4) | 66.91 (45.01–85.67) |
| Maternal Lymph | 3788 (2841–4592) | 195.1 (151.8–227.8) | 118.8 (81.43–151.4) |
| Lymph‐to‐plasma AUC ratio | 1.717 | ||
| Fetal Plasma | 1263 (888.5–1591) | 61.66 (45.46–76.0) | 41.26 (26.83–54.11) |
| Fetal‐to‐plasma AUC ratio | 0.573 | ||
120
Nonlinear mixed effects modeling of glucagon kinetics in healthy subjects
Edoardo Faggionato 1; Marcello Laurenti2; Adrian Vella2; Chiara Dalla Man1
1University of Padova, Padova, Italy; 2Mayo Clinic College of Medicine, Rochester, MN, USA
Background: Impaired glucagon suppression and defective insulin secretion contribute to the onset of diabetes. However, compared to insulin, glucagon is understudied, in part because of the absence of a kinetic model necessary to estimate its secretion. Recently, we proposed a compartmental model of glucagon kinetics1, and predicted its distribution volume (Vd) and clearance (CL) from patient anthropometric characteristics using linear regression. The aim is thus to use nonlinear mixed effects modeling to develop a robust population model of glucagon kinetics.
Methods: A total of 51 healthy subjects (age = 54±13 yr, BMI = 28±4 kg/m2) received somatostatin to inhibit endogenous hormone secretion and a glucagon infusion of 0.65 ng/kg/min. The study was approved by Mayo Clinic Institutional Review Board. The published kinetic model was coupled with 10 models of parameter variability, including covariate effects. The best model was selected based on residual distribution, precision of estimates, and parsimony criteria.
Results: The best model employs BMI to predict Vd and BSA to predict CL. A visual predictive check is shown in the figure.

FIGURE Visual predictive check obtained with the developed model. Ninety‐percent prediction intervals of the 10th (blue lower area), 50th (red central area), and 90th (blue upper area) percentiles are compared with the 10th (upper blue solid line), 50th (red central solid line), and 90th (lower blue solid line) empirical percentiles
Conclusion: The developed model is usable for the estimation of glucagon secretion by deconvolution enabling a better understanding of the contribution of glucagon secretion to the pathogenesis of diabetes.
REFERENCE
Laurenti, M.C., et al. Assessment of individual and standardized glucagon kinetics in healthy humans. Am. J. Physiol. Endocrinol. Metab. 320, E71‐E77 (2021).
122
Population pharmacokinetics modeling of tusamitamab ravtansine, a DM4 anti‐CEACAM5 antibody‐drug conjugate
Clémence Pouzin 1,2; Michel Tod2; Nathalie Fagniez1; Laurent Ngyuen1; Leonid Gibiansky3; Mustapha Chadjaa4
1Sanofi, Pharmacokinetics Dynamics and Metabolism Department, Chilly‐Mazarin, France; 2University of Claude Bernard Lyon 1, Oncology Department EMR3738, PKPD Modelling Unit, Lyon, France; 3QuantPharm LLC, North Potomac, North Potomac, MD, USA; 4Sanofi, Clinical Research, Vitry‐sur‐seine, France
Background: Tusamitamab ravtansine (SAR408701) is an anti‐CEACAM5 drug conjugate composed of DM4 (a potent maytansine derivative) currently tested in phase I/II clinical trials in patients with advanced solid tumors (https://clinicaltrials.gov/ct2/show/NCT02187848). The objective of the present analysis was to develop a semi‐mechanistic population pharmacokinetics (PK) model that describes plasma concentrations of SAR408701 (conjugated antibody), naked antibody (NAB), DM4 and Methyl‐DM4 (active metabolites) including drug to antibody ratio (DAR) measurements, to assess impact of clinically relevant covariates.
Methods: Data from 254 patients were included in the analysis (study approved by Medical Ethics Committee). To characterize PK of SAR408701 and NAB, species from DAR0 to DAR8 were explicitly represented with two‐compartment PK models. DM4 and MeDM4 were described successively by one compartment PK models. Demographic and pathophysiologic covariates were explored with a sequential approach, avoiding interference between covariates effect on SAR408701 and its catabolites. Simulations were performed to assess covariates influence on each entity exposure and evaluate potential flat dosing impact.
Results: Model parameters were estimated with good precision. Five covariates were included in final PK model: body surface area (BSA), tumor burden, albumin, circulating CEA, and gender. Impact was limited on exposure considering the high overall population variability. Flat dosing comparison supported the current BSA adjusted dosing regimen.
Conclusion: By integrating mechanistic considerations, this model aimed to improve understanding of SAR408701 complex disposition and deconjugation processes to support drug clinical development.
126
A modern curriculum for training scientists in model‐informed drug development (MIDD): initial proposal developed in support of FDA grant to train regulatory scientists
Jeff Barrett 1; Klaus Romero1; Jagdeep Podichetty1; Sakshi Sardar1; Craig Rayner2; Amy Cheung2; Rajesh Krishna2; Adekemi Taylor2; Marc Gastonguay3; Colin Pillai4; Stacey Tannenbaum5; Steve Kern6; Mark Selich1; Issam Zinneh7
1Critical Path Institute, Tucson, AZ, USA; 2Certara, Princeton, NJ, USA; 3Metrum Research Group, Tariffville, CT, USA; 4CP+ Associates GmbH, Binningen, Switzerland; 5Astellas Pharma, Northbrook, IL, USA; 6Bill and Melinda Gates Foundation, Seattle, WA, USA; 7US Food and Drug Administration, Baltimore, MD, USA
Background: To fulfil requirements of the 21st Century Cures Act and the sixth iteration of the Prescription Drug User Fee Act, the US FDA supported development of a Model Informed Drug Development (MIDD) training course for the non‐modeling audience.
Methods: Under FDA grant (2U18FD005320‐06), the Critical Path Institute (C‐Path) and experienced private sector partners including representatives from Certara, Metrum, the Gates Foundation, and Astellas Pharmaceuticals collaborated to create didactic video materials in an e‐learning format on MIDD topics relevant to a non‐modeling audience. Additional pharmaceutical companies (Sanofi, Genentech/Roche, AstraZeneca) contributed materials illustrating the application of the MIDD approach in practice.
Results: Training videos were created and divided into several modules introducing the MIDD landscape for drug development and regulatory science, a review of various model types used for MIDD, discussions of how models inform drug development and regulatory decisions, future goals of MIDD including Digital Health, AI/ML, and RWD/RWE and discussions on the interconnectedness of models used for MIDD. Additionally, examples and vignettes from stakeholders and thought leaders are included.
Conclusion: These educational materials fill a gap between university and ‘on the job’ training for regulators and industry scientists, delivering insights and value for those performing modeling and non‐modelers reviewing the output of modeling and simulation work. Enhancements and additions to these educational materials should be supported to maximize utility for the non‐modeling audience and continue to advance understanding of the MIDD discipline. We will be demonstrating the access and content of the learning management system (LMS) that contains the training materials at the meeting.
127
Deep compartment models: combining machine learning and differential equations for reliable drug concentration predictions
Alexander Janssen 1; Frank Leebeek2; Marjon Cnossen2; Ron Mathôt1
1Amsterdam UMC, Amsterdam, The Netherlands; 2Erasmus UMC, Rotterdam, The Netherlands
Background: Several studies have evaluated the use of machine learning methods in the field of pharmacometrics. A remaining issue is that most models cannot reliably extrapolate to different treatment schedules or time points outside of the training data. Here, we present the Deep Compartment Model (DCM), a combination of neural networks and ordinary differential equations (ODEs). Instead of predicting single drug concentrations, the DCM learns a continuous solution based on a dosing regimen. We will test its accuracy on simulated datasets of Haemophilia A patients receiving coagulation factor VIII (FVIII) prophylaxis and present a direct comparison to a non‐linear mixed effects model (NLME) using complex real world perioperative data.
Methods: We simulated 500 FVIII activity profiles based on a prior NLME model. A DCM was trained on 20, 60, or 120 patients, and accuracy was determined for the remaining patients. Multiple measurement sets were collected to simulate extensive (t = 0.5, 4, 12, 24, 36, 48), routine (t = 4, 24, 48), limited (t = 8, 30), and extremely limited (t = 24) sampling. Next, we fit both a DCM and a previous NLME model to data from 110 patients receiving FVIII perioperatively. We then compared their accuracy on an independent validation dataset of 62 patients. Model accuracy was defined as the %‐age of predictions within 0.05 IU/mL of FVIII levels ≥ 0.15 and within 0.02 IU/mL of levels < 0.15.
Results: We see that the DCM achieves high accuracy (>80%) for the simulated datasets with at least 60 patients and two samples per patient. With more than two samples, high accuracy is also achieved using data from only 20 patients. The DCM outperformed the NLME model in accuracy on the perioperative dataset (23.1% vs. 21.8%).
Conclusion: The above results indicate that the DCM is accurate and allows for reliable extrapolation to different time points and dosing regimens.
128
Population pharmacokinetic modeling of intravenous immunoglobulin in patients with immune system disorders
Shamin Mohd Saffian1; Jian Lynn Lee1,2; Makmor‐Bakry Mohd1; Farida Islahudin1; Noraida Mohamed Shah1
1Universiti Kebangsaan Malaysia, Kuala Lumpur, Malaysia; 2Department of Pharmacy, Tengku Ampuan Rahimah Hospital, Selangor Darul Ehsan, Malaysia
Background: Immunoglobulin G (IgG) is commonly used to replace endogenous gamma‐globulins in patients with primary immunodeficiency (PID). It is also used in several other auto‐immune and inflammatory conditions where the pharmacokinetics are not well characterized. This study aims to estimate the population pharmacokinetic (popPK) parameters of IgG and to investigate the impact of genetic polymorphism of the FcRn gene and variability on the pharmacokinetic of IgG in patients with immune system disorders.
Methods: Patients were recruited from four hospitals in Malaysia. Clinical data were recorded, and blood samples were taken for pharmacokinetic and genetic studies. PopPK parameters were estimated by nonlinear mixed‐effects modeling in Monolix®. Age, weight, baseline IgG concentration, ethnicity, sex, genotype, disease type, and co‐morbidity were investigated as potential covariates. Models were evaluated using the difference in objective function value, goodness‐of‐fit plots, visual predictive checks, and bootstrap analysis.
Results: A total of 292 blood samples were analyzed from 79 patients. The IgG concentrations were best described by a two‐compartment model with linear elimination. Weight was found to be an important covariate for Vc, Vp, and CL, whereas disease type was found to be an important covariate for Vp. Goodness‐of‐fit plots indicated that the model fit the data adequately. Genetic polymorphism of the FcRn gene did not affect the pharmacokinetics of IVIG.
Conclusion: This study supports the use of dosage based on body weight as per current practice. The influence of disease type on the Vp of IVIG highlighted the difference in mechanism of action of IVIG across disease type and it could be associated by the degree of inflammation that is present in the body.
131
A machine learning‐based approach to cancer classification using RNA‐SEQ data
Linda Chaba1; Bernard Omolo2
1Strathmore University, Nairobi, Kenya; 2University of South Carolina‐Upstate, Spartanburg, SC, USA
Background: In the recent past, machine‐learning approaches have gained a lot of attention in the biomedical field mainly for biological classification. A number of researchers are currently applying these methods to the RNA‐Seq data. RNA‐Seq technology typically generates a huge amount of data, making the search for useful genes in any given study a daunting task. Differentially expressed gene list usually yields a large list of genes even after adjusting for multiple testing. This can make subsequent studies quite cumbersome and extensive. In this study, we focus on the evaluation of four (4) supervised machine learning approaches exclusively to classify colorectal cancer samples into two clinical endpoints: cancer stages and microsatellite instability (MSI) status using RNA‐Seq data.
Methods: Publicly available colorectal cancer RNA‐Seq dataset and clinical data was downloaded from the TCGA database. Data sets containing 327 samples with normal tissues (41) and tumor samples (286) were extracted each with read counts from 14,899 probes. Only samples with complete information on cancer stage and MSI status were used in the analysis. All the datasets were downloaded with TCGABiolinks R/Bioconductor package. Data were filtered using counts per million (CPM) approach. Identification of DE genes was done using Deseq2 R package. False discovery rate (FDR) was used to select deferentially expressed genes. The data were split into training (70%) and test sets (30%). Model building processes were performed on training datasets, and model performances are evaluated in test sets. Machine learning algorithms were implemented by use of MLSeq package in R. The models were trained using 2‐fold cross‐validation repeated twice for cancer stage data and a 10‐fold cross‐validation repeated 50 times for MSI status data. Fitted models were compared using accuracy, area under the curve (AUC), and F‐Measure (F1 Score).
Results: In terms of FI score and AUC, Support Vector Machine (SVM) was the best performing algorithm; while in terms of accuracy, SVM was the best in the analysis of MSI status but was equally good as the Negative binomial linear discriminant analysis (NBLDA) in the analysis of the cancer stage data.
Conclusion: Numerical comparisons show that the Support Vector Machine (SVM) can be a better choice of a classification method for cancer patients using RNA‐Seq data.
133
Predicting cytokine changes during sepsis; a pharmacometric analysis from a porcine sepsis model with Escherichia coli
Salma Bahnasawy1; Paul Skorup2; Katja Hanslin3; Miklós Lipcsey4; Lena E. Friberg1; Elisabet I. Nielsen1
1Pharmacometrics Research Group, Department of Pharmacy, Uppsala University, Uppsala, Sweden; 2Section of Infectious Diseases, Department of Medical Sciences, Uppsala University, Uppsala, Sweden; 3Anesthesiology and Intensive Care, Department of Surgical Sciences, Uppsala University, Uppsala, Sweden; 4Hedenstierna laboratory, Anesthesiology & Intensive Care, Department of Surgical Sciences, Uppsala University, Uppsala, Sweden
Background: Recently, a pharmacometric model was developed from a porcine endotoxemia model. It describes the host response to endotoxin (ETX), a Gram‐negative bacteria outer membrane component, through characterizing the kinetics of TNF‐α and IL‐6.1 The current analysis aimed to expand this model to describe bacterial ETX release and to explore potential differences in the host response when exposed to E. coli bacteria.
Methods: The data arose from a porcine sepsis model where the animals received a 3‐hour infusion of live E. coli with a total dose of 5 × 10⁸ CFU. The previous model was extended to describe the E. coli ‐ETX relationship. Model development considered sequential modeling of different dependent variables (DV); blood bacterial count, ETX, TNF‐α, and IL‐6. The previously quantified ETX‐ cytokine interrelationships were fitted to the present data without parameter re‐estimation to test the need for modification upon live E. coli exposure.
Results: The analysis included 30 animals and the final model consisted of 11 compartments describing the four DVs. The blood bacterial count was well described by a one‐compartment model with linear elimination (Cl = 152 L/h, V = 7.41 L). A scaling factor was estimated to quantify the ETX release by bacteria (0.000075 EU/CFU). The original model described the profiles of TNF‐α, and IL‐6 adequately without a need for modifying the ETX‐cytokines interrelationship. Individual plots and VPCs showed an overall good model fit.
Conclusions: The previously developed model was extended to describe bacterial ETX release in vivo. The results suggest that the model can adequately describe the time‐course of cytokine changes triggered by E. coli exposure. The proposed model could be a starting point for future translational research on the immune response in sepsis.
REFERENCE
1. Thorsted, A., et al. A non‐linear mixed effect model for innate immune response: In vivo kinetics of endotoxin and its induction of the cytokines tumor necrosis factor alpha and interleukin‐6. PLOS ONE, 21, e0211981 (2019).
134
Population pharmacokinetics of CAR‐T therapy in adult patients with recurrent or refractory CD19 positive aggressive non‐Hodgkin's lymphoma
Lei Song1; Jiyuan Wang1; Yue Huang1; Wei Huang1; Ting He2; Xin‐an Lu2; Fei Wu2; Jia‐hui Tian2; Yu‐wei Hou2; Yong‐chao Fu3; Zi‐ran Li4; Zheng Jiao5
1Shanghai SimnovaBio, Shanghai, China; 2Beijing Immunochina Pharmaceutical, Beijing, China; 3Tri‐Biotech (Shanghai), Shanghai, China; 4Huashan Hospital, Fudan University, Shanghai, China; 5Shanghai Chest Hospital, Shanghai Jiao Tong University, Shanghai, China
Background: Chimeric antigen receptor T cell (CAR‐T) therapy has shown great efficacy in blood cancers including hematologic malignancies like non‐Hodgkin's lymphoma (NHL). Meanwhile, the pharmacokinetic (PK) characteristics differ from those of traditional large/small molecule drug (L/SMD) due to large between‐subject variabilities and cell‐based proliferation or differentiation activity. This study aims to conduct a population pharmacokinetic (popPK) analysis of a CAR‐T therapy (IM‐19) in adult patients with recurrent or refractory CD19 positive aggressive non‐Hodgkin's lymphoma (NHL) to inform the dosing strategy.
Methods: Data from two single dose ascending clinical pharmacokinetic studies were collected and analyzed. Different dose amount of IM‐19 CAR‐Ts (5*105, 1*106, and 3*106 per kg body weight) were intravenously administrated to the subjects. Both studies were approved by the local Ethics Committee Board. Nonlinear mixed effect modelling software, Monolix, was employed to perform the popPK analysis. Stepwise forward inclusion and backward elimination were used to screen the potential covariates.
Results: A total of 234 observations from 31 subjects were included in the analysis. The cell kinetic model (Figure) better fits the PK profile of IM19‐CART compared to the one or two compartment model. Dose amount of IM19‐CART cell influenced proportion of CAR‐T memorial cell elimination rate. Additionally, cell preparation process and baseline level of sum of the products of diameter were found to significantly affect both Cmax and Tmax. Weight was not identified as a significant covariate.
Conclusions: The PK profile of IM19‐CART could be adequately described by the cell kinetic model. Weight‐based dosing strategy might not be necessary.

FIGURE Graphical representation of the cellular kinetic models. The PK characteristics differ from those of traditional L/SMD due to large between‐subject variability and cell‐based proliferation/differentiation activity. Tisagenlecleucel following expansion at a rate (ρ) up to time to Tmax, followed by a biphasic contraction at rates α and β
REFERENCE
1. Stein A.M., et al. Tisagenlecleucel Model‐Based Cellular Kinetic Analysis of Chimeric Antigen Receptor–T Cells. CPT Pharmacometrics Syst. Pharmacol. 8, 285‐295 (2019).
136
Modeling viral load of SARS‐COV‐2 in hospitalized patients infected by COVID‐19
Guillaume Lingas; Nadège Néant; France Mentré; Jérémie Guedj
Université de Paris, IAME, INSERM, Paris, France
Background: SARS‐COV‐2 is the virus responsible for the COVID‐19 pandemic and little was known about its intra‐host dynamics in infected hospitalized patients.
Methods: In France, we launched two prospective clinical studies in hospitalized patients infected by COVID‐19 in which we measured longitudinal nasopharyngal viral load by PCR. The French COVID cohort1, is an observational study. We developed a viral dynamic model in the first 655 included patients and studied the link with mortality using joint modeling. In the DisCoVeRy randomized clinical trial2,3 in hospitalized patients, we evaluated four repurposed antiviral treatments: hydroxychloroquine, lopinavir, lopinavir + interferon, and remdesivir versus standard of care. We modeled the evolution of viral load and estimated the effectiveness of the treatment.
Results: In the French Covid cohort1, we found that patients with age ≥ 65 years had a smaller loss rate of infected cells, leading to a delayed median time to viral clearance occurring 16 days after symptom onset as compared to 13 days in younger patients (P < 10−4). In multivariate analysis, the risk factors associated with mortality were age ≥65 years, male gender, and presence of chronic pulmonary disease (hazard ratio [HR] > 2.0). Using a joint model, viral dynamics after hospital admission was an independent predictor of mortality (HR = 1.31, P < 10−3). In the DisCoVeRy trial, no effect of any of the drugs was found on clinical endpoints nor on viral load decrease when analyzed using standard linear mixed effects models on log viral load. Viral load modeling allowed more insight on the effectiveness of the drugs and of various covariates. However, most patients were hospitalized more than a week after symptom onset, limiting the efficacy of antivirals.4
Conclusion: Viral load and joint modelling are useful tools to understand the evolution of viral load in COVID‐19 hospitalized patients.
REFERENCES
Néant, N., et al. Modeling SARS‐CoV‐2 viral kinetics and association with mortality in hospitalized patients from the French COVID cohort. Proc. Natl. Acad. Sci. USA. 118, e2017962118 (2021).
Ader, F., et al. An open‐label randomized controlled trial of the effect of lopinavir/ritonavir, lopinavir/ritonavir plus IFN‐β‐1a and hydroxychloroquine in hospitalized patients with COVID‐19. Clin. Microbiol. Infect. 27, 1826‐1837 (2021). doi: 10.1016/j.cmi.2021.05.020.
Ader, F., et al. Remdesivir plus standard of care versus standard of care alone for the treatment of patients admitted to hospital with COVID‐19 (DisCoVeRy): a phase 3, randomised, controlled, open‐label trial. Lancet Infect. Dis. 22, P209‐221 (2022). doi: 10.1016/S1473‐3099(21)00485‐0.
Gonçalves, A., et al. Timing of Antiviral Treatment Initiation is Critical to Reduce SARS‐CoV‐2 Viral Load. CPT Pharmacometrics Syst. Pharmacol. 9, 509‐514 (2020).
138
Bootstrap bioequivalence – an alternative approach for pilot BA/BE studies
Sara Carolina Henriques; Nuno Elvas Silva
Faculty of Pharmacy, University of Lisbon, Lisbon, Portugal
Background: The analysis and interpretation of results of pilot bioavailability (BA)/bioequivalence (BE) studies usually rely on the application of the average bioequivalence approach. The aim of this work is to propose a bootstrap methodology for bioequivalence analysis as an alternative approach to overcome and reduce the uncertainty on the conclusions of these downsized studies.
Methods: BA/BE pilot studies were simulated based on a one‐compartment model, accounting different sample sizes, combining different inter‐individual (IIV) and/or inter‐occasion (IOV) variability levels for the pharmacokinetic parameters, and considering no difference or a difference between Test and Reference on the mean absorption rate constant (ka). Each simulated trial was analyzed using the average bioequivalence and bootstrap bioequivalence approaches. The relationship between type I and type II errors was studied, allowing us to determine the performance of each evaluation method.
Results: Bootstrap bioequivalence analysis showed a higher power than the standard parametric approach. The bootstrap methodology could maintain a power of at least 80%, with fewer than 16 subjects, in studies with high IOV (30%), while the average bioequivalence approach required at least 80 subjects to maintain this power.
Conclusion: For pilot studies, the bootstrap method was proved to be more accurate than the average bioequivalence methodology. Moreover, the bootstrap approach requires a lower sample size to reach power 80%, which makes it a better approach to reduce the uncertainty in the conclusions derived from pilot studies.
139
Amikacin dose optimization in the emergency department: one dose does fit all? A population pharmacokinetic simulation study
Nada Dia 1; Sabrina De Winter2; Omar Elkayal1; Peter Vanbrabant3; Willy Peetermans3; Isabel Spriet1,2; Erwin Dreesen1
1Department of Pharmaceutical and Pharmacological Sciences, KU Leuven, Leuven, Belgium; 2Pharmacy Department, University Hospitals Leuven, Leuven, Belgium; 3Department of Internal Medicine, University Hospitals Leuven, Leuven, Belgium

FIGURE
Background: Attainment of the 64 mg/L amikacin peak concentration (Cpeak) target following a single standard dose (SD) of 15 mg/kg in adults with sepsis admitted to the emergency department is poor.1 A SD of 25 mg/kg (capped to 2000 mg at body weight [BW] > 80 kg) was suggested to achieve TA.1 This study aims to identify an amikacin dose with improved Cpeak TA and acceptable trough concentration (Ctrough) TA.
Methods: A published population PK model was used for simulating various dosing scenarios (Figure).1 All covariates except body mass index were fixed to median values in the virtual patient dataset (N = 2004; range = 35‐168 kg). A total of 1,000 simulations was performed using NONMEM v7.5. Cpeak TA and Ctrough TA were evaluated 1 and 24 hour(s) after the start of the infusion. The cut‐offs were >90% and >10% considering Cpeak ≥ 64 mg/L and Ctrough ≤ 3 mg/L, respectively.
Results: SD of 15 mg/kg and 25 mg/kg capped to 2,000 mg (at BW > 80 kg) did not reach the desired 90% TA at BWs below 113 and 60 kg, respectively (Figure). A flat dose of 2,000 mg over the complete BW range is favored over weight‐adjusted dosing. Probability of Ctrough TA decreased with a higher amount of medication & lower BW.
Conclusion: A single flat dose of 2,000 mg amikacin may be advised for prospective evaluation in a clinical study.
REFERENCE
De Winter, S. et al. Quantification and Explanation of the Variability of First‐Dose Amikacin Concentrations in Critically Ill Patients Admitted to the Emergency Department: A Population Pharmacokinetic Analysis. Eur. J. Drug Metab. Pharmacokinet. 46, 653‐663 (2021).
140
A model‐based analysis of bedaquiline‐related QTcF prolongation in the PROBeX study
Mr. Stijn van Beek 1; James Brust2; Lénaïg Tanneau3; Gary Maartens4,5; Elin Svensson1,3
1Department of Pharmacy, Radboud Institute for Health Sciences, Radboud University Medical Center, Nijmegen, the Netherlands; 2Divisions of General Internal Medicine and Infectious Diseases, Albert Einstein College of Medicine, Bronx, NY, USA; 3Department of Pharmacy, Uppsala University, Uppsala, Sweden; 4Wellcome Centre for Infectious Diseases Research in Africa, Institute of Infectious Disease and Molecular Medicine, University of Cape Town, Cape Town, South Africa; 5Division of Clinical Pharmacology, Department of Medicine, University of Cape Town, Cape Town, South Africa
Background: The World Health Organization recommends a treatment regimen including bedaquiline (BDQ) for patients with rifampicin‐resistant tuberculosis. The M2 metabolite of BDQ has been associated with QT prolongation. The objective of this study was to determine the relationship between M2 pharmacokinetics (PK) and QT prolongation in the PROBeX study.
Methods: Plasma PK, QTcF (Fridericia’s corrected QT) and demographic data were obtained from the PROBeX study ‐ an observational cohort study of South African patients with rifampicin‐resistant tuberculosis. The plasma PK data were fitted using a previously established model with maximum a posteriori estimation. For the QT model, we used informative priors from a model describing the Emax relationship between M2 and QTcF prolongation.1 The QT model accounted for the effects of circadian rhythm, time on treatment, concurrent clofazimine or moxifloxacin, age, sex, race, calcium, and potassium on the QTcF baseline interval. ECGs were performed in triplicate before the start of treatment and at months 1, 2, and 6 after starting treatment.
Results: In total, 170 participants provided 1,131 plasma PK and 1,702 QTcF measurements. The plasma PK model described the data well. The estimated parameters of the QTcF model were similar to that of the original model. The baseline QTcF was estimated at 400 ms, the concentration of M2 at which 50% QT‐prolonging effect on QTcF time is reached at 844 ng/mL and the maximum effect of M2 on QTcF time at 28.5 ms.
Conclusion: This work describes the BDQ‐associated QT prolongation in the PROBeX study and shows a similar effect as previously described. Simulations using this model will be used to inform a suitable ECG monitoring strategy to identify patients at risk due to QT prolongation during BDQ treatment.
REFERENCE
1. Tanneau, L., Svensson, E.M., Rossenu, S., & Karlsson, M.O. Exposure‐safety analysis of QTc interval and transaminase levels following bedaquiline administration in patients with drug‐resistant tuberculosis. CPT Pharmacometrics Syst. Pharmacol. 10, 1538‐1549 (2021).
146
Conditional non‐parametric bootstrap for non‐linear mixed effect models
Emmanuelle Comets 1,2; Sofia Kaisaridi1; Moreno Ursino3
1Inserm IAME UMR 1137, Université de Paris, Paris, France; 2CIC 1414, Université Rennes, Rennes, France; 3Centre de Recherche des Cordeliers, Sorbonne Université; Inserm, Université de Paris, Paris, France
Background: Uncertainty in non‐linear mixed effect models (NLMEM) is often assessed using the Fisher information matrix to derive the standard errors of estimation (SE). The bootstrap is an alternative approach to the asymptotic method, with different approaches proposed in NLMEM to handle the different levels of variability involved at the individual and population level.1 Here, we propose and evaluate a new non‐parametric bootstrap to estimate uncertainty in NLMEM.
Methods: We implemented four bootstraps in the R package saemix: case, resampling individuals, parametric (Par), sampling from a distribution, non‐parametric (NP), resampling estimated residuals, and conditional non‐parametric (cNP), based on resamples from the conditional distribution of the individual parameters. Coverage rates were compared in a simulation study using a sigmoid Emax model, with rich, sparse, and unbalanced designs, and 3 levels of residual variabilitys.
Results: The asymptotic method tended to produce suboptimal coverages, especially for the variance terms, due to underestimated SE. Bootstrap approaches provided more adequate coverage, except for the NP bootstrap in the rich design. Overall, the new cNP provided better coverage than NP, with comparable performances to the Case. Increasing the residual error led to a marked degradation of the coverage rates for the random effects for Par and NP, and for s with all bootstraps.
Conclusions: Case bootstrap remains a simple and robust method providing adequate coverage. The new cNP based on samples from the conditional distributions offers a good alternative, albeit more time‐consuming, for complex designs to avoid stratification. None of the bootstraps could fully recover good estimates of uncertainty, especially for variance terms, when both IIV and s were large.
REFERENCE
1. Thai, H., Mentré, F., Holford, N.H., Veyrat‐Follet, C., & Comets, E. Evaluation of bootstrap methods for estimating uncertainty of parameters in nonlinear mixed‐effects models: a simulation study in population pharmacokinetics. J Pharmacokinet. Pharmacodyn. 41, 15‐33 (2014).
147
Pharmacokinetic analysis of linezolid in patients from a tertiary care center in Mumbai, India
Juan Eduardo Galvan 1; Mahmoud Abdelwahab T1; Prerna Arora K2; Zarir Udwadia F2; Camilla Rodrigues2; Amita Gupta3; Tester Ashavaid2; Jeffrey Tornheim A3; Paolo Denti1
1Division of Clinical Pharmacology, Department of Medicine, University of Cape Town, Cape Town, South Africa; 2Research Laboratories, P.D. Hinduja National Hospital and Medical Research Centre, Mumbai, India; 3Center for Clinical Global Health Education, Division of Infectious Diseases, Johns Hopkins University School of Medicine, Baltimore, MD, USA
Background: Multidrug‐resistant (MDR) tuberculosis (TB) incidence is increasing worldwide, and India is the country with the highest absolute burden of MDR‐TB with 27%.1 Linezolid (LZD) is effectively used to treat MDR‐TB. We aimed to describe the pharmacokinetics of LZD in Indian patients.
Methods: We recruited patients from the Hinduja Hospital, Mumbai, India. All participants initially received 600 mg daily LZD, which reduced to 300 mg daily in patients with LZD‐related toxicities. Six blood samples were collected between 0 to 8 hours post dose at 1, 2, or 4 months after treatment initiation. The pharmacokinetic analysis was performed in NONMEM and compared with published LZD models in different populations.2,3
Results: The data included 156 LZD concentrations from 26 patients (17 females) with median weight, fat‐free mass, and age of 60 (range 35–103) kg, 40 (26–73) kg, and 28 (17–46) years, respectively. The pharmacokinetics of LZD was described by a one‐compartment model, first‐order elimination, and transit compartment absorption. Allometry was best implemented using fat‐free mass and the typical values for clearance and central volume were 3.91 L/h and 36.8 L.
Conclusion: Our value of clearance for Indian MDR‐TB patients is in line with reports in South African patients,2 but less than half of reported values from Brazil and USA.3
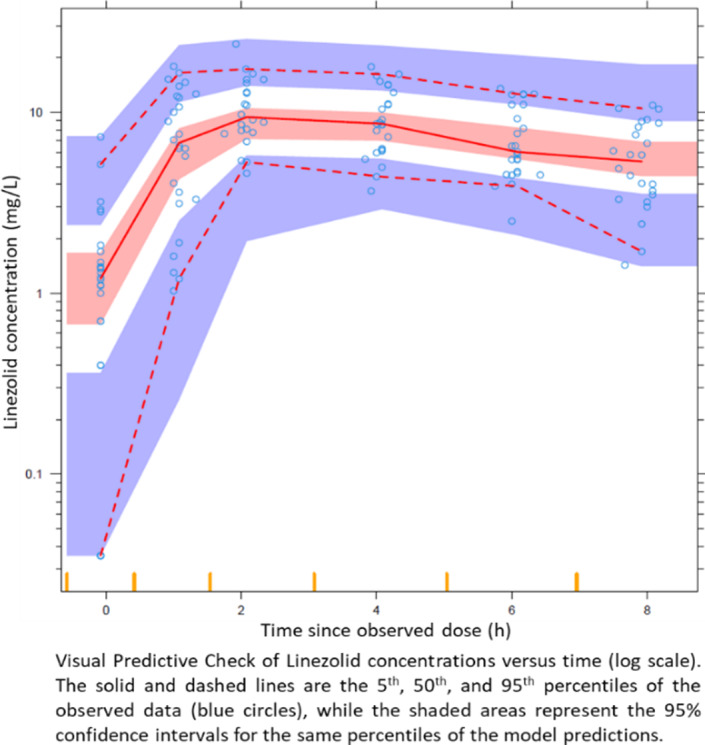
FIGURE
REFERENCES
World Health Organization (WHO). 2020. Global tuberculosis report.
Abdelwahab, M.T. et al. Linezolid population pharmacokinetics in South African adults with drug resistant tuberculosis. Antimicrob. Agents Chemother. 65, e01381‐21 (2021).
Alghamdi, W.A. et al. Population Pharmacokinetics of Linezolid in Tuberculosis Patients: Dosing Regimen Simulation and Target Attainment Analysis Wael. Antimicrob. Agents Chemother. 64, e01174‐20 (2020).
148
Population pharmacokinetic analysis of rifampicin in plasma, cerebrospinal fluid, and brain extracellular fluid in South African children with tuberculous meningitis
Noha Abdelgawad 1; Mvuwo (Phophi) Tshavhungwe2; Ursula Rohlwink2,3,4; Helen McIlleron1; Mahmoud T. Abdelwahab1; Lubbe Wiesner1; Paolo Denti1; Anthony Figaji2,3
1Division of Clinical Pharmacology, Department of Medicine, University of Cape Town, Cape Town, South Africa; 2Division of Neurosurgery, Department of Surgery, University of Cape Town, Cape Town, South Africa; 3Neuroscience Institute, University of Cape Town, Cape Town, South Africa; 4The Francis Crick Institute, London, UK
Background: Limited knowledge is available on the pharmacokinetics (PK) of the anti‐tubercular drug, rifampicin, in children with tuberculous meningitis (TBM). The aim of this analysis was to characterize the distribution of rifampicin in the central nervous system by sampling the cerebrospinal (CSF) and brain extracellular fluid (ECF), which are closer to the site of infection.
Methods: Samples from 61 children with definite or probable TBM were included in this PK analysis. Sparse samples were collected from plasma, lumbar CSF (LCSF), ventricular CSF (VCSF), and brain ECF (via microdialysis), which were collected opportunistically as clinically indicated. Ethical approval was obtained from the University of Cape Town human research ethics committee. Rifampicin was quantified in all samples, and 25‐desacetyl rifampicin only in the plasma samples. The CSF and ECF data were modeled as separate “effect compartments”.
Results: The final model was a one‐compartment model with first‐order elimination and transit compartment absorption, plus a metabolite compartment assuming 100% conversion of rifampicin to 25‐desacetyl rifampicin. Allometric scaling of all disposition parameters, maturation effect on CL and CLM, and autoinduction of CL were included in the model. The partitioning of rifampicin between the plasma and each of the effect compartments was described by pseudopartition coefficients, which were 5%, 4%, and 0.5% for LCSF, VCSF, and brain ECF, respectively. The equilibration speed between the central compartment and each of the effect compartments is described by the t1/2e0 which was 3.24 h for LCSF and 1.75 h for VSCF and brain ECF.
Conclusion: The results show that the penetration of rifampicin in the CSF is much lower than in the plasma and even lower in the brain ECF. Current standard rifampicin dosing achieves poor CSF and brain ECF distribution.

FIGURE Simulated typical concentration‐time profiles in plasma (yellow) shown on right y‐axis, lumbar CSF (red), ventricular CSF (blue), and brain ECF (green) shown on left y‐axis for a patient with median weight taking median dose
186
Prediction of drug‐drug interactions with oxycodone and pupil constriction using a physiologically based pharmacokinetic‐pharmacodynamic model
Jia Ning; Peter Kilford; Iain Gardner
Certara UK Limited, Simcyp Division, Level 2‐Acero, Sheffield, UK
Background: Oxycodone is a potent opioid which is metabolized by CYP3A4 and CYP2D6. The aim of this study was to develop a physiologically based pharmacokinetic‐pharmacodynamic (PBPK‐PD) model for oxycodone to assess drug‐drug interaction (DDI) with CYP3A4 and CYP2D6 inhibitors/inducers on plasma concentrations and pharmacodynamic effect as measured by pupil constriction.
Methods: In this study a minimal PBPK‐PD model was developed in Simcyp V21. The absorption was described by first order model with human intestinal permeability predicted using Caco‐2 data. The intrinsic clearance of CYP3A4 (fm = 0.45) and CYP2D6 (fm = 0.19) were calculated using clinical IV data. The pupil constriction effect of oxycodone was modeled using a Sigmoid Emax model with an effect compartment, to take hysteresis into account.
Results: The simulated PK parameters were within 1.5‐fold of observed data for 30 clinical studies. The model was further verified against published DDI studies with CYP3A4 inhibitors ketoconazole, ritonavir, clarithromycin and the CYP2D6 inhibitor, quinidine. Simulated Cmax and AUC ratios were within 1.6‐fold of observed values. The performance of PD model for pupil constriction prediction was evaluated against 8 clinical studies. Use of Sigmoid Emax model with effect compartment can successfully predict pupil constrictions.
Conclusion: The developed PBPK‐PD model of oxycodone can reasonably recover the impact of CYP2D6 genetic polymorphisms and DDI on plasma exposure and pharmacodynamic effects. The current model can provide guidance on dose adjustment of oxycodone in different CYP2D6 phenotypes populations and forecast oxycodone exposure when co‐administered with other CYP3A4 and CYP2D6 perpetrators.
188
In vivo performance prediction of estrogen buccal film using convolution approach: application of r programming language
Sadikalmahdi Abdella; Franklin Afinjuomo; May Song; Richard Upton; Sanjay Garg
University of South Australia, Adelaide, Australia
Background: Convolution is a single‐step predictive mathematical modeling approach that involves deriving plasma drug concentration time profile from the in vitro release profile and reported pharmacokinetic characteristics.1 In this study, we aimed to mathematically predict the pharmacokinetic profile of estradiol buccal film in man by convolution approach in R programming language.

FIGURE
Methods: The relationship between measured quantities (in vitro release rate and plasma drug concentrations after i.v. administration) was modeled directly in a single stage using convolve function in R software (R version 4.1.1). The pharmacokinetics of intravenous estradiol in women was obtained from the literature2. Unit Input Response (UIR) of the drug, which represents the systemic kinetics of the drug (i.e., the in vivo concentrations after an i.v. dose of 1 dose unit), was calculated and convolved with a new time‐course of extravascular input rate (I) to predict the in vivo concentration time‐course for the new extravascular administration process.
Results: The predicted Cmax and Tmax for buccal film loaded with 1.47 mg of estradiol were 740.74 ng mL−1 and 7 minutes. The predicted pharmacokinetic parameters were comparable with results reported in published literature and give an insight into the relative clinical behavior of the film relative to intravenous administration and may help optimize the design of future in vivo studies.
Conclusion: A convolution model in R software is a simple and practical method to predict plasma drug concentration‐time profiles from in vitro release data before more comprehensive in vivo data are available.
REFERENCE
Zadbuke, N., et al. Convolution and deconvolution based approach for prediction of in‐vivo performance. Eur. J. Biomed. 4, 447‐453 (2017).
189
Peccary, a collaborative R package and its Shiny application to improve PMx efficiency
Thibaud Derippe 1,2,3; Donald E. Mager3; Xavier Declèves2; Sylvain Fouliard1
1Institut de Recherches Internationales Servier, Suresnes, France; 2Université de Paris, Inserm, UMRS‐1144, Optimisation Thérapeutique en Neuropsychopharmacologie, Paris, France; 3Department of Pharmaceutical Sciences, University at Buffalo, Buffalo, NY, USA
Background: Pharmacometrics (PMx) workflow faces several challenges, such as the requirement to learn and use different syntaxes from incompatible software or use of non‐optimized and time‐consuming software requiring many lines of code. Peccary, a R package with its Shiny application, was built with the objective to improve day‐to‐day PMx efficiency by integrating pre‐existing software along with built‐in functions, inside a single and optimized platform.
Methods: Peccary was developed using an agile methodological framework that allows for iterative improvements after each user feedback. For the last three years, R codes were produced and aggregated every time the main author encountered specific needs as a pharmacometrician, ensuring each Peccary functionality is truly needed.
Results: Peccary includes three sub‐packages that cover PMx analyses. First, PeccAnalysis allows for dataset analysis, from population descriptions to generating plots and non‐compartmental analyses. Second, PeccaReverse allows for efficient construction or importation of a model with minimalist syntax, directly within the Shiny application, to perform (1) simulations in various contexts, (2) design evaluations through PopED, and (3) translations to other PMx syntax (i.e., NONMEM, Monolix, ADAPT, nlmixr). Third, PeccaReverse standardizes the output of previously mentioned parameter estimation software prior to performing diagnostic functions and model comparisons.
Conclusion: Peccary is inspired by the markdown/pandoc system and greatly improves daily PMx modeling efficiency. Becoming a fully collaborative project would allow this program to reach its full potential. In addition, Peccary provides a free and complete PMx platform, making PMx more accessible throughout the world.
190
A Pharmacokinetic/pharmacodynamic analysis of the relationship between N,N‐dimethyltryptamine exposure and its effects on the EEG spectrum in healthy subjects
Emma Eckernäs 1; Christopher Timmermann2; Robin Carhart‐Harris2; Daniel Röshammar3; Michael Ashton1
1Unit for Pharmacokinetics and Drug Metabolism, Department of Pharmacology, Sahlgrenska Academy at University of Gothenburg, Gothenburg, Sweden; 2Centre for Psychedelic Research, Division of Psychiatry, Department of Brain Sciences, Imperial College London, UK; 3Pharmetheus AB, Uppsala, Sweden
Background: N,N‐dimethyltryptamine (DMT) is a serotonergic psychedelic compound that can produce intense alterations in cognitive and perceptual functions. This work aimed to characterize the relationship between DMT plasma concentration and alpha power, beta power, and signal diversity measured by EEG.
Methods: Data were obtained from 13 healthy subjects who were administered placebo or DMT (7, 14, 18 or 20 mg) intravenously1. The study was approved by the UK National Research Ethics Committee London‐Brent and the Health Research Authority. Plasma samples were collected before and up to 60 minutes after administration. EEG recordings were collected during the first 20 minutes. The pharmacokinetic and pharmacodynamic data was modeled using nonlinear mixed‐effects modelling in NONMEM v.7.4.3.
Results: DMT disposition was described by a two‐compartment model with first‐order elimination. The DMT exposure‐response relationships were described using effect compartment models with sigmoidal Imax/Emax models. DMT was shown to fully suppress alpha power (Imax = 1), whereas beta power was only partially suppressed (Imax = 0.7). Signal diversity was observed to increase with DMT exposure (typical Emax = 10%). The corresponding EC50e values were estimated at 69, 133, and 53 nM with between‐subject variabilities of 29, 73, and 77%CV, respectively. Simulations of 100 individuals demonstrated that at a dose of 20 mg, inhibition of alpha power ranged from 89 to 100% whereas the corresponding inhibition in beta power was 4 to 70%. The simulated increase in signal diversity ranged between 5 and 18%.
Conclusion: The results indicate that there is a relationship between DMT concentrations and EEG effects. In particular, the suppression in alpha power seems to be the most robust EEG response.
REFERENCE
Timmermann, C., et al. Neural correlates of the DMT experience assessed with multivariate EEG. Sci Rep. 9, 16324 (2019).
191
Effect of genetic polymorphism and co‐medications on tamoxifen metabolising enzymes and plasma levels of endoxifen in Black South African breast cancer patients
Shingirai Chiwambutsa
University of Witwatersrand, Johannesburg, South Africa
Background: Clinical outcomes of treatment with tamoxifen show wide inter‐individual variability. Co‐medications and genetic polymorphism of enzymes involved in tamoxifen metabolism contribute to this variability. Unlike for other races, there is limited literature on drug‐drug and drug‐gene interactions among black African populations, despite their high genetic diversity. In this study, effects of antiretroviral treatment (ART), anti‐hypertensives, and antidiabetics on tamoxifen pharmacokinetics were evaluated in a cohort of 369 South African black female breast cancer patients. The pharmacokinetic effects of genetic polymorphism of enzymes (CYP2C9, 2C19, 2B6, 2D6, 3A4 and 3A5) involved in tamoxifen metabolism, including the African‐specific variants CYP2D6*17 and *29, were evaluated.
Methods: Serum tamoxifen and its major metabolites were quantified by mass spectrometry, LCMSMS. CYP2D6, CYP3A5, CYP3A4, CYP2B6, CYP2C9 and CYP2C19 were genotyped using GenoPharmR open array. Drug‐drug and drug‐gene interactions were evaluated on 161 compliant breast cancer patients with tamoxifen concentration >60ng/mL.
Results: All genotyped CYP polymorphisms had no significant effect on endoxifen concentrations. There were significant differences in median ndesmethyltamoxifen/endoxifen metabolic ratio (MR) between CYP2D6 genotype (stratified by CYP2D6*17), p = 0.044. The CYP2D6*29 and the combined effect of CYP2D6*17 and *29 had no effect on tamoxifen metabolism. There was a potential effect of CYP3A5 phenotype on endoxifen, p = 0.052. Antidiabetics did not have any significant effect on tamoxifen metabolism while antihypertensives had a significant effect on MR (NDM/END), p = 0.040. ART had a significant effect on the TAM to NDM pathway (p = 0.008) and NDM to ENDO pathway (p = 0.046).
Conclusion: Our results suggest that CYP2D6 and CYP3A5 polymorphisms have effects on the NDM to ENDO metabolism pathway but not resulting in significant changes in endoxifen concentrations. ART had an effect on the NDM to ENDO pathways but again without significant effects on endoxifen concentration.
195
Semi‐mechanistic pharmacokinetic modeling of liposomal amphotericin B (AmBisome®) in post kala‐azar dermal leishmaniasis patients
Wan‐Yu Chu1 ; Shyam Sundar2; Dinesh Mondal3; Pradeep Das4; Krishna Pandey4; Alwin Huitema1,5,6; Fabiana Alves7; Thomas Dorlo1
1Netherlands Cancer Institute, Amsterdam, the Netherlands; 2Banaras Hindu University, Varanasi, India; 3Centre for Nutrition and Food Security (CNFS), International Centre for Diarrhoeal Disease Research, Bangladesh (ICDDR,B), Dhaka, Bangladesh; 4Rajendra Memorial Research Institute of Medical Sciences (RMRIMS), Patna, India; 5Princess Máxima Center for Pediatric Oncology, Utrecht, the Netherlands; 6University Medical Centre Utrecht, Utrecht, the Netherlands; 7Drugs for Neglected Diseases initiative (DNDi), Geneva, Switzerland
Background: Post kala‐azar dermal leishmaniasis (PKDL) is a clinical complication following an episode of the neglected parasitic tropical disease visceral leishmaniasis. The efficacy and safety of liposomal amphotericin B (Ambisome®; LAmB) regimens in the treatment of PKDL is under investigation on the Indian subcontinent. This study aimed to characterize the non‐linear pharmacokinetics (PK) of LAmB in PKDL patients using a semi‐mechanistic approach.
Methods: Data originated from a clinical trial studying short regimens of intravenous (IV) LAmB and IV LAmB combined with oral miltefosine as short course regimens for PKDL treatment in India and Bangladesh. Patients received 5 doses of total 20 mg/kg LAmB over 2 weeks. Total amphotericin B concentrations in plasma were measured after the first and last LAmB administration. Population PK analysis was performed with NONMEM.
Results: PK data from 60 patients were analyzed. Patients exhibited two types of LAmB concentration‐time profiles, in which an increasing or a similar drug exposure over repeating doses were observed. A two‐compartment model incorporating a saturable distribution process described by a maximal binding capacity (Bmax) function best fitted the data. Bmax was introduced as a representation of the mononuclear phagocyte system (MPS), which plays an important role in the disposition of liposomes. CL, V, Kin , Kout , and Bmax were estimated 0.39 L/h, 4.4 L, 0.87 1/h, 0.02 1/h, and 90.8 mg, respectively.
Conclusion: The present model suggested LAmB follows the non‐linear PK characteristics of liposome disposition, possibly driven by the saturation of MPS uptake. Distinct LAmB concentration‐time profiles were captured within the patient population, highlighting saturable distribution over time as an important factor regulating inter‐ and intra‐individual variabilities.
TABLE PK parameter estimates
| PK parameters | Estimates (SD) | Interindividual variability |
|---|---|---|
| CL (L/h) | 0.39 (0.02) | 44% |
| V (L) | 4.4 (0.15) | 26% |
| K in (1/h) | 0.87 (0.14) | – |
| K out (1/h) | 0.02 (0.003) | 68% |
| B max (mg) | 90.8 (5.5) | 46% |
| Residual variability | ||
| Proportional error | 23% | – |
CL, clearance from the central compartment; V 1, central volume of distribution; K in, rate constant for association; K out, rate constant for dissociation; B max, maximal drug binding capacity.
196
Development and evaluation of a height‐based tobramycin initial dosing nomogram for the treatment of adult cystic fibrosis pulmonary exacerbations
Mehdi El Hassani 1,2; Daniel J. G. Thirion1,3; Kevin Koloskoff1,2; Elias Matouk4,5,6; Chantale Simard7,8; Sylvie Pilote7; Isabelle Cloutier7; Amélie Marsot1,2
1Faculty of Pharmacy, Université de Montréal (UdeM), Montreal, Canada; 2Laboratoire de suivi thérapeutique pharmacologique et pharmacocinétique, Faculty of Pharmacy, Université de Montréal, Montreal, Canada; 3Department of Pharmacy, McGill University Health Centre (MUHC), Montreal, Canada; 4Adult Cystic Fibrosis Clinic, Montreal Chest Institute, McGill University, Montreal, Canada; 5Department of Medicine, McGill University, Montréal, Canada; 6McGill University Health Center Research Institute (MUHC‐RI), Montreal, Canada; 7Faculty of Pharmacy, Université Laval, Quebec City, Canada; 8Centre de recherche, Institut universitaire de cardiologie et de pneumologie de Québec (IUCPQ), Quebec City, Canada
Background: Cystic fibrosis (CF) patients display large interindividual variability in tobramycin pharmacokinetics (PK), making it difficult to achieve effective peak concentrations (Cmax). Height was previously found to be significantly more predictive of tobramycin PK than body weight. The aim of this study was to develop a height‐based initial dosing nomogram and to evaluate its performance on Cmax precision relative to standard dosing.
Methods: Monte Carlo simulations were performed to develop a nomogram representing the daily doses required to reach various Cmax targets in relation to different heights. Tobramycin Cmax data observed in adult CF patients at two Canadian hospitals (MUHC and IUCPQ) were compared to the predicted Cmax values one could have obtained using the doses from the nomogram. Levene’s test was performed to assess equality of variance between groups. Data collection was approved by the MUHC and IUCPQ research ethics committees.
Results: Tobramycin daily doses were described by linear equations. For instance, the following equation describes the dose required to reach a 20 mg/L Cmax target: dose = 5.6*height‐507.7. Height‐based dosing resulted in significantly less variable predicted Cmax values compared to the observed Cmax values obtained from routine clinical care (p < 0.001). The distribution of Cmax values observed at the MUHC and IUCPQ yielded coefficient of variation (CV) values of 30.3% and 37.0%, respectively. Cmax values predicted at the MUHC and IUCPQ using the doses derived from the nomogram yielded CV values of 16.4% and 11.7%, respectively.
Conclusion: An initial dosing nomogram was developed for tobramycin that could help reduce the PK variability in observed Cmax. More precise dosing would allow for possibly better clinical outcomes in adult CF patients.
198
Population pharmacokinetic characteristics of desethylamodiaquine in Ghanaian pediatric patients with sickle cell disease
George Obeng Adjei1; Seth Amponsah 2; Bamenla Goka3; Christabel Enweronu‐Laryea3; Lorna Renner3; Abdul Sulley1; Michael Alifrangis4; Jorgen Kurtzhals4
1Centre for Tropical Clinical Pharmacology and Therapeutics, University of Ghana Medical School, Accra, Ghana; 2Department of Medical Pharmacology, University of Ghana Medical School, Accra, Ghana; 3Department of Child Health, University of Ghana Medical School, Accra, Ghana; 4Centre for Medical Parasitology at Department of International Health, Immunology and Microbiology University of Copenhagen and Department of Clinical Microbiology and Department of Infectious Diseases, Copenhagen University Hospital (Rigshospitalet), Copenhagen, Denmark
Background: There is limited information on the safety or efficacy of currently recommended antimalarial drugs in patients with sickle cell disease (SCD), a population predisposed to worse outcomes of acute malaria. Artesunate‐amodiaquine (ASAQ) is used in the treatment of uncomplicated malaria (UM) in SCD patients in many malaria‐endemic countries. This study sought to determine the pharmacokinetics (PK) of desethylamodiaquine (DEAQ), the main active metabolite of amodiaquine, among pediatric SCD patients with UM treated with ASAQ.
Methods: Plasma concentration‐time data (median DEAQ levels) of SCD children (n = 16) was initially compared with those of concurrently recruited non‐SCD paediatric patients with acute UM (n = 13). A population PK modeling approach was then used to analyze plasma DEAQ concentrations obtained between 64 and 169 hours after oral administration of ASAQ in paediatric SCD patients with acute UM (n = 16). To improve PK modeling, DEAQ concentration‐time data (n = 21) from SCD was merged with DEAQ concentration‐time data (n = 169) of a historical paediatric population treated with ASAQ (n = 103) from the same study setting. This study was approved by the Korle‐Bu Teaching Hospital Institutional Review Board.
Results: The median DEAQ concentrations on days 3 and 7 were comparatively lower in the SCD patients compared to the non‐SCD patients. A two‐compartment model best described the plasma DEAQ concentration‐time data of the merged data (current SCD data and historical data). The estimated population clearance of DEAQ was higher in the SCD patients [67 L/h, 21% relative standard error (RSE)] compared with the non‐SCD population (15.5 L/h, 32% RSE). The central volume of distribution was larger in the SCD patients compared with the non‐SCD patients (4400 L, 43% RSE vs. 368 L, 34% RSE).
Conclusion: The data shows a tendency towards lower DEAQ concentration in SCD patients, and the exploratory population PK estimates suggest altered DEAQ disposition in SCD patients with acute UM. These findings may reflect pathophysiological changes associated with SCD on DEAQ disposition and could have implications for therapeutic response to amodiaquine in SCD patients.
199
Optimizing the dosing regimen of cefazolin in children < 25 Kg undergoing cardiac surgery with cardiopulmonary bypass
Manna Semere Gebreyesus 1; Alexandra Dresner2; Lubbe Wiesner3; Ettienne Coetzee4; Tess Verschuuren5; Roeland Wasmann6; Paolo Denti7
1Division of Clinical Pharmacology, Department of Medicine, University of Cape Town, Cape Town, South Africa; 2Department of Anaesthesia and Perioperative Medicine, Red Cross War Memorial Children’s Hospital and University of Cape Town, Cape Town, South Africa; 3Division of Clinical Pharmacology, Department of Medicine, University of Cape Town, Cape Town, South Africa; 4Department of Anaesthesia and Perioperative Medicine, Groote Schuur Hospital and University of Cape Town, Cape Town, South Africa; 5Department of Epidemiology of Infectious Diseases and Department of Medical Microbiology, Utrecht University, Utrecht, The Netherlands; 6Division of Clinical Pharmacology, Department of Medicine, University of Cape Town, Cape Town, South Africa; 7Division of Clinical Pharmacology, Department of Medicine, University of Cape Town, Cape Town, South Africa
Background: Cefazolin is an antibiotic used to prevent surgical site infections during (pediatric cardiac) surgery with cardiopulmonary bypass (CPB). Unbound cefazolin plasma concentrations above 4×MIC for 100% of the time during surgery and a few hours after (100% fT > 4×MIC) is targeted. We aim to optimize the cefazolin paediatric dosing regimen when CPB is used.
Methods: Children < 25 kg undergoing cardiac surgery with CPB at Red Cross Children’s Hospital were recruited for this study. Standard cefazolin dosing regimen at the hospital consisted of 50 mg/kg intravenous bolus dose given at induction of anaesthesia followed by a second dose 4 to 6 hours later post‐surgery. Six children received an additional dose into the CPB machine. Rich sampling was performed before, during, and after surgery. Data were analyzed using nonlinear mixed effects modeling with allometric scaling on disposition parameters. Simulations were performed to test alternative dosing approaches.
Results: Pharmacokinetic data were obtained from 22 children with median (range) age of 19.5 (1‐94) months and weight of 8.7 (2.0‐21) kg. A two‐compartment model with a CPB compartment was developed with first‐order elimination and transit compartment absorption. For a 10 kg child and 120 ml/min/1.73m2 creatinine clearance of, CL of 0.856 L/h and central Vd of 1.07 L were estimated. Simulations for this typical patient on a standard dose showed a drop in concentrations when connecting the CPB and a median (95% CI) percentage fT > 4×MIC of 91 (54‐100) % without and 95 (73‐100) % with a dose in the CPB. An alternative dosing strategy using continuous infusion resulted in a 100% target attainment.
Conclusions: A strategy with continuous infusion based on body size and renal function allows for controlled delivery to achieve more stable concentrations.
200
Model informed development of SIM0295 in hyperuricemia patients and healthy volunteers using a population pharmacokinetics/pharmacodynamics approach
Zheng Jiao 1; Yue‐ting Chen1,4; Yang Yang2; Shan‐sen Xu2; Chen‐yu Wang1; Pan Shu2; Xiao‐yu Zhang2; Qin Huang2; Jin Sook Kim3; Yue Huang2
1Shanghai Chest Hospital, Shanghai Jiao Tong University, Shanghai, China; 2Jiangsu Simcere Pharmaceutical, Nanjing, China; 3JW Pharmaceutical Corporation, Seoul, South Korea; 4School of Basic Medicine and Clinical Pharmacy, China Pharmaceutical University, Nanjing, China
Background: SIM0295, also known as URC102, is a novel and potent inhibitor of human uric acid transporter 1 (hURAT1), which is currently under clinical development to treat patients with gout. The aims of this study were to develop population pharmacokinetic (popPK) and pharmacodynamics (popPD) models of SIM0295 and to quantitatively investigate the effects of race, demographics, concomitant medications, food, and other factors on PK/PD behaviors of SIM0295.
Methods: PopPK and popPD models of SIM0295 in healthy subjects and gout patients with hyperuricemia were developed using nonlinear mixed effects modeling (NONMEM). The modeling data are derived from two phase 1 studies (healthy Korean subjects), two phase 2 studies (Korean gout patients with hyperuricemia), and two phase 1 studies (healthy Chinese subjects), the dosage used in trials ranged from 0.25 mg to 30 mg. The base model of popPK investigated one‐, two‐, and three‐compartment models as well as delayed absorption characteristics (e.g., Tlag and transit model); an exponential model was investigated for inter‐individual variability (IIV), and an additive, proportional, and proportional additive mixed model was investigated for residual error models. The popPD model was performed according to the mechanism of uric acid homeostasis, and the inhibitory effect of SIM0295 on partial reabsorption in the proximal tubule. Covariates were screened by diagnostic plots and stepwise methods. The final model was determined based on objective function value (OFV), parameter precision, goodness‐of‐fit plots (GOF), and the model was evaluated by visual predictive check (VPC). All model parameters were estimated using first‐order conditional estimation with interaction (FOCE‐I).
Results: A total of 195 subjects and 5852 plasma concentrations of SIM0295 were included in the popPK study, and 147 subjects and 3781 concentrations of serum uric acid were included in the popPD study. The body weight of Chinese subjects was about 17% lower than Korean subjects, the age of gout patients was older than healthy subjects, and the baseline serum uric acid value of gout patients was about 15% higher than healthy subjects. PopPK model: The results showed that the two‐compartment model with a four progressive absorption compartments and first‐order elimination fitted the PK behavior of SIM0295 best, in which the PK parameters were corrected with body weight (WT) with allometric amplification index and inter‐individual variability of CL, central volume of distribution (VC), and peripheral volume of distribution (VP) was correlated. The typical values were 2.74 L/h for CL, 0.698 L/h for Q, 19.4 L and 4.68 L for VC and VP, 1.85 h‐1 for Ka, and 0.465 h for MTT. Final popPK model equations were shown below: CL ; ; ; Vp ; (if fasted); (if fasted); (if fed, Korean trial = 1, Chinese trial = 3); (if fed, Korean trial = 1, Chinese trial = 3); . Internal evaluation of the model using GOF plots and VPC showed good model fit and stability. The results of covariate investigation of popPK model showed that body weight could significantly affect CL, Q, Vc, and Vp, and food had significant effect on absorption rate parameters (Ka, MTT). Different diet could influence the absorption rate parameters (Ka, MTT), while no significant effect was found in fasted state. The study results showed that, except body weight, no significant effect of food, race, and other covariates on the main PK parameters (CL, Q, Vc, Vp). PopPD model: The base model was investigated using an Emax model with a semi‐mechanism of inhibition of uric acid reabsorption. The typical values were 10.5 for Emax, 165 ng/mL for EC50, 1.28 for Hill constant, 246.54 dL for Vu in healthy subjects, and 144.72 dL for Vu in patients, the equations of popPD model were shown in the figure. The GOF and VPC results indicated good goodness of model fit performance. The results of covariate investigation showed that only the health status of subjects was found to be correlated with the volume of distribution of serum uric acid, and no covariate was found to have effect on Emax and EC50 values.
Conclusion: In this study, the PopPK/PD profiles of SIM0295 were in general comparable between Chinese and Korean subjects studied. The Emax model with uric acid reabsorption inhibition mechanism fitted the PD behavior of SIM0295 well, and a progressive absorption characteristic described by a transit model was found in both healthy volunteers and patients, with no significant effect of race on popPK/PD.

FIGURE A schematic of PK and PD (uric acid deposition) models of SIM0295. [A, uric acid amount; c, drug concentration; C base, uric acid concentration; fe, fraction excretion of uric acid; Ktr, transit rate constant; GFR, glomerular filtration rate; VU , volume of uric acid]
204
Application of control theory and optimal design framework in defining optimal dosing regimen for pediatric population
Thao‐Nguyen Pham 1,2; Philippe Pierrillas1; Marie‐Laure Delporte3; S. Y. Amy Cheung1; Vincent Duval1
1Certara, Princeton, NJ, USA; 2CNRS, Caen, Normandy, France; 3Roche Pharma Research and Early Development, Roche Innovation Centre Basel, Hoffmann‐La Roche, Basel, Switzerland
Background: Control theory (CT) and optimal design (OD) can be potentially used to search for optimal dosing regimen based on predefined control problem and optimal criteria1,2. This work aimed at identifying optimal global weight‐based dosing regimen (WBDR) of a drug (X) in pediatrics using CT and OD based on a population pharmacokinetic model and predefined objectives regarding efficacy and safety aspects.
Methods: The pediatric population was categorized in 4 groups according to bodyweight WT and age (Table). Covariates were sampled from the CDC data containing the distribution of WT in US children according to age and gender3. Race was sampled from a binomial distribution with probability of 0.5 for Asians. As race and WT were identified as significant covariates on the pharmacokinetics of X, optimal WBDR was investigated for pediatric based on those two covariates. An objective function (OF) was built from safety and efficacy criteria, defined on the highest observed Cmax and lowest observed AUC. CT and OD were applied to maximize OF when dose ranged from 1‐4 mg/kg by step of 0.1 to search for optimal WBDR. Efficacy criterion was then verified through simulation. RxODE and PopED R packages were used for simulations and OD4,5.
Results: The developed approach was successfully applied to pediatric context and permitted to define an optimal WBDR (Table). This result was then confirmed by simulations and was aligned with the optimal criteria, as more than 70% of individuals in each group achieved efficacy criterion.
Conclusion: Global WBDR of X for pediatrics were established based on predefined criteria using CT and OD, which had an advantage in facilitating automation of the process. This framework could be expanded to apply in a more complicated situation where there are multiple variables to be optimized.
REFERENCES
Iliadis A., et al. Dosage regimen calculations with optimal control theory. Int. J. Biomed. Comput. 36, 87‐93 (1994).
Holland‐Letz T., et al. Optimal experimental designs for dose‐response studies with continuous endpoints. Arch. Toxicol. 89, 2059‐2068. (2015).
NHANES. Percentile Data Files with LMS Values of United States Growth Charts, Centers for Disease Control and Prevention, United States (2000).
Fidler, M.L., Wang, W. (October 14, 2017), Facilities for Simulating from ODE‐Based Models, https://www.r‐project.org/, accessed 2021.
Nyberg J., et al. PopED: an extended, parallelized, nonlinear mixed effects models optimal design tool. Comput. Methods Programs Biomed. 108, 789‐805 (2012).
TABLE
| Age | Body weight (kg) | Optimal weight‐based dosing regimen | |
|---|---|---|---|
| Dose (mg/kg) | Efficacy criteria: Proportion of individual achieve AUC > 3650 ng*hr/mL (%) | ||
| 6‐11 months | 5‐10 | 1.8 | 71.37 (1.41) |
| 1‐6 years | 10‐15 | 1.6 | 77.56 (1.34) |
| 15‐20 | 1.6 | 83.48 (1.38) | |
| 7‐12 years | 20‐40 | 1.4 | 89.32 (1.11) |
205
Population pharmacokinetics of ethionamide and ethionamide sulfoxide in patients with multidrug‐resistant tuberculosis
Fanya Boulou
Discipline of Pharmacology, School of Pharmacy, University of Western Cape, Cape Town, South Africa
Background: Limited pharmacokinetics/pharmacodynamics (PK/PD) research has been done focussing on ethionamide sulfoxide (ETHSO) compared to its parent drug ethionamide (ETH) in the treatment of MDR‐TB, thus the purpose of this research. This study aimed at describing the population PK of ETH and ETHSO and the effect of HIV infection and demographics on their respective PK parameters.
Methods: The study involved male and female patients with MDR‐ TB co‐infected or not with HIV. Ethionamide dose was 500 mg and 750 mg for patients weighing 35 to 50 kg and 51 to 70 kg respectively. Blood samples were collected at 0, 1, 2, 2.5, 3, 3.5, 4, 5, 8, and 24 hours post drug administration. Using a developed and fully validated HPLC‐MS/MS, ETH and ETHSO were simultaneously quantified in patients’ plasma. PK parameters were determined using SAEM incorporated in PKanalix 2019R1. The study has been approved by the ethics committees of the University of Western Cape (Reference number 07/6/2014) and of the University of Cape Town (Reference number 777/2014).
Results: Thirty‐one patients, 32 (18‐54) years old, 52.32 (27‐54) kg BW, 11 HIV (+) and 17 males participated in the study. Ethionamide and ethionamide sulfoxide exhibited similar concentration‐time profiles. ETHSO AUC0‐24, Cmax, Tmax were 41.13 (2.87‐121.17) µg h/ml, 10.5 (0.63‐45.53) µg/ml, and 3 (1‐8) h, respectively, and were significantly higher than that of ETH except the Tmax. Statistical analysis of the PK parameters indicated that ETHSO and ETH PK parameters were not affected by HIV status, age, weight, or gender.
Conclusion: Relatively large variations were observed in the PK parameters of both compounds, partly due to genetic differences between the subjects and unmonitored food intake. Differences in ETH and ETHSO plasma levels may have significant implications on ETH efficacy and safety.
Acknowledgement: South African Medical Research Council, Self‐Initiated Research Grant
TABLE PK Parameters of Ethionamide and Ethionamide Sulfoxide
| PK parameters* | ETH | ETHSO | P‐value |
|---|---|---|---|
| AUC 0‐24 (µg/ml−1 h) | 0.887 (0.07‐22.6) | 41.13 (2.9‐121.2) | <0.0001 |
| Cmax (µg/ml) | 0.27 (0.04‐3.2) | 10.55 (0.6‐45.5) | <0.0001 |
| VF (ml) | 1705.23 (99.5‐30976.6) | 31.44 (8.7‐262.3) | <0.0001 |
| Cl‐F (ml h−1) | 351.04 (33.1‐7129.4) | 16.37 (3.8‐171.7) | <0.0001 |
Values are expressed in medians and range.
206
A population pharmacokinetic model of linezolid enabling model‐informed precision dosing in resistant tuberculosis patients
Laurynas Mockeliunas 1; Lina Keutzer1; Marieke GG Sturkenboom2; Mathieu S. Bolhuis2; Onno W. Akkerman3,4; Ulrika SH Simonsson1
1Department of Pharmaceutical Biosciences, Uppsala University, Uppsala, Sweden; 2University of Groningen, University Medical Center Groningen, Department of Clinical Pharmacy and Pharmacology, Groningen, The Netherlands; 3University of Groningen, University Medical Center Groningen, Pulmonary Diseases and Tuberculosis, Groningen, The Netherlands; 4University of Groningen, University Medical Center Groningen, Tuberculosis Center Beatrixoord, Groningen, The Netherlands
Background: Multidrug‐resistant (MDR‐) tuberculosis (TB) treatment has a success rate of only 57%. Linezolid treatment longer than 28 days has been related to serious adverse events. The aim of this work was therefore to establish a model‐informed precision dosing (MIPD) algorithm using population pharmacokinetic (popPK) modelling, which can be used for dose individualization of linezolid enabling safe and efficacious dosing.
Methods: An MIPD approach was developed using an in‐house popPK model describing linezolid PK in MDR‐TB patients. For the MIPD approach, previously established efficacy and safety targets were used: unbound area under the concentration‐time curve over minimal inhibitory concentration (fAUC0‐24h/MIC) of >119 and unbound trough concentration (fCmin) of <1.38 mg/L, facilitating dose optimization considering both efficacy and safety. One thousand hypothetical patients were simulated. Modeling and simulations were performed using NONMEM.
Results: According to the simulations, a flat dose of 600 mg once daily was appropriate for 67.2% of the simulated patients, while 17.6% did not meet the safety target, 14.0% not the efficacy, and 1.2% neither the efficacy nor the safety target. Using the MIPD algorithm, 76.1% and 81.5% of the simulated patients reached the efficacy and safety target when information from one and two PK sampling occasions was used, respectively. When information from three sampling occasions was used, 88.2% of the simulated patients reached both efficacy and safety (6.9% did not meet the safety, 4.6% not the efficacy, and 0.3% neither the efficacy nor the safety target).
Conclusion: The results suggest that an MIPD approach for linezolid dosing would lead to increased efficacy and safety compared to a flat dosing strategy.
207
Ustekinumab clearance during induction predicts post‐induction endoscopic response in patients with Crohn’s disease
Zhigang Wang 1; Wannee Kantasiripitak1; Bram Verstockt2,3; João Sabino2,3; Marc Ferrante2,3; Paul Declerck1; Séverine Vermeire2,3; Erwin Dreesen1
1Department of Pharmaceutical and Pharmacological Sciences, KU Leuven, Leuven, Belgium; 2Department of Gastroenterology and Hepatology, University Hospitals Leuven, Leuven, Belgium; 3Department of Chronic Diseases and Metabolism, KU Leuven, Leuven, Belgium
Background: Therapeutic drug monitoring (TDM) of monoclonal antibodies is common in patients with Crohn’s disease (CD). Low drug concentrations may not only be the driver of a poor response, but they may also be the consequence of high disease activity (e.g., increased drug clearance [CL] by leakage through the inflamed bowel wall). We aimed to investigate the benefits of monitoring ustekinumab CL instead of standard TDM in patients with CD.
Methods: Data were obtained from 80 patients with moderate‐to‐severe CD receiving a 6 mg/kg intravenous (IV) ustekinumab induction dose at week (w)0. Ustekinumab serum concentrations were measured at w4 (mid‐dose) and w8 (right before the next dose). Endoscopic response (ER, ≥50% decrease from w0 in Simple Endoscopic Score for CD) was assessed at w24. A priori prediction (based on albumin and body weight; at w0) and a posteriori prediction (Bayesian forecasting using measured drug concentrations; at w4 and w8) were performed using a previously built population pharmacokinetic model (NONMEM 7.5).1
Results: Patients achieving ER at w24 had lower ustekinumab CL at w4 and w8, as well as a larger reduction in CL relative to w0 (P < 0.05). Ustekinumab serum concentrations at w4 and w8 were similar between patients with and without ER (P >0.2). The difference in ustekinumab CL at w4 relative to w0 better predicted ER at w24 than early ustekinumab concentrations (P < 0.05, Figure). Most patients with an increase in ustekinumab CL (27/29; 93%) at w4 did not achieve ER (P < 0.05). However, a decrease in CL was no guarantee for ER (false predictive rate 69%).
Conclusion: Higher ustekinumab CL (absolute as well as relative to w0) early during induction therapy predicts less favorable endoscopic outcome later on. CL monitoring may better predict ER as compared to standard TDM.

FIGURE The distributions of difference in ustekinumab clearance at week 4 relative to week 0 (dCLw0‐4, %) in patients achieving endoscopic response (green) and not (red) at week 24. The vertical dashed lines represent the median dCLw0‐4 in both groups. (Insert) Receiver‐operating characteristics (ROC) curves of ustekinumab dCLw0‐4 and ustekinumab concentration at week 4 (Concw4) for predicting endoscopic response at week 24. The area under ROC curve (AUROC) as well as the 95% confidence interval are indicated
REFERENCE
1. Wang, Z. et al. Population pharmacokinetic‐pharmacodynamic model‐based exploration of alternative ustekinumab dosage regimens for patients with Crohn’s disease. Br. J. Clin. Pharmacol. 88, 323‐335 (2022).
208
External evaluation of population pharmacokinetic models of gentamicin and tobramycin in critically ill patients
Alexandre Duong 1,2; Chantale Simard3,4; David Williamson2,5; Amélie Marsot1,2,6
1Laboratoire de Suivi Thérapeutique Pharmacologique et Pharmacocinétique, Montréal (Qc), Canada; 2Faculté de Pharmacie, Université de Montréal, Montréal (Qc), Canada; 3Faculté de Pharmacie, Université Laval, Québec (Qc), Canada; 4Centre de Recherche de l’Institut Universitaire de Cardiologie et de Pneumologie de Québec, Québec (Qc), Canada; 5Hôpital du Sacré‐Coeur de Montréal; 6Centre de Recherche CHU Sainte‐Justine, Montréal (Qc), Canada
Background: In the past decades, several aminoglycosides population‐pharmacokinetic (Pop‐PK) models were developed in critically ill patients.1 Only a few of them used external evaluation which is considered as one of the most robust evaluation methods during model development. It consists of testing the predictive capabilities of a model with an independent dataset. This study aims to evaluate the predictive performance of gentamicin and tobramycin Pop‐PK models with two independent datasets of critically ill adult patients.
Methods: A literature review was performed to determine the gentamicin and tobramycin models in critically ill adult patients.1 Gentamicin and tobramycin dosing data, information on the treatment, the patient and the bacteria were collected retrospectively in two Canadian institutions. External evaluations were performed using NONMEM® (v7.5) with each dataset independently and with both datasets combined. Predictive performance was assessed based on the estimation of bias (MDPE) and imprecision (MADPE) with the prediction error (PE%).
Results: Eleven and 5 models were identified but 4 and 3 were retained respectively for gentamicin and tobramycin, due to missing information or usage of a software other than NONMEM®. For both molecules, population MDPE and imprecision MADPE values were outside the acceptable range of ‐20% to 20% and ≤ 30%, respectively for all models.
Conclusion: The predictive performance of evaluated models in critically ill patients showed a wide variability. The latter may be explained by the different demographic characteristics between Canadian’s institutions and the models’ study populations This study brings to light of the necessity of predictive validation of Pop‐PK models, especially in special populations.
REFERENCE
Duong, A., Simard, C., Wang, Y.L., Williamson, D., & Marsot, A. Aminoglycosides in the intensive care unit: What is new in population PK modeling? Antibiotics, 10, 507 (2021).
209
Birthweight and postnatal age are important predictors for paracetamol clearance in preterm neonates
Yunjiao Wu 1; Swantje Völler1,2,3; Daniella Roofthooft3; Sinno Simons3; Robert Flint3,4; Catherijne Knibbe1,3,5
1Division of Systems Biomedicine and Pharmacology, Leiden Academic Centre for Drug Research, Leiden University, Leiden, The Netherlands; 2Pharmacy, Leiden Academic Centre for Drug Research, Leiden University, Leiden, The Netherlands; 3Department of Pediatrics, Division of Neonatology, Erasmus MC Sophia Children's Hospital, Rotterdam, The Netherlands; 4Department of Hospital Pharmacy, Erasmus University Medical Center, Rotterdam, The Netherlands; 5Department of Clinical Pharmacy, St Antonius Hospital, Nieuwegein, The Netherlands
Background: Intravenous paracetamol (PCM) is increasingly used to control mild‐to‐moderate pain in preterm neonates. The aim of this study was to quantify the developmental changes in PCM disposition in preterm neonates.
Methods: Two datasets were pooled and contained plasma PCM samples after single (n = 283) or multiple (n = 282) intravenous PCM doses (median 9 mg/kg, range 4‐25) from 146 preterm neonates with median gestational age (GA) 27.7 (range 24.0‐31.9) weeks, birth weight (BWb) 980 (462‐1925) kg, postnatal age (PNA) 5.2 (0‐78.8) days, and current weight (CW) 1023 (462‐2193) g. The population pharmacokinetic (PopPK) analysis was performed using the NONMEM® 7.4.
Results: The PK of PCM was best described by a 2‐compartment model with first‐order elimination. Clearance of PCM (0.14 L/h for a neonate with median BWb and PNA) increased with BWb in a power function (exponent: 0.942) and PNA in a linear function (slope: 0.0076 L/h/day for a neonate with median BWb). The combination of BWb and PNA was superior to postmenstrual age (ΔOFV = ‐68) or CW using power scaling (ΔOFV = ‐56). For neonates with the same BWb, clearance at day 7 and day 14 of PNA were 1.42‐ and 1.91‐fold the clearance at day 1, respectively. At the same PNA, the clearance in neonates with BWb of 1,000 and 1,500 g were 1.92‐ and 2.18‐fold that clearance of BWb 500 g, respectively. The central PCM volume of distribution (0.99 L for a neonate with median CW) increased with CW in a power function (exponent 0.832, ΔOFV = ‐8 compared to exponent 1). Goodness of fit plots and NPDEs results did not show any misspecification.
Conclusion: The developed popPK model successfully described the PCM concentrations in preterm neonates. BWb and PNA were important predictors for PCM clearance in preterm neonates and should be considered in future dosing guidelines.
210
Towards a new era of vancomycin therapeutic monitoring: external evaluation of population pharmacokinetic models in neonates
Mathieu Blouin 1,2; Marie‐Élaine Métras1,3; Julie Autmizguine4,5; Isabelle Viel‐Thériault6; Amélie Marsot1,2,7
1Faculty of Pharmacy, Université de Montréal, Montréal (Qc), Canada; 2STP2 Laboratory, Université de Montréal, Montréal (Qc), Canada; 3Department of Pharmacy, CHU Sainte‐Justine, Montréal (Qc), Canada; 4Department of Pharmacology and Pediatrics, Université de Montréal, Montréal (Qc), Canada; 5Clinical Pharmacology Unit, CHU Sainte‐Justine, Montréal (Qc), Canada; 6Infectiology, Department of Pediatrics, CHU de Québec‐Université Laval, Montréal (Qc), Canada; 7Research Center, CHU Sainte‐Justine, Montréal (Qc), Canada
Background: Vancomycin (VAN) therapeutic monitoring guidelines have recently been reviewed and substantial changes have been suggested. Preferably, they recommend using a population pharmacokinetic (popPK)‐guided Bayesian approach to estimate the exposure (AUC0‐24/MIC). While this new dosing strategy is primarily aimed at reducing rates of nephrotoxicity, it could help prevent the development of antibiotic resistance. Therefore, we sought to evaluate previously published VAN popPK models and validate the most predictive for the neonatal population of CHU Sainte‐Justine (CHUSJ).
Methods: This retrospective study relies upon clinical data pertaining to patients, so our research protocol was approved by CHUSJ ethics committee. Patients were included if they were treated for at least 48 hours by intravenous VAN in the neonatal care unit of CHUSJ. Every administration and dosing of VAN were retrieved in addition to patient’s characteristics. Predictive performance was assessed by prediction error (PE), which represents the relative difference between predicted and observed VAN concentrations after testing a model on NONMEM (ICON, 7.5).
Results: A total of 63 neonates accounted for 144 VAN doses, allowing us to evaluate eleven popPK models identified from literature. Four of them were found to be predictive (bias (median PE) 15% and imprecision (median |PE|) 30%), while the model developed by Grimsley and Thomson1 achieved the best predictive performance with a bias of ‐0.8%, the only one 5%, and an imprecision of 20.9%.
Conclusion: We were able to validate a predictive VAN popPK model for the neonatal population of CHUSJ. Based on the latest guidelines, we believe that clinical implementation of validated models will likely result in improved outcomes for neonates treated with VAN.
REFERENCE
1. Grimsley, C. & Thomson, A.H. Pharmacokinetics and dose requirements of vancomycin in neonates. Arch Dis Child Fetal Neonatal Ed. 81, 221‐227 (1999).
212
Should the unbound fraction be considered for piperacillin dosing adaptation in critically ill adult patients?
Ibrahim El‐Haffaf 1,2; Romain Guilhaumou3; Lionel Velly4; Amélie Marsot1,2,5
1Faculty of Pharmacy, Université de Montréal, Montreal, QC, Canada; 2Laboratoire de Suivi Thérapeutique Pharmacologique et Pharmacocinétique, Faculty of Pharmacy, Université de Montréal, Montreal, QC, Canada; 3Service de Pharmacologie Clinique et Pharmacovigilance, Assistance Publique des Hôpitaux de Marseille, Marseille, France; 4Service d’anesthésie‐réanimation, Hôpital de la Timone (HT), Assistance Publique des Hôpitaux de Marseille et Institut de neurosciences de la Timone, CNRS, Aix Marseille Université, France; 5Centre de recherche, CHU Sainte‐Justine, Montreal, QC, Canada
Background: A common approach to assess the efficacy of piperacillin (PIP) is to firstly measure the total concentration, and to afterwards apply a theoretical unbound fraction (fu) of 70% to obtain the unbound concentration. However, hypoalbuminemia is a common phenomenon in critically ill patients, resulting in variations in fu. We therefore sought to evaluate whether variations in fu could impact PIP clearance (CL) and whether dosing adaptations would be required.
Methods: Unbound factors of 70, 75, 80, and 85% were applied to total concentrations of piperacillin administered by continuous infusion, obtained from a retrospective study at the HT, France, with approval from HT’s ethics committee, resulting in four datasets. In each dataset, patients were categorized into four renal function categories based on their creatinine CL value: (1) < 30; (2) [30 and 80[; (3) [80 and 130[; and (4) > 130 mL/min. A validated model was used to estimate patient CL in each dataset. Afterwards, concentration‐time profiles were simulated with doses of 8, 12, and 16 g infused daily (based on patient renal function) following a loading dose of 4 g for each category for all four datasets to compare target attainment with various fu. Simulations were acceptable if concentrations remained above the target of 16 mg/L during all the dosing interval.
Results: CL decreased as fu increased. Median estimated PIP CL ranged from: 4.0 to 5.1 L/h for the first renal function category; from 19.0 to 21.2 L/h for the second; from 9.9 to 13.9 L/h for the third; 21.0 to 26.7 L/h for the fourth. All simulated concentration‐time profiles remained above the chosen target.
Conclusion: Variation in fu caused minimal impact on PIP CL and target attainment. Considering fu for dosing adaptation of a moderately bound molecule such as PIP may not be necessary.
213
Tumor microenvironment agent‐based models of emergent behavior during development and treatment
Van Thuy Truong 1; Van Thuy Truong2; Paolo Vicini3; James Yates4; Vincent Dubois1
1Clinical Pharmacology and Quantitative Pharmacology, Clinical Pharmacology and Safety Sciences, AstraZeneca, Cambridge, UK; 2University of Leeds, School of Mathematics, Leeds, UK; 3Confo Therapeutics, Ghent (Zwijnaarde), Belgium; 4GSKDMPK, In Vitro‐In Vivo Translation, R&D Research, GSK
Background: Tumor survival and escape depends on the interactions of immune cells in the tumor microenvironment. Behaviors such as PDL1 expression on the surface of cancer cells and infiltration of immune suppressive cells emerge in the context of the immune response and of therapeutic interventions such as radiotherapy or chemotherapy. In this tutorial, we show how the agent‐based approach can be used to simulate a heterogenous tumur population with different characteristics such as mutation rate and antigenicity and predict outcomes of different treatment options and dosing regimens.
Methods: We are developing hybrid ODE agent‐based models to capture the interaction between immune cells and cancer cells. A PKPD model was used for the PD1 treatment1 while cancer cells, immune effector cells and immune suppressor cells are simulated with an agent‐based model. Parameters such as cancer cell mutation rate, division rate or effector cell infiltration rate are governing the cell‐cell interaction.
Results: The simulation shows the interplay between immune cells and cancer cells and emergent behavior in the tumor microenvironment. After introducing the PD1 antibody cancer cell growth decreases from a mean of 207 cells (95% confidence interval 153‐251) to a mean of 140 cells (95% confidence interval 103–177) with a treatment of 1 mg/kg and to a mean of 109 cells (95% confidence interval 79–139) with a treatment of 5 mg/kg after 240 h of start of tumor growth and treatment.
Conclusion: Combining agent‐based models with ODEs enables us to simulate different tumor growth profiles and treatment outcomes. Further treatment such as chemotherapy and radiotherapy can be simulated by changing the death rate, effector cell infiltration rate due to increased antigenicity, killing rate, and PD1 expression rate.
REFERENCE
Lindauer, A., Valiathan, C.R., Mehta, K., Sriram, V., de Greef, R., Elassaiss‐Schaap, J., & de Alwis, D.P. Translational pharmacokinetic/pharmacodynamic modeling of tumor growth inhibition supports dose‐range selection of the anti‐PD‐1 antibody pembrolizumab. CPT Pharmacometrics Syst Pharmacol. 6,11‐20 (2017).
214
Linear transit compartment pharmacokinetic models – analytical solutions, equi‐dosing regimen regions and open questions
Lloyd Bridge 1; Fabian Hof2
1University of The West of England, Bristol, UK; 2Medical University of Vienna, Vienna, Austria
Background: Compartmental models yielding linear differential equations provide tools for pharmacokinetics (PK) analysis, with exact solutions readily obtainable for low‐dimensional cases, enabling valuable insights and further analysis. Transit compartment models (TCMs) provide a semi‐mechanistic approach for generalized models with delayed kinetics, but computing exact solutions for multi‐dosing inputs to TCMs leading to different final compartments is nontrivial.
Aims:
(1) Exact solutions for a TCM with absorption and central compartments, for n compartments and M equal bolus doses at constant frequency (“equi‐dosing”).
(2) Use of exact solutions in finding and visualizing constraints on equi‐dosing regimen parameters imposed by a therapeutic range.
Methods: We formulate new linear TCMs for pharmacokinetics with multi‐dosing input. Analytical solutions for the central compartment are found via Laplace Transforms. We derive new conditions on dosing regimen parameters for safe and therapeutic dosing using standard optimization methods.
Results: For an extended Savic1 TCM, new exact solutions are found in terms of the lower incomplete gamma function. Analysis of exact solutions for simple models and TCMs has resulted in the new concept of equi‐dosing regimen regions (EDRRs), providing a novel visualisation to summarise constraints on equi‐dosing dose and interval parameters.
Conclusion: Given that drug absorption delay is a significant effect in many real systems, analysis of TCMs, incorporating multi‐dose inputs, is a valuable pursuit. Our new models with analytical solutions may be easily manipulated computationally to construct equi‐dosing regimen regions. We propose this as a useful quantitative and diagrammatic summary to guide the design of therapeutic dosing.
REFERENCE
Savic, R.M. et al. Implementation of a transit compartment model for describing drug absorption in pharmacokinetic studies." J. Pharmacokinet. Pharmacodyn. 34, 711‐726 (2007).
215
Prospective validation of a newly developed model‐based dosing regimen for vancomycin in preterm and term neonates
Kinga Natalia Fiebig 1,2; S. Völler1,2; S.H.P. Simons1; R.B. Flint1,3; L. Blom1; E. De Saeger4; L. Mahieu5,6; K. Van Damme7; K. Allegaert3,8,9; C.A.J. Knibbe1,10,11; A. Smits8,12
1Department of Pediatrics, Division of Neonatology, Erasmus MC – Sophia Children's Hospital, Rotterdam, The Netherlands; 2Division of Pharmacy , LACDR, Leiden University, Leiden, The Netherlands; 3Department of Hospital Pharmacy, Erasmus MC, Rotterdam, The Netherlands; 4Faculty of Medicine, KU Leuven, Leuven, Belgium; 5Department of Pediatrics, Division Neonatology, University Hospital Antwerp, Edegem, Belgium; 6Department of Pediatrics, University of Antwerp, Antwerp, Belgium; 7Department of Pediatrics, Division Neonatology, University Hospital Antwerp, Edegem, Belgium; 8Department of Development and Regeneration, KU Leuven, Leuven, Belgium; 9Department of Clinical Pharmacology and Pharmacotherapy, KU Leuven, Leuven, Belgium; 10Department of Systems Biomedicine and Pharmacology, LACDR, Leiden University, Leiden, The Netherlands; 11Department of Clinical Pharmacy, St. Antonius Hospital, Nieuwegein, The Netherlands; 12Neonatal Intensive Care Unit, University Hospitals Leuven, Leuven, Belgium
Background: Vancomycin is commonly used in neonates to treat (suspected) late‐onset sepsis. Currently used regimens often result in varying exposure. Recently, a novel dosing regimen for vancomycin based on a population pharmacokinetic (popPK) model1 was implemented in 3 neonatal intensive care units (NICU), as standard of care. The guideline advises a loading dose (16‐23 mg/kg) followed by a dose and dosing interval (5‐15 mg/kg 3‐4 times daily) depending on postnatal age (PNA) and birthweight (BW) to achieve the efficacy target of area under the concentration‐time curve (AUC24hours) ≥ 400 mg × h/L. The aim of the study was to evaluate the vancomycin popPK model using therapeutic drug monitoring (TDM) data from (pre)term neonates receiving this novel dosing regimen.
Methods: 374 TDM samples were collected from 175 neonates below PNA of 29 days. To evaluate the performance of the popPK model1, observations were compared to model‐based predictions using NONMEM 7.5 and fixed parameters. Goodness‐of‐fit (GOF) was assessed using classical diagnostic plots, as well as GOF plots stratified by quartiles of the included covariates. The efficacy target of AUC24hours ≥ 400 mg × h/L was analysed.
Results: Concentrations were adequately predicted by the model, also when stratified by patient demographics even though a slight overprediction was observed in the neonates ≤ 700g BW and underprediction ≥ 2500g BW. The newly introduced loading dose resulted in target attainment in the first 24h of treatment with an AUC24hours ≥ 400 mg × h/L in 82% of neonates > 700g BW and 30% in neonates ≤ 700g BW.
Conclusion: This prospective validation supports that by implementing the novel popPK model‐based vancomycin regimen with a loading dose, adequate exposure of AUC24hours ≥ 400 is reached in most neonates.
REFERENCE
Janssen, E.J. et al. Towards rational dosing algorithms for vancomycin in neonates and infants based on population pharmacokinetic modeling. Antimicrob Agents Chemother. 60, 1013‐1021 (2015).
216
Automating information extraction from pharmacokinetic tables with language processing
Victoria Smith 1,2; Ferran Gonzalez‐Hernandez3; Gill Mundin4; Palang Chotsiri5; Thanaporn Wattanakul5; Watjana Lilaonitkul2; Frank Kloprogge6; Joseph Standing1
1Great Ormond Street Institute of Child Health, UCL, London, UK; 2Institute of Health Informatics, UCL, London, UK; 3CoMPLEX, UCL, London, UK; 4DMPK, Oncology R&D, AstraZeneca, Cambridge, UK; 5Department of Clinical Pharmacology, Mahidol Oxford Tropical Medicine Research Unit, Oxford, UK; 6Institute for Global Health, UCL, London, UK
Background: A centralised, standardised, big pharmacokinetic (PK) database is a prerequisite for PK analysis methods to benefit from the full potential of machine learning (ML). However, in vivo PK metadata is locked in semi‐structured tables in scientific literature and due to the magnitude, it is impossible to curate this manually. Automated information extraction (IE) provides an approach to efficiently filter relevant tables. This research aims to develop a labelled corpus of PK tables and a supervised ML pipeline to classify PK tables by the parameters and covariates they contain (the first stage of table IE).
Methods: A corpus of 2,500 tables, parsed from PubMed papers containing in vivo parameters1, was split into training (60%), validation (15%), and test (25%) sets. Tables were annotated with parameter and covariate classes (non‐compartmental parameters, number of subjects and doses) by a team of PK experts. A convolutional neural network (CNN) was trained to encode html information and perform the classification task. Performance was compared across different encoding methods (including bag‐of‐words and table embeddings), resampling techniques and data augmentation methods.
Results: Inter‐annotator agreement measured using Cohen's Kappa Scores, ranged from 0.78‐0.86 across classes in the corpus. Table embeddings combined with a CNN and data augmentation, identified parameters and covariates contained within a table with the highest F1‐scores per class: non‐compartmental parameters‐0.94, number of subjects‐ 0.88, and doses‐ 0.89.
Conclusion: This research developed an annotated PK table corpus and an ML pipeline to categorise PK tables with high precision and recall. This work will aid researchers to efficiently filter usable PK data and it provides the initial step towards automated table IE.
REFERENCE
Gonzalez‐Hernandez, F. et al. An automated approach to identify scientific publications reporting pharmacokinetic parameters. Wellcome Open Research. 6, 88 (2021).
218
Association between selected single nucleotide polymorphisms in globin genes and response to hydroxyurea therapy in children with sickle cell disease
Gloria Manu 1; Catherine Segbefia1,2; Benoit Banga N'guessan1; Shadrack Asiedu Coffie1; George Obeng Adjei1
1University of Ghana, Legon, Accra, Ghana; 2Korle Bu Teaching Hospital, Accra, Ghana
Background: Hydroxyurea (HU), a disease‐modifying pharmacological agent used in the treatment of Sickle cell disease (SCD), stimulates foetal haemoglobin (HbF) production, reducing sickle erythrocyte‐endothelial cell interaction. The degree of clinical and HbF response to HU varies considerably, and single nucleotide polymorphisms (SNPs) in quantitative trait loci have been implicated. Treatment with HU is life‐long, therefore identifying responder from non‐responder phenotypes is important. In this study, we investigated the presence or otherwise of SNPs in BCL11A and ‐158C/T Xmn1 polymorphism and their association with HbF in SCD children.
Methods: A hospital‐based cross‐sectional comparative study was conducted among 110 children with SCD in Ghana. HbF levels were measured in peripheral blood and SNPs genotyped using polymerase chain reaction and restriction fragment length polymorphism techniques. Ethical approval was obtained from the EPRC, College of Health Sciences, University of Ghana.
Results: The presence of the SNPs (rs11886868, rs6706648, rs7606173 and ‐158C/T Xmn1) were identified in the study groups. The observed heterozygosity and homozygosity for the derived allele was 38.2%, 71.8%, 30.9%, and 37.3% in rs11886868, rs6706648, rs7606173, and Xmn1, respectively. The minor allele frequencies observed were 0.204, 0.477, 0.171, and 0.190 for rs11886868, rs6706648, rs7606173, and ‐158C/T Xmn1 polymorphisms, respectively. The combined effect of the SNPs was associated with variance in HbF levels in the study groups.
Conclusion: Our data support the known association between HU intake and HbF increase in SCD. We also found an association between HbF levels and the studied SNPs with the variants influencing HbF levels in children with SCD in Ghana.
219
CYP2B6 inhibition by Hypoxis hemerocallidea and Sutherlandia frutescens: in vitro inhibition and the effect on in vivo pharmacokinetics of efavirenz
Nocolle Mathebula1; Wihan Pheiffer 1; Rose Hayeshi1
1DSI/NWU Preclinical Drug Development Platform, Faculty of Health Sciences, North‐West University, Potchefstroom, South Africa
Background: Efavirenz is a non‐nucleoside reverse transcriptase inhibitor that forms the backbone of many antiretroviral combinations used in South Africa. Efavirenz is primarily metabolized by CYP2B6. The co‐administration with African medicinal plants that inhibit CYP2B6 creates a risk for herb‐drug interaction. This study aimed to investigate if aqueous extracts of Hypoxis hemerocallidea and Sutherlandia frutescens inhibit CYP2B6 activity in vitro, and to determine these effects of CYP2B6 inhibition on efavirenz pharmacokinetics in a humanized mouse model expressing human CYP2B6.
Methods: In vitro CYP2B6 inhibition was investigated using bioassays. To investigate the in vivo effects of CYP2B6 inhibition on efavirenz pharmacokinetics, CYP2B6 humanized mice (n = 36) were divided into 2 groups. Group 1 was administered efavirenz (25 mg/kg), and Group 2 received an aqueous extract of S. frutescens (400 mg/kg) 1 hour before efavirenz (25 mg/kg) administration. All administrations were via oral gavage. Following administration, blood samples were collected at six‐time intervals (t = 0–720 min), from three mice per interval. Efavirenz was quantified by LC/MS/MS for the pharmacokinetic profile.
Results: Aqueous extracts of H. hemerocallidea and S. frutescens had IC50 values of 191µg/ml and 118 µg/ml, respectively. S. frutescens, the more potent inhibitor of CYP2B6, was used in the pharmacokinetic study. Results revealed that aqueous extracts of S. frutescens did not alter the pharmacokinetics of efavirenz in CYP2B6 humanized mice.
Conclusion: Aqueous extracts of H. hemerocallidea and S. frutescens inhibited CYP2B6 enzyme activity in vitro. Moreover, S. frutescens did not significantly alter the in vivo pharmacokinetics of efavirenz in CYP2B6 humanized mice.
220
Pharmacometrics modeling coupled with machine learning for early prediction of overall survival following atezolizumab monotherapy in non‐small cell lung cancer
Sebastien Benzekry 1; Melanie Karlsen1; Abdessamad El Kaoutari1; Suresh Vatakuti2; Peter Curle3; Candice Jamois2
1COMPO (COMPutational pharmacology and clinical Oncology), Inria Sophia Antipolis – Méditerranée and Center for Research on Cancer of Marseille, Inserm U1068, CNRS UMR7258, Institut Paoli‐Calmettes, Aix‐Marseille University, France; 2Clinical Pharmacometrics, Clinical Pharmacology, Pharmaceutical Sciences, Pharma Research and Early Development, Roche Innovation Center, Basel, Switzerland; 3Safety and Early Development Informatics, Pharma Research and Early Development, Roche Innovation Center, Basel, Switzerland
Background: Pharmacometrics (PMx) and machine learning (ML) approaches could help to predict survival based on patients’ and disease characteristics and early response to treatment.
Methods: We developed a predictive algorithm of survival following atezolizumab (ATZ) therapy based on the combination of nonlinear mixed‐effects modeling (NLME) and ML. The data consisted of 3 phase 2 trials (862 patients). Longitudinal data included tumor kinetics (TK, 5,570 data points) and 4 pharmacodynamic (PD) markers: neutrophils, C‐reactive protein (CRP), lactate dehydrogenase (LDH) and albumin (61,296 data points). Baseline data included clinical factors (P = 73 variables), transcriptomic data (P = 58,311 transcripts) and mutation data (P = 395 genes).
Results: The best models were double‐exponential (TK, neutrophils, CRP, LDH) and hyperbolic (albumin) models for NLME and a random survival forest for ML. A minimal ML model was derived that contains 11 routine clinical variables (CRP, heart rate, neutrophils‐to‐lymphocyte ratio, neutrophils, lymphocytes‐to‐leucocytes ratio, hepatic metastases, ECOG, PDL1, hemoglobin, baseline tumor size, and LDH), together with 3 TK and 9 PD model derived parameters obtained from Bayesian estimation. Predictive power was significantly improved when using the PD data compared with models based either on clinical variables or TK parameters for both discrimination (c‐index = 0.83 ± 0.02 vs. 0.72 ± 0.04 vs. 0.72 ± 0.02 in cross‐validation, 0.79 vs. 0.69 vs. 0.70 in test, 1‐year AUC = 0.92 ± 0.02 vs. 0.80 ± 0.05 vs. 0.81 ± 0.05) and calibration metrics.
Conclusion: Our novel prediction algorithm was able to predict accurately survival following atezolizumab monotherapy, both at the study and individual levels. External validation of the model is currently ongoing.
221
A population pharmacokinetics study of the new Tacrolimus Meltdose® formulation in stable renal transplant patients
Zeyar Mohammed Ali 1,2; Marinda Meertens1,2; Beatriz Fernández1,2; Pere Fontova1; Anna Vidal‐Alabró1; Helena Colom2; Nuria Lloberas1
1Laboratory 4122, Nephrology Service and Laboratory of Experimental Nephrology, University of Barcelona, Campus Bellvitge, Barcelona, Spain; 2Biopharmaceutics and Pharmacokinetics Unit, Department of Pharmacy and Pharmaceutical Technology and Physical Chemistry Department, School of Pharmacy, University of Barcelona, Barcelona, Spain
Background: The Tacrolimus (TAC) MeltDose® formulation increases bioavailability and reduces fluctuation between maximum and TAC pre‐dose concentrations compared with TAC immediate release formulation. We have established the first population pharmacokinetic model (PopPK) studying the influence of the cluster of CYP3A5 (*1/*3, *3/*3) and CYP3A4 (*1/*1, *1/*22) defining a high, intermediate, and low metabolizer phenotype.
Methods: Data obtained from 27 stable renal transplant patients who had received TAC‐IR formulation as part of the immunosuppressor treatment. Twenty‐three with complete area under curve (AUC) are from a prospective, non‐randomized single‐center trial, and 4 patients with pre‐dose sampling from the clinical routine check‐ups. The study was carried out in accordance with the Declaration of Helsinki with approval from the ethics committee of the Bellvitge Hospital. PopPK analysis of the data was carried out using NONMEM7.4.
Results: The PK profile is well described by a two‐compartment model with time lagged first order absorption modeled with transit compartment models. The CYP3A5*3 G>A(rs776746) and CYP3A4*22 C > T (rs35599367) single nucleotide polymorphisms Cluster were identified as significant covariates reducing 16% the inter‐patient variability in CL.
Conclusion: A PopPK model was successfully developed for TAC MeltDose® in stable kidney recipients. The model could guide TAC personalized dosing strategy for transplant patients showing the less fluctuating PK profile compared with other TAC formulations.
222
The effects of Sceletium tortuosum on cytochrome p450 enzymes in the flinders sensitive line rat liver and brain
Nicholas Mashego; Makhotso Lekhooa; Rose Hayeshi
DSI/NWU Preclinical Drug Development Platform, North‐West University, Potchefstroom, South Africa
Background: Sceletium tortuosum is a traditional medicinal herb that is indigenous to the north‐western part of South Africa. The use of the Sceletium tortuosum extract, Zembrin®, along with other medications, especially antidepressants, causes concern for the possibility of drug‐herb interactions between the herb and various other drugs at a metabolic level. In this study, the potential drug‐herb interactions were assessed by evaluating the potential inducing and inhibiting effects of Zembrin® on the Cyp1a2 enzyme in the FSL rat liver and brain.
Methods: The study made use of FSL rat livers and organs from rats that were treated with 10, 25, 30 mg/kg of Zembrin® or saline for a 14‐day period. Cyp1a2 fluorometric assay methods were used to determine Cyp1a2 activity in FSL rat liver and brain microsomes. Cyp1a2 inhibition was determined by treating FSL rat brain and livers with 0.1‐50 mg/mL of in vitro, the Cyp1a2 activity was measured using fluorescence‐based assays.
Results: The results displayed a dose‐dependent inhibition of the Cyp1a2 enzymes in the liver by Zembrin®, with the IC50 at 4.7 mg/ml. Zembrin® did not inhibit the Cyp1a2 enzymes in the FSL rat brain. Zembrin® did not induce the Cyp1a2 enzymes in the FSL rat liver and brain microsomes.
Conclusion: Zembrin® has the potential to be responsible for drug‐herb interactions as it is responsible for the dose‐dependent inhibition of the Cyp1a2 enzyme in vitro.
225
Evaluation of amphotericin b pharmacokinetics and kidney penetration using microdialysis in healthy and Candida albicans infected Wistar rats
Valdeene Vieira Santos 1,2; Laiz Campos Pereira1,2; Jackline Marley Santos de Araújo1,2; Matheus Antônio da Hora Borges1,2; Carolina Magalhães Brandão2; Luisa Oliveira Santos2; Ian Costa Oliveira2; Cristiane Flora Villarreal1,2; Francine Johansson Azeredo1,2
1Pharmacy Post Graduate Program, Faculty of Pharmacy, Federal University of Bahia, Salvador, Bahia, Brazil; 2Laboratory of Pharmacokinetics and Pharmacometrics, Faculty of Pharmacy, Federal University of Bahia, Salvador, Bahia, Brazil
Background: Candida albicans infection can lead to changes in pharmacokinetics and tissue penetration of amphotericin B (AmB). This study aimed to evaluate the relationship between total plasma and free kidney concentrations of AmB in healthy and C. albicans‐infected Wistar rats using microdialysis.
Methods: Microdialysis probes recovery rates were determined by dialysis and retrodialysis in vitro, and by retrodialysis in vivo. Concentration versus time profiles and pharmacokinetic parameters were determined for AmB total plasma and free kidney after administration of 2.5 mg/kg i.v. bolus in healthy and C. albicans‐infected rats (n = 6/group), dosing at 0.083, 0.25, 0.5, 1, 1.5, 2, 4, 8, 12, 24, and 36 hours. Analysis of AmB tissue penetration was performed using the ratio between total plasma and kidney, and population pharmacokinetics (popPK) to assess the impact of the infection on pharmacokinetic parameters using Monolix software version 2020R1 (LIXOFT, Paris, France).
Results: The chosen flow rate was set to 1.5 µL/min and there was no statistical difference between the relative recovery values when changing AmB concentrations. The in vivo relative recovery was determined to be 10.9 ± 3.7%. A two‐compartment model with linear elimination and proportional residual error models for plasma total concentration was selected as the final model. There were no statistical differences between the concentrations, typical POPPK parameters, and for the area under the curve (AUC 0‐∞) of plasma and tissue for either healthy or infected animals. The antifungal tissue penetration was 0.77 and 0.71 for healthy and infected animals, respectively. AmB protein binding demonstrates to be dependent of AmB concentration in healthy and infected animals’ plasma.
Conclusion: Plasma levels are a good predictor for AmB kidney concentrations and can be used to optimize its dosing regimen.
226
Expanding the reach of clinical pharmacology and pharmacometrics in Africa: a French‐version of an online training course
Raymond Muganga1; Anna Chan Kwong2; Faith Kiyuka3; Maddlie Bardol2; Paul Baverel4; Julie Bertrand5; Salim Bouchene9; Marylore Chenel2; Emmanuelle Comets5,10; Etienne Dusengeyezu1; Fanny Gallais2; Anaïs Glatard2; Elodie Plan2; Celine Sarr2; Jean‐Louis Steimer6; Paolo Denti2,7; Leon Aarons8; Goonaseelan (Colin) Pillai3,7
1University of Rwanda, Kigali, Rwanda; 2Pharmetheus, Uppsala, Sweden; 3Pharmacometrics Africa NPC, Cape Town, South Africa; 4Molecular Partners, Zurich, Switzerland; 5University of Paris, INSERM, IAME, Paris, France; 6Retired from Novartis, Basel, Switzerland; 7University of Cape Town, Cape Town, South Africa; 8University of Manchester, Manchester, United Kingdom; 9Menarini Ricerchel, Florence, Italy; 10Univ Rennes, Inserm, EHESP, Irset, Rennes, France
Background: Quantitative clinical pharmacology training courses by Pharmacometrics Africa has reached over 350 English‐speaking scientists. During a clinical pharmacokinetics workshop in Rwanda, it was noted that more than 25 % of delegates might have benefitted if French translation was available. This poster aims to describe efforts to expand the on‐line clinical pharmacology and pharmacometrics training to French‐speaking scientists.
Methods: French‐speaking pharmacometricians used the English online course described elsewhere1,2 to set‐up a French version on the Moodle e‐learning platform, substituting pre‐existing French training materials if relevant and available. The English self‐study content pages were transcribed using translation software and finalized by French subject matter experts. Original English lecture slides were used to present a “voice‐over” version in French during a recorded ZOOM meeting. A shared drive facilitated work‐sharing while the course was being developed.
Results: International and Africa‐based clinical pharmacologists participated in the project allowing for mutual sharing of insights for relevant value creation. The time required to set up each week’s lesson on the platform varied depending on the lesson content, e.g., recording didactic lectures tended to take longer than live software demonstrations of modelling. Feedback is that the English version expedited development of the translated course and will guide which content to use or modify for the next version.
Conclusions: A French version has been successfully set up on a Moodle. The initiative will be useful for other translations that are being planned thereby attracting more scientists to the discipline.
REFERENCES
1. Kawuma, et al. An on‐line clinical pharmacology and pharmacometrics training course in Africa: results of a proof‐of‐concept implementation. Poster at WCoP2020.
2. Wenning, L., Pillai, G., Knepper, T.C., Ilic, K., Ali, M.A., & Hibma, J.E. Clinical pharmacology worldwide: A global health perspective. Clin Pharmacol Ther. 110, 946‐951 (2021).
227
Plasma folate levels in acutely ill and steady state pediatric sickle cell disease patients in Ghana
Seth Amponsah 1; Abdul Sulley2; Bamenla Goka3; Christabel Enweronu‐Laryea3; Michael Alifrangis4; Jorgen Kurtzhals4; George Obeng Adjei2
1Department of Medical Pharmacology, University of Ghana Medical School, Accra, Ghana; 2Centre for Tropical Clinical Pharmacology and Therapeutics, University of Ghana Medical School, Accra, Ghana; 3Department of Child Health, University of Ghana Medical School, Accra, Ghana; 4Centre for Medical Parasitology at Department of International Health, Immunology and Microbiology University of Copenhagen and Department of Clinical Microbiology and Department of Infectious Diseases, Copenhagen University Hospital (Rigshospitalet), Copenhagen, Denmark
Background: Individuals with sickle cell disease (SCD) are susceptible to infective conditions that predispose them to hemolysis and anemia. Folic acid is recommended as a preventative measure against anemia in SCD patients; however, there is scarce literature on the implications of this practice.
Methods: Plasma concentrations of folate were measured in acutely ill pediatric SCD patients presenting with malaria or bacteremia and compared with those of SCD patients in steady state (each group on a daily dose of 5 mg of folic acid), or acutely ill non‐SCD patients with confirmed malaria.
The study was approved by the Ethical and Protocol Review Committee, University of Ghana Medical School.
Results: The proportion of individuals with high (> 45.3 nmol/L) folate concentrations was 29.5% (13/44), 18.2% (8/44), 33.3% (6/18), and 0% in the SCD‐malaria, SCD steady state, SCD bacteremia, and the non‐SCD malaria groups, respectively. The proportion of SCD patients with high folate levels did not vary significantly at steady state and during confirmed malaria (P = 0.216), and during acute bacteremia (P = 0.20). The median (interquartile range) plasma folate levels were 34.50 (24.40–52.00 nmol/L), 33.40 (15.83–60.85 nmol/L), 30.85 (24.68–39.65 nmol/L), and 13.30 (10.03–17.18 nmol/L), respectively, in the SCD malaria, SCD bacteremia, SCD steady state, and the non‐SCD malaria sub‐groups. The median folate levels of SCD steady state, SCD malaria, and SCD bacteremia sub‐groups differed significantly (P < 0.0001) when compared with non‐SCD patients, but the levels in the SCD bacteremia and malaria groups were not significantly different from the SCD steady state group.
Conclusion: Elevated levels of plasma folate were found in a high proportion of pediatric SCD patients. The implications of such elevated folate levels in pediatric SCD patients are unknown but may suggest a need for review of current recommendations for prophylactic doses of folic acid in SCD patients.
229
The impact of alcohol consumption on the pharmacokinetics of pyrazinamide in South African patients treated for drug‐sensitive tuberculosis
Marie Wijk 1; Kamunkhwala Gausi1; Tara Carney2; Samantha Malatesta3; Sarah E. Weber3; Frank Kloprogge4; Helen McIlleron1; Richard Court1; Robin M. Warren5; Paolo Denti1; Karen R. Jacobson3
1Division of Clinical Pharmacology, University of Cape Town, Cape Town, South Africa; 2Alcohol, Tobacco and Other Drug Research Unit, South African Medical Research Council, Tygerberg, South Africa; 3Section of Infectious Diseases, Boston University School of Medicine and Boston Medical Center, Boston, Massachusetts, USA; 4Institute for Global Health, University College London, London, UK; 5Department of Science and Innovation, National Research Foundation Centre of Excellence in Biomedical Tuberculosis Research, South Africa Medical Research Council for Tuberculosis Research, Stellenbosch University, Tygerberg, South Africa
Background: Problem alcohol use is known to affect tuberculosis (TB) treatment outcomes, but the underlying mechanisms remain unclear. Pyrazinamide (PZA) is one of four first‐line TB drugs, mainly contributing to shortening TB treatment. We investigated the effect of problem alcohol use on the pharmacokinetics (PK) of PZA.
Methods: Patients receiving first‐line TB treatment within an observational study in Worcester, South Africa who had tested negative for HIV were sampled pre‐dose, and 1.5, 3, 5, and 8 h post‐dose. At treatment initiation, the Alcohol Use Disorders Identification Test (AUDIT) was conducted and phosphatidylethanol (PEth; a biomarker of alcohol consumption) was measured to evaluate the participants’ alcohol use. We used population PK modelling to interpret the data. Alcohol‐related covariates were tested on all PK parameters. Study approval was obtained by the South African Medical Research Council and Boston University Institutional Review Board.
Results: In total, 471 observations from 96 participants were included in the model. The cohort’s median weight was 52 kg (range 31‐80) and 71% (n = 68) were male. The PK of PZA was best described by a one compartment model with transit compartment absorption and first‐order elimination. Clearance (CL) was estimated to be 4.23 L/h. Allometric scaling using fat‐free mass best described the effect of body size on disposition parameters. We observed a higher CL of PZA in participants with higher AUDIT scores, with a 20% lower area under the concentration time curve in participants with higher‐risk alcohol consumption.
Conclusion: We found lower PZA exposure in participants with high‐risk alcohol consumption. The lower drug exposure combined with other behavioral factors may contribute to worse outcomes for persons with problem alcohol use, but further investigation is needed.
231
The increasing challenge of levodopa dosing in Parkinson’s with disease progression: modeling insights
Florence Véronneau‐veilleux 1; Mauro Ursino2; Philippe Robaey3; Fahima Nekka1,4,5
1Université De Montréal, Montréal, QC, Canada; 2University of Bologna, Bologna, Italy; 3University of Ottawa; 4Université de Montréal, Montréal, QC, Canada; 5Centre for Applied Mathematics in Bioscience Medicine (CAMBAM), McGill University, Montréal, QC, Canada
Background: Levodopa is considered the gold standard treatment of Parkinson's disease. Although very effective in alleviating symptoms at their onset, its chronic use with the progressive neuronal denervation in the basal ganglia leads to a decrease in levodopa's effect duration and to the appearance of motor complications. This evolution challenges the establishment of optimal regimens to manage the symptoms as the disease progresses.
Methods: Based on up‐to‐date pathophysiological and pharmacological knowledge, we developed an integrative model for Parkinson's disease to evaluate motor function in response to levodopa treatment as the disease progresses. We combined a pharmacokinetic model of levodopa to a model of dopamine's kinetics and a neurocomputational model of basal ganglia. The dopamine dynamics model describes the release, the recapture by transporters and the removal of dopamine in the synaptic cleft. The model of basal ganglia integrates the 3 main neurotransmission pathways: direct, indirect, and hyperdirect. The parameter values were either measured directly or estimated from data.
Results: The concentrations and behaviors predicted by our model were compared to available information and data. Using this model, we were able to predict levodopa plasma concentration, its related dopamine concentration in the brain and the response performance of a motor task for different stages of disease. A decrease in dopamine is observed when around only 30% of dopaminergic neurons are left in the basal ganglia, which is in line with the late appearance of symptoms.
Conclusion: This model paves the way toward individualization of a dosing regimen. Using sensor based information, the parameters of the model could be fitted to individual data to propose optimal individual regimens.
232
Effect of circadian rhythm on the pharmacokinetics of twice‐daily tacrolimus in renal transplant recipients
Beatriz Fernández 1; Zeyar R. Mohammed Alí1; Pere Fontova2; Anna Vidal‐Alabró2; Marinda Meertens1; Josep Maria Grinyó2; Nuria Lloberas2; Helena Colom1
1Biopharmaceutics and Pharmacokinetics Unit, Department of Pharmacy and Physical Chemistry, School of Pharmacy, University of Barcelona, Barcelona, Spain; 2Nephrology Department, IDIBELL, Hospital Universitari de Bellvitge, Department of Clinical Sciences, Campus Bellvitge, University of Barcelona, Barcelona, Spain
Background: Tacrolimus (Tac) is an immunosuppressant drug with large inter‐ and intraindividual pharmacokinetics (PK) partially explained by the effect of circadian rhythm on drug metabolizing enzymes. This study aimed to develop a population pharmacokinetic (popPK) model to describe the influence of the circadian rhythm on Tac PK in renal transplant patients after a twice‐daily oral immediate‐release (IR) formulation.
Methods: Tac PK profiles of 25 kidney transplant recipients treated with IR‐Tac formulation were simultaneously analyzed. The study was conducted in accordance with the Declaration of Helsinki and with the local ethics committee. A popPK analysis of intensive sampling PK profiles (day and night) was performed using nonlinear mixed‐effects modelling with NONMEM 7.4. Interindividual variability (IIV) and interoccasion variability (IOV) were tested assuming a log‐normal distribution. Circadian rhythm on apparent clearance (CL/F) and absorption rate constant (ka) was analysed during a 24‐hour period.
Results: A two‐compartment model with first‐order absorption, lag‐time, and linear elimination best described the Tac PK. IIV was associated with CL/F, central compartment distribution volume, and ka. The effect of the circadian rhythm modeled as a cosine function, was statistically significant on CL/F and ka (p < 0.005). The goodness of fit plots and the prediction‐corrected visual predictive check proved the descriptive and predictive capacities of the developed model. The model predicted lower CL/F and higher ka values during the day than during the night.
Conclusion: A preliminary popPK model was developed that described the biological variation of Tac PK due to the effect of the circadian rhythm after IR‐Tac twice‐daily administration in renal transplant recipients.
235
Quantification of fetal renal function in a PBPK model using fetal urine production rate during pregnancy
Udoamaka Ezuruike, Alexander Blenkinsop, Amita Pansari and Khaled Abduljalil
Certara UK Ltd, Simcyp Divison, Sheffield, UK
Background: The use of physiologically based pharmacokinetic (PBPK) modelling is a useful approach for predicting human feto‐toxicity risk. Adequate prediction of fetal exposure of drugs excreted by the urine requires the incorporation of time‐varying parameters into the PBPK model. The aim of this study was to derive a function that quantifies changes in FUPR with fetal age as a measure of fetal renal function, and to assess the reflection of FUPR on the creatinine concentration in the amniotic fluid during fetal development.
Methods: Searches for published literature relating to FUPR and creatinine concentration in the amniotic fluid from healthy pregnant women were carried out. From each study, mean and standard deviation (SD) for both parameters at different fetal ages were calculated. Analysis of the data were carried out, with weighted regression parameters found using Excel’s LINEST function.
Results: Measured values of FUPR across different gestational ages using both 3D (n = 538) and 2D (n = 845) ultrasound methods were obtained. Data analysis showed 2D techniques yield estimates of FUPR significantly less than 3D, due to the ovoid assumption for 2D measurements of bladder volume. A power function was shown to best capture the change in FUPR with fetal age for 2D (FUPR2D = FA2.2) and a polynomial function for 3D (FUPR3D = FA4.25) data. An additional function (0.00247 * FA1.94) was derived to transform estimates of FUPR using 2D into more realistic 3D estimates. Finally, the predicted FUPR based on the observed 3D data was shown to be strongly linearly related (R2 = 0.98) to the measured values of amniotic creatinine concentration (n = 664).
Conclusions: FUPR is a reliable measure of fetal renal function and can be used to predict renal clearance of xenobiotics in a PBPK model.
236
Population pharmacokinetic model of methotrexate in Brazilian pediatric patients with acute lymphoblastic leukemia
Pricilla de Oliveira Henz 1; Lauro Gragianin2; Manoela Martins3; Marina Curra3; Bibiana Verlindo de Araújo1; Teresa Cristina Tavares Dalla Costa1
1Faculty of Pharmacy, Federal University of Rio Grande do Sul, Porto Alegre, Brazil; 2Department of Pediatric Oncology, Hospital de Clínicas de Porto Alegre ‐ HCPA, Porto Alegre, Brazil; 3Faculty of Dentistry, Federal University of Rio Grande do Sul, Porto Alegre, Brazil
Background: Methotrexate (MTX), used to treat acute lymphoblastic leukemia, is subject to therapeutic drug monitoring due to its high pharmacokinetic variability1 in patients around the world. The aim is to develop of a population pharmacokinetic (popPK) model of MTX for Brazilian pediatric patients with leukemia who attended at Hospital de Clínicas de Porto Alegre (Brazil).
Methods: Retrospective data were collected from a hospital database between 2015 and 2019 (Ethics Committee # 4.260.110). Model development was performed by NONMEM (Icon®) using ADVAN3 and TRANS4 subroutines and estimation method of SAEM. The evaluation of covariate inclusion, as demographic data, biochemical exams, drug interactions, and 45 genetic variants of genes related to MTX, were automatedly selected by stepwise, in forward inclusion (p < 0.05) and backward elimination (p < 0.01).
Results: A total of 483 data points from 45 patients (0.33–17.83 y.o.) treated with MTX 5 (0.25–5) g/m2 in different cycles were used. A two‐compartment model was built using MTX serum levels having creatinine clearance (crCL), BMI classification according to z‐score for patients bellow ideal body weight, established by WHO2, and a genetic variant rs9930886 of ABCC6 gene as covariates for clearance. The typical estimates are: volume of central and peripheral compartments of 9.85 and 1.46 L; intercompartmental clearance of 0.0596 L/h and clearance described as: CL (L/h) = 3.26 * [(crCL/median) ^ 0.91] * (1–0.161)lowBMI * (1–0.147)var. Inter‐ individual variability and inter‐occasion variability, both for clearance, were 26.4%, and 32.4%. Residual error was 56% and 0.276 mg/L for proportional and additive components. Internal validation was performed by VPC and GOF plots.
Conclusion: A population pharmacokinetic model of MTX was built for pediatric patients, having crCL, a low BMI and the genetic variant rs9930886 of ABCC6 gene as variability sources for clearance.
REFERENCES
Hui, K. H. et al. Population pharmacokinetic study and individual dose adjustments of high‐dose methotrexate in Chinese pediatric patients with acute lymphoblastic leukemia or osteosarcoma. J. Clinical Pharmacol. 59, 566‐ 577 (2019).
Body mass inder‐for‐age (BMI‐for‐age). World Health Organization (WHO) website. https://www.who.int/toolkits/child‐growth‐standards/standards/body‐mass‐index‐for‐age‐bmi‐for‐age. Accessed in October, 2021.
237
Combined molecular fingerprints and CYP3A4 enzyme interaction fingerprints improved CYP induction and inhibition prediction by random Forest machine learning algorithm
Samuel Egieyeh and Elizabeth Egieyeh
School of Pharmacy, University of the Western Cape, Cape Town, South Africa
Background: Many of the current drugs are cytochrome P450 (CYP) inducers, inhibitors, or substrates; thus, investigating potential effect of lead compounds on the CYP‐enzymes during preclinical drug development will alert the drug development team to potential drug‐drug interactions. A number of machine learning models have been developed to predict, to a reasonable level of accuracy, the CYP inhibitory or induction potential of compounds using molecular fingerprints. Here, we present a machine learning algorithm (Random Forest) that predicts CYP3A4 inhibitory or induction potential with up to 90% accuracy using a combination of the structural fingerprints and CYP3A4 enzyme interaction fingerprints.
Methods: Known inhibitors and inducers of CYP3A4 enzyme were collated and virtually screen against the enzyme using Schrodinger Maestro. The interaction fingerprints of the inhibitors and inducers with CYP3A4 were generated and combined with the molecular fingerprints of the same compounds to produce a dataset that was used to build a CYP3A4 inhibitory or induction Random Forest model (M1). Another model (M2) was built using only the molecular fingerprint of the compounds. The models were evaluated with a 10‐fold cross validation and the parameters generated were compared.
Results: The results obtained from the evaluation of the two models (Figure) revealed that M1 had a prediction accuracy of 83.78%, while M2 had a prediction accuracy of 65.91%. M1 outperformed M2 in the prediction of CYP3A4 inhibitory or induction potentials of compounds.
Conclusion: The combination of CYP3A4 enzyme interaction fingerprints and molecular fingerprints in the training set led to a Random Forest model that outperformed the same model built with only the molecular fingerprints.

FIGURE The ROC curve and area under the curve (AUC) of Random Forest model trained with a combination of CYP3A4 enzyme interaction fingerprints and molecular fingerprints (left) and molecular fingerprints alone (right). The accuracy and kappa statistics of the models are inserted into the graphs
239
MBBE analysis to assess the relative bioavailability of valproic acid formulations. Impact of using free versus total plasma concentrations
Alejandra Schiavo 1,2; Manuel Ibarra1; Marta Vázquez1; Pietro Fagiolino1; Iñaki Trocóniz3,4
1Department of Pharmaceutical Sciences, Faculty of Chemistry, Universidad de la República, Montevideo, Uruguay; 2Graduate Program in Chemistry, Faculty of Chemistry, Universidad de la República, Montevideo, Uruguay; 3Pharmacometrics and Systems Pharmacology Research Unit, Department of Pharmaceutical Technology and Chemistry, School of Pharmacy and Nutrition, University of Navarra, Pamplona, Spain; 4IdiSNA; Navarra Institute for Health Research, Pamplona, Spain
Background: Model‐based bioequivalence (MBBE) involves the use of NLME models in the estimation of PK metrics and the corresponding BE endpoints to assess the relative bioavailability between multi‐source drug products. Here, we aimed to compare a MBBE analysis to the traditional approach using data from a single‐dose BE study evaluating a valproic acid (VPA) extended‐release formulation versus the brand‐name delayed‐release product. Further, as VPA exhibits saturable binding to plasma proteins, we sought to evaluate the impact of using total versus free drug concentrations in the BE outcome after single and multiple doses.
Methods: A PopPK model characterizing VPA capacity‐limited binding to plasma proteins was developed in NONMEM describing observed and reported data after single‐ and multiple‐dose, respectively, and implemented to compute simulated free and total AUC and Cmax for both formulations under both scenarios using a richer sampling design. BE endpoints were estimated from simulated data. The MBBE analysis was done using PsN and ncappc R‐package.1,2 The type 1 error of the method was assessed.
Results: MBBE and NCA showed similar BE results when simulations were constrained to the original sampling design. MBBE was superior in detecting formulation‐related differences when PK endpoints were computed from richer simulations. According to the predictions, it is no possible conclude BE between Test and Reference formulations still in multiple‐dose scenario. Analysis of unbound concentrations was more sensitive in detecting formulation‐related differences in Cmax.
Conclusion: This work provides a methodology for BE assessment under MBBE and shows how BE conclusions might differ using free vs total concentrations.
REFERENCES
Keizer R.J. et. al. Modeling and simulation workbench for NONMEM: Tutorial on Pirana, PsN, and Xpose. CPT: Pharmacometrics & Systems Pharmacology 2, e50 (2013).
Acharya, C. et. al. A diagnostic tool for population models using non‐compartmental analysis: The ncappc package for R. Comp Method Prog Biomed. 127, 83‐93 (2016).
240
Physiologically based biopharmaceutics modeling to predict omeprazole bioavailability from enteric‐coated microgranules
Yessica Imbriago, Alejandra Schiavo, Andres Baptista, Marianela Lorier, Marta Vázquez, Cecilia Maldonado, Manuel Ibarra
Biopharmacy and Therapeutics Area, Department of Pharmaceutical Sciences, Faculty of Chemistry, University of the Republic, Montevideo, Uruguay
Background: Omeprazole (OMP) a widely used proton pump inhibitor, is commercialized as capsules containing enteric‐coated microgranules due to its liability at acidic conditions. The increase in gastric pH under chronic treatment with OMP can affect the enteric‐coating performance, therefore leading to lower oral bioavailability. The aim of this work is to predict OMP relative bioavailability between multi‐source products after single and multiple doses by integrating biorelevant in vitro assays in a semi‐PBPK model.
Methods: In vitro assays were performed in an I‐USP Apparatus including an acid stage and a second neutral stage. Two different acid stages were tested to simulate the single‐ (pH = 1.2) and the multiple‐dose (pH = 4.0). Resistance of the enteric coating at increasing pH (3 to 5) was tested with a flow‐through cell dissolution apparatus. A semi‐PBPK model for OMP was developed using Simulx® (Lixoft, France), adapting and re‐evaluating a previously reported PBPK model.1 In vitro dissolution data for the 2 multi‐source products (A and B) showing higher in vitro differences was fitted and integrated in the semi‐PBPK model to predict the relative bioavailability after single and multiple oral dose (20mg/24 h).
Results: In vitro assays showed significant dissolution rates between 11 tested products under both scenarios. Differences were also found in the enteric coating performance, with some products releasing OMP at a pH of 3. The semi‐PBPK model was validated using external PK data for i.v. and oral administrations. In vivo PK profiles for A and B were simulated predicting significant differences after multiple doses.
Conclusion: A semi‐PBPK model integrating in vitro data was developed to predict relative bioavailability between 2 multi‐source products after single and multiple doses for OMP.
REFERENCE
Wu, F. et al. Predicting nonlinear pharmacokinetics of omeprazole enantiomers and racemic drug using physiologically based pharmacokinetic modeling and simulation: Application to predict drug/genetic interactions. Pharm Res. 31, 1919–1929 (2014).
242
Dolutegravir pharmacokinetics in patients receiving standard and higher doses of rifampicin
Allan Kengo 1; Ruth Nabisere2; Kamunkhwala Gausi1; Joseph Musaazi2; Allan Buzibye2; Rob Aarnoutse3; Mohammed Lamorde2; Kelly E Dooley4; Derek James Sloan5; Paolo Denti1; Christine Sekaggya‐Wiltshire2
1Division of Clinical Pharmacology, Department of Medicine, University Of Cape Town, Cape Town, South Africa; 2Infectious Disease Institute, College of Health Sciences, Makerere University, Kampala, Uganda; 3Department of Pharmacy, Radboud University Medical Center, Nijmegen, The Netherlands; 4Division of Clinical Pharmacology, Department of Medicine, Johns Hopkins University, Baltimore, MD, USA; 5Division of Infection and Global Health, School of Medicine, University of St. Andrews, St. Andrews, UK
Background: Growing evidence suggests that higher doses of rifampicin (RIF) may improve tuberculosis (TB) treatment outcomes. Higher RIF exposure may exacerbate drug‐drug interactions with anti‐retroviral therapy (ART). We aimed to compare the pharmacokinetics (PK) of dolutegravir (DTG) when co‐administered with higher versus standard dose RIF in HIV patients with TB.
Methods: Newly diagnosed TB patients with HIV were randomized to receive first‐line TB treatment with either standard 10 mg/kg (10RHZE) or 35 mg/kg RIF dose (35RHZE) (IRB JC2218). DTG (50 mg twice daily) based ART was started 2 weeks later in those who were ART naïve as per guidelines. PK sampling was done after > 4 weeks of ART, at pre‐dose, 1, 2, 4, and 8 h after dose. Population PK modelling was used to describe the data. DTG trough concentrations (C12h) were simulated using in silico cohort of 13,475 TB patients and compared to the therapeutic targets of 0.31 mg/L and 0.064 mg/L1.
Results: Data from 44 participants (212 samples) were included in the analysis, 28 were male, and 19 were on 35RIF. Their median (IQR) weight and age were 55.6 kg (46.9‐61.0) and 36 years (31‐43) respectively. One‐compartment disposition model with transit compartment absorption and allometric scaling by fat‐free mass best described DTG PK. The typical value of clearance and volume were 1.82 L/h and 11.9 L respectively. 35RHZE reduced DTG bioavailability by 29.6%. Model‐simulated C12h showed that the probability to attain 0.31 mg/L would decrease from 89.1% in 10RHZE to 82.5% in the 35RHZE cohort. Using the 0.064 mg/L target, the same probabilities decrease from 99.0% to 98.5%.
Conclusions: Coadministration of DTG with 35RHZE further reduces its exposure compared to 10RHZ. It is unclear whether this reduction in exposure will have an impact on viral suppression.
REFERENCE
1. Min, S., et al. Pharmacokinetics and safety of S/GSK1349572, a next‐generation HIV integrase inhibitor, in healthy volunteers. Antimicrob Agents Chemother. 54, 254‐258 (2010).
243
The African applied pharmacometrics training fellowship: skills development linked to job creation
Rik de Greef 1; Craig Rayner1; Matthew Jaffe1; Goonaseelan (Colin) Pillai1,2,3
1Certara, Inc, USA; 2Pharmacometrics Africa NPC, Cape Town, South Africa; 3University of Cape Town, Division of Clinical Pharmacology, Department of Medicine, Cape Town, South Africa
Background: Pharmacometrics training for African scientists have ranged from short courses on basic principles to doctoral level programs.1 Building on this, the Applied Pharmacometrics Training Fellowship in Africa is a post‐graduate level program for advanced skills training required for regulatory quality analyses and reporting.
The purpose of this paper is to describe the strategy, tactics and curriculum with a view to inviting comment, critique and collaboration.
Methods: The fellowship comprises of a 12‐week virtual program with self‐learning exercises, live tutorials, and model‐based data analyses. Subsequently, fellows have the option to continue for another 12‐weeks on‐site immersion program of model‐based analysis under the mentorship of experienced pharmacometricians. Some of the successful fellows will be invited to form the first Certara consulting team located in Africa, while others will be absorbed into local research centres. The entire program is overseen and conducted by academic, pharma and product development partners. The structured virtual learning curriculum and real‐life research datasets expose fellows to model‐based analyses and applications in drug development. Fellows work on assignments that reinforce themes of scientific leadership and teamwork, while their mentors gain insights into healthcare needs in traditionally underserved African settings.
Results: After an open call, applications from mainly doctoral level scientists with clinical backgrounds underwent a rigorous, competitive selection process for the virtual program scheduled to commence in 1Q2022. The curriculum and program structure are presented for comment and critique.
Conclusions: A fellowship program in pharmacometrics in Africa leading to local job creation has been developed and is expected to advance innovative biosimulation applications for global benefit.
ACKNOWLEDGMENTS
The authors would like to acknowledge the contributions of Felix Boakye‐Agyeman, Amy Cheung, Mike Dodds, Vincent Duval, Richard Franzese, Petra Jauslin, Anna Largajolli, Rita Michel, Adekemi Taylor, Gerly van der Vleuten, and Nolan Wood in the development of the training program content.
REFERENCE
Wenning, L., Pillai, G., Knepper, T.C., Ilic, K., Ali, M.A., & Hibma, J.E. Clinical pharmacology worldwide: A global health perspective. Clin Pharmacol Ther. 110, 946‐951 (2021).
245
Influence of CYP2B6 single nucleotide polymorphisms (SNP) on the apparent oral clearance of efavirenz among people living with HIV in Nigeria
Jacinta Nwogu 1,2; Adeniyi Olagunju2; Chinedum P. Babalola1; Laura Dickinson Dickinson2
1Department of Pharmaceutical Chemistry, Faculty of Pharmacy, University of Ibadan, Ibadan, Nigeria; 2Department of Pharmacology and Therapeutics, University of Liverpool, Liverpool, UK
Background: Efavirenz (EFV) is recommended as a component of alternative first‐line regimens for HIV treatment. EFV pharmacokinetics (PK) is largely influenced by single nucleotide polymorphisms (SNPs) in CYP2B6. However, there are limited data on the effect of these SNPs on efavirenz PK among Nigerians living with HIV. The aim of this study was to estimate the population apparent oral clearance (CL/F) of EFV and determine the influence of CYP2B6 SNPs on EFV CL/F among Nigerian people living with HIV.
Methods: Dried blood spots (DBS) were collected from HIV‐positive adults receiving 600mg EFV once daily (n = 93, 70.3% female). EFV was quantified in DBS using LC‐MS/MS while CYP2B6 genotyping was carried out using TaqMan SNP genotyping assays. Plasma EFV concentrations were then calculated using a previously validated equation [DBS[EFV]/(1‐hematocrit)*protein binding]. Calculated plasma concentrations were used to develop an EFV population PK model using nonlinear mixed‐effects modeling (NONMEM v. 7.4.1). Ethical approval for this study was obtained from joint UI/UCH ethical review board, University of Ibadan, Nigeria.
Results: EFV concentrations over time were described by a 1 compartment model. Concentrations ranged between 447‐15,592 ng/mL taken over 8‐16 hours post dose. EFVCL/F in the base model was 8.96L/h with between subject variability of 58% and 20% of the variability was explained by the inclusion composite (516G > T plus 983T > C) genotype. CL/F decreased by 15.8% in intermediate compared to extensive metabolizers and decreased by 65.4% in slow metabolizers compared to extensive (Table).
Conclusion: Genetic influence on CL/F of EFV was established among Nigerian population living with HIV using population pharmacokinetic modelling.