

Abstract
Introduction
Posterior superior alveolar artery (PSAA) is a major part of the circulation of the sinus floor. This study aimed to analyze the anatomy of PSAA in an Iranian population for the first time.
Methods
This study was performed on coronal CBCT slices of 400 hemimaxillae (1598 slices through premolar and molar areas), to evaluate the PSAA’s prevalence, diameter, and its vertical distances from the sinus floor and the alveolar ridge. Potential associations between anatomical properties with age, gender, and maxilla sides were assessed statistically (α = 0.05, 0.0125).
Results
The PSAA was detected in 73.2% of all slices (58.5%, 79.6%, 71.5%, and 83.0%, in P1–M2 areas, respectively). The mean PSAA diameter was 0.83 ± 0.33 mm (95% CI 0.81–0.85; 0.96, 0.85, 0.80, and 0.74 mm, in P1–M2 areas, respectively). Canals > 2 mm in diameter were seen only in M1 (0.4%) and M2 (0.9%) areas.
Conclusions
PSAA diameters were smaller in this population than all others, with very few large canals available. Although the average diameter increased in the anterior regions, large canals were not present in these regions. Males tended to have larger PSAAs. Age might not change canal parameters. Gender might affect canal diameter. Right/left sides are similar.
Keywords: Posterior superior alveolar artery (PSAA), Anatomy, Maxillary sinus, Sinus floor elevation
Introduction
The posterior superior alveolar artery (PSAA) can be damaged during a number of procedures such as surgeries of Lefort 1 fractures, maxillary sinus augmentation, removal of lesions and infections from the maxillary sinus, orthognathic surgeries, and dental implantation [1]. Damage to this artery is not threatening in the sinus augmentation procedure, but the resulted bleeding interferes with graft placement and the observation of the Schneiderian membrane during surgery, especially if the diameter of the artery is greater than 2 mm [2]. There have also been reports of severe hemorrhage [3]. The diameter of this artery (reported between 0.4 and 2.8 mm) is directly associated with the severity of bleeding in the sinus surgery [4, 5].
The prevalence, diameter, and route of these arteries can vary significantly [4, 6]; these differences can reduce the predictability of the artery’s anatomy and thus increase the risk of damage. The best method to prevent surgical complications and provide the best treatment plan may be taking cone-beam computerized tomography (CBCT) to determine the location and characteristics of important anatomical landmarks before surgery [4, 5, 7, 8]. Another way is to document the anatomical properties of this artery in different populations in order to aid the clinician with decision making in advance. We aimed to investigate the prevalence and anatomy of this canal.
Materials and Methods
This retrospective cross-sectional study was performed on 400 CBCT hemimaxilla volumes of 226 patients who had retrospectively undergone CBCT imaging at the Oral and Maxillofacial Radiology Department, only for treatment purposes. The protocol ethics were approved by the research committee of the university, in accordance with the Helsinki Declaration. The sample size was determined as 385 hemimaxillae, based on the minimum radiologic prevalence of PSAA in the literature (i.e., 50%) which was necessary for calculating the maximum sample size, and a precision of d = 0.05 at a 95% level of confidence. In order to improve the accuracy, the sample size was augmented to 400 hemimaxillae.
CBCT Scans of Subjects
The cases were sampled randomly from the archive of existing CBCT volumes at the department, until reaching the desired sample size. The inclusion criteria were the availability of full patient records, and CBCTs that had been taken using the same scanner (NewTom VG, Italy) set at the high-resolution mode and fields of view (FOVs) of 8 × 8 and 8 × 12 mm2, at a kVp of 110 V, and with a shooting time of 5.4 s. The exclusion criteria comprised poor-quality or artifact-included scans, pathological lesions disrupting normal sinus anatomy, periodontal lesions with severe bone resorptions, sclerosis of sinus walls, and a history of previous surgery in maxillary sinus [7].
Measurements
A trained radiologist assessed the presence of PSAA on coronal slices of the lateral wall of maxillary sinus that passed through the premolar and molar areas (four slices per quadrant); these areas were determined by ensuring the presence of radicular apexes of premolars and palatal apexes of molars when the teeth were present. If the area was edentulous, the area was determined based on the distances from the anterior and posterior teeth as well as overall anatomical assessment of the alveolar bone. The following parameters were as well evaluated on each of the four dental areas: (A) The PSAA canal diameter was measured separately in coronal slices. This variable was used both as a continuous parameter and as a variable categorized into three groups: (1) diameters below 1 mm, (2) diameters between 1 and 2 mm, and (3) diameters greater than 2 mm [4]. (B) The vertical distances between the inferior border of the canal with the alveolar crest and (C) the sinus floor [8] were measured as well (Fig. 1).
Fig. 1.
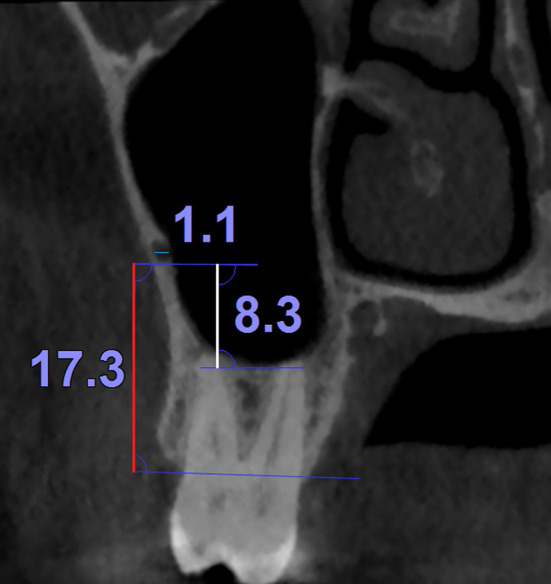
An example of the continuous measurements used in this study (i.e., the distances between the inferior border of the PSAA canal with the alveolar crest and the sinus floor [vertical measurements] as well as the PSAA canal diameter [the short horizontal line]) on a coronal section of the maxilla
Method Error
All the three continuous measurements of the four areas (a total of 12 variables) in 40 bilateral hemimaxillae of 20 patients were reexamined by another maxillofacial radiologist. The measurements were used to estimate the interobserver reliability. The resulted intraclass correlation coefficients ranged between 95 and 99% (all the 12 P values = 0.000) indicating excellent interobserver agreements.
Statistical Analysis
Descriptive statistics and 95% confidence intervals (CI) were calculated. The data were analyzed using a χ2, a Pearson correlation coefficient, a partial correlation coefficient, an independent-samples t test, and a repeated-measures two-way analysis of covariance (ANCOVA) of SPSS 25 (IBM, Armonk, NY, USA). The level of significance was set at 0.05 for the ANCOVA and correlation coefficients; it was adjusted using the Bonferroni method to 0.0125 for the t and χ2 tests used for multiple comparisons.
Results
The mean (SD) age of patients was 43.8 ± 14.65 years old (minimum 10, Q1 33.5, median 42, Q3 55, maximum 82 years). Of the 225 patients, 132 (58.7%) were females. Overall, the PSAA canal was detected in 73.2% of all the four areas in all patients, regardless of the evaluated area (1169 of all the 1598 assessments). There were 230 edentulous regions among the 1169 areas in which the canal was observed.
Also 67.4%, 32.2%, and 0.3% of 1169 canal sections had diameters below 1 mm, between 1 and 2 mm, and above 2 mm, respectively. The mean (SD) diameter of these 1169 canal sections was 0.83 ± 0.33 mm (95% CI 0.81–0.85, minimum 0.2 mm, maximum 2.5 mm). The mean (SD) of the distance between the canal and alveolar ridge in all the 1169 slices was 19.87 ± 5.72 mm (95% CI 19.54–20.20, minimum 0.7 mm, maximum 36.8 mm). The mean (SD) distance between the canal and the sinus floor in all the 1169 sections was 6.29 ± 4.59 mm (95% CI 6.03–6.56, minimum 0, maximum 29.0 mm).
In the first premolar area, the canal existed in 234 out of 400 quadrants (58.5%, 95% CI 53.6–63.2). Of these, 124 (53%) and 110 (47%) were, respectively, ‘smaller than 1 mm’ and ‘between 1 and 2 mm’ in diameter.
In the second premolar area, the canal was present in 317 out of 398 evaluated quadrants (79.6%, 95% CI 75.4–83.3). Of these, 202 (63.7%) and 115 (36.3%) were ‘smaller than 1 mm’ and ‘between 1 and 2 mm’ in diameter, respectively.
In the first molar area, 286 out of 400 quadrants (71.5%, 95% CI 66.9–75.7) had detectable canals, with 196 (68.5%), 89 (31.1%), and 1 (0.3%) canals having diameters below 1 mm, between 1 and 2 mm, and above 2 mm, respectively.
There were 332 canals in 400 quadrants (83.0%, 95% CI 79.0–86.4) in the proximity of apices of the first molars. The statistics pertaining to canals ‘smaller than 1 mm,’ ‘between 1 and 2 mm,’ and ‘larger than 2 mm’ were, respectively, 266 (80.1%), 63 (19.0%), and 3 (0.9%).
Unilateral Versus Bilateral Canals
Of the included patients, 174 had both maxillary quadrants. The mean (SD) age of these patients was 44.2 ± 15.0 years old (minimum 14, Q1 33.8, median 44, Q3 55, maximum 82 years). Of them, 103 (59.2%) were females. Among these 174 patients, 63 (36.2%) did not have any detectable canals, 25 (14.4%) had unilateral canals, and 86 (49.4%) had bilateral canals in the first premolar area. In the second premolar area, 18 patients (10.3%) showed no detectable canals, while 38 (21.8%) had unilateral detectable canals, and 118 (67.8%) had bilateral canals. In the first molar area, 25 (14.4%), 55 (31.6%), and 94 (54.0%) patients had no, unilateral, and bilateral detectable canals, respectively. In the second molar proximity, these statistics were 18 (10.3%), 27 (15.5%), and 129 (74.1%) patients for no, unilateral, and bilateral detectable canals, respectively.
The Role of Potential Risk Factors
According to the χ2 test, there were no significant differences between the distributions of canals in the left versus right sides (Table 1). However, this test detected significant differences between the presence of canals in males versus females, in the proximity of three teeth (Table 2). As well, the prevalences of different sizes of canals differed significantly between males and females, around all four teeth (Table 2).
Table 1.
Contingency tables presenting net (and %) distributions of canal presence and its diameters across the left and right sides of the maxilla, evaluated in the premolar and molar areas, as well as the results of the χ2 test comparing left versus right sides (α = 0.0125)
| Area | Side | Canal presence | P | Categorized Canal Diameter | P | |||||
|---|---|---|---|---|---|---|---|---|---|---|
| No | Yes | Total | < 1 mm | 1–2 mm | > 2 mm | Total | ||||
| First premolar | Right | 77 (19.3) | 123 (30.8) | 200 (50.1) | 0.2073 | 58 (24.9) | 65 (27.9) | 0 | 123 (52.8) | 0.0685 |
| Left | 89 (22.3) | 110 (27.6) | 199 (49.9) | 65 (27.9) | 45 (19.3) | 0 | 110 (47.2) | |||
| Total | 166 (41.6) | 233 (58.4) | 399 (100) | 123 (52.8) | 110 (47.2) | 0 | 233 (100) | |||
| Second premolar | Right | 37 (9.3) | 162 (40.8) | 199 (50.1) | 0.3696 | 97 (30.7) | 65 (20.6) | 0 | 162 (51.3) | 0.1574 |
| Left | 44 (11.1) | 154 (38.8) | 198 (49.9) | 104 (32.9) | 50 (15.8) | 0 | 154 (48.7) | |||
| Total | 81 (20.4) | 316 (79.6) | 397 (100) | 201 (63.6) | 115 (36.4) | 0 | 316 (100) | |||
| First molar | Right | 53 (13.3) | 147 (36.8) | 200 (50.1) | 0.3585 | 102 (35.8) | 44 (15.4) | 1 (0.4) | 147 (51.6) | 0.5645 |
| Left | 61 (15.3) | 138 (34.6) | 199 (49.9) | 93 (32.6) | 45 (15.8) | 0 | 138 (48.4) | |||
| Total | 114 (28.6) | 285 (71.4) | 399 (100) | 195 (68.4) | 89 (31.2) | 1 (0.4) | 285 (100) | |||
| Second molar | Right | 29 (7.3) | 171 (42.9) | 200 (50.1) | 0.1757 | 134 (40.5) | 36 (10.9) | 1 (0.3) | 171 (51.7) | 0.5250 |
| Left | 39 (9.8) | 160 (40.1) | 199 (49.9) | 131 (39.6) | 27 (8.2) | 2 (0.6) | 160 (48.3) | |||
| Total | 68 (17) | 331 (83) | 399 (100) | 265 (80.1) | 63 (19) | 3 (0.9) | 331 (100) | |||
Table 2.
Contingency tables presenting net (and %) distributions of canal presence and its diameters across the genders, evaluated in the premolar and molar areas, as well as the results of the χ2 test comparing the sexes in terms of existence of detected canal and its diameter (α = 0.0125)
| Area | Sex | Canal presence | P | Categorized canal diameter | P | |||||
|---|---|---|---|---|---|---|---|---|---|---|
| No | Yes | Total | < 1 mm | 1–2 mm | > 2 mm | Total | ||||
| First premolar | Male | 76 (19) | 89 (22.3) | 165 (41.3) | 0.1209 | 40 (17.1) | 49 (20.9) | 0 | 89 (38) | 0.0533 |
| Female | 90 (22.5) | 145 (36.3) | 235 (58.8) | 84 (35.9) | 61 (26.1) | 0 | 145 (62) | |||
| Total | 166 (41.5) | 234 (58.5) | 400 (100) | 124 (53) | 110 (47) | 0 | 234 (100) | |||
| Second premolar | Male | 25 (6.3) | 138 (34.7) | 163 (41) | 0.0385 | 75 (23.7) | 63 (19.9) | 0 | 138 (43.5) | 0.0023 |
| Female | 56 (14.1) | 179 (45) | 235 (59) | 127 (40.1) | 52 (16.4) | 0 | 179 (56.5) | |||
| Total | 81 (20.4) | 317 (79.6) | 398 (100) | 202 (63.7) | 115 (36.3) | 0 | 317 (100) | |||
| First molar | Male | 34 (8.5) | 131 (32.8) | 165 (41.3) | 0.0034 | 76 (26.6) | 54 (18.9) | 1 (0.3) | 131 (45.8) | 0.0015 |
| Female | 80 (20) | 155 (38.8) | 235 (58.8) | 120 (42) | 35 (12.2) | 0 | 155 (54.2) | |||
| Total | 114 (28.5) | 286 (71.5) | 400 (100) | 196 (68.5) | 89 (31.1) | 1 (0.3) | 286 (100) | |||
| Second molar | Male | 21 (5.3) | 144 (36) | 165 (41.3) | 0.0566 | 102 (30.7) | 40 (12) | 2 (0.6) | 144 (43.4) | 0.0010 |
| Female | 47 (11.8) | 188 (47) | 235 (58.8) | 164 (49.4) | 23 (6.9) | 1 (0.3) | 188 (56.6) | |||
| Total | 68 (17) | 332 (83) | 400 (100) | 266 (80.1) | 63 (19) | 3 (0.9) | 332 (100) | |||
Patients’ age and sex were correlated with each other according to the point-biserial coefficient (P = 0.005). Therefore, a partial correlation coefficient was used to assess the correlations between ages with other parameters, controlling for the effect of sex. The test did not detect significant partial correlations between any of the parameters and patients’ ages, except for canal diameter in the second molar area which showed a statistically significant but very weak correlation (r = 0.225, P = 0.006).
There were no significant differences between the prevalence of unilateral canals in males versus females, in the proximity of either of the teeth (all the four χ2 P values > 0.05).
There were significant and marginally significant differences between males and females in terms of canal diameters and in fewer cases, in terms of the distances between the PSAA with the alveolar ridge or the sinus floor (Table 3). Between the right and left sides, there was no significant difference in terms of any of the three continuous variables (Table 4).
Table 3.
Statistics pertaining to the canal diameter as well as the vertical distances from the inferior border of the canal to the sinus floor and the alveolar crest, in the vicinity of the apices of the maxillary premolars and molars
| Area | Parameter | Sex | N | Mean | SD | 95% CI | Min | Max | P | |
|---|---|---|---|---|---|---|---|---|---|---|
| P1 | Canal diameter | Male | 89 | 1.01 | 0.33 | 0.94 | 1.08 | 0.3 | 1.8 | 0.0375 |
| Female | 145 | 0.92 | 0.33 | 0.87 | 0.97 | 0.3 | 1.8 | |||
| Total | 234 | 0.96 | 0.33 | 0.91 | 1.00 | 0.3 | 1.8 | |||
| Canal–alveolar crest distance | Male | 89 | 24.61 | 5.24 | 23.51 | 25.72 | 10.7 | 36.2 | 0.0135 | |
| Female | 145 | 26.10 | 3.85 | 25.47 | 26.73 | 14.8 | 33.6 | |||
| Total | 234 | 25.53 | 4.48 | 24.96 | 26.11 | 10.7 | 36.2 | |||
| Canal–sinus floor distance | Male | 89 | 4.20 | 4.66 | 3.21 | 5.18 | 0.0 | 24.5 | 0.6746 | |
| Female | 145 | 3.94 | 4.54 | 3.19 | 4.68 | 0.0 | 17.1 | |||
| Total | 234 | 4.03 | 4.58 | 3.44 | 4.62 | 0.0 | 24.5 | |||
| P2 | Canal diameter | Male | 138 | 0.91 | 0.34 | 0.86 | 0.97 | 0.2 | 1.9 | 0.0008 |
| Female | 179 | 0.79 | 0.30 | 0.75 | 0.84 | 0.3 | 1.7 | |||
| Total | 317 | 0.85 | 0.32 | 0.81 | 0.88 | 0.2 | 1.9 | |||
| Canal–alveolar crest distance | Male | 138 | 20.73 | 5.69 | 19.77 | 21.69 | 9.6 | 35.4 | 0.6909 | |
| Female | 179 | 20.98 | 5.49 | 20.17 | 21.79 | 2.0 | 35.1 | |||
| Total | 317 | 20.87 | 5.57 | 20.26 | 21.49 | 2.0 | 35.4 | |||
| Canal–sinus floor distance | Male | 138 | 5.83 | 5.00 | 4.99 | 6.67 | 0.0 | 29.0 | 0.4791 | |
| Female | 179 | 5.47 | 4.10 | 4.86 | 6.07 | 0.0 | 20.8 | |||
| Total | 317 | 5.62 | 4.51 | 5.13 | 6.12 | 0.0 | 29.0 | |||
| M1 | Canal diameter | Male | 131 | 0.87 | 0.31 | 0.82 | 0.93 | 0.3 | 2.1 | 0.0001 |
| Female | 155 | 0.73 | 0.31 | 0.68 | 0.78 | 0.2 | 1.6 | |||
| Total | 286 | 0.80 | 0.32 | 0.76 | 0.83 | 0.2 | 2.1 | |||
| Canal–alveolar crest distance | Male | 131 | 17.05 | 4.13 | 16.34 | 17.77 | 8.0 | 36.8 | 0.1803 | |
| Female | 155 | 16.35 | 4.65 | 15.61 | 17.09 | 0.7 | 32.4 | |||
| Total | 286 | 16.67 | 4.43 | 16.15 | 17.19 | 0.7 | 36.8 | |||
| Canal–sinus floor distance | Male | 131 | 7.55 | 4.74 | 6.73 | 8.37 | 0.0 | 28.8 | 0.0217 | |
| Female | 155 | 6.39 | 3.82 | 5.78 | 6.99 | 0.0 | 16.8 | |||
| Total | 286 | 6.92 | 4.30 | 6.42 | 7.42 | 0.0 | 28.8 | |||
| M2 | Canal diameter | Male | 144 | 0.81 | 0.33 | 0.76 | 0.87 | 0.2 | 2.1 | 0.0002 |
| Female | 188 | 0.68 | 0.29 | 0.64 | 0.73 | 0.2 | 2.5 | |||
| Total | 332 | 0.74 | 0.32 | 0.71 | 0.78 | 0.2 | 2.5 | |||
| Canal–alveolar crest distance | Male | 144 | 18.28 | 3.93 | 17.63 | 18.92 | 1.0 | 28.6 | 0.0243 | |
| Female | 188 | 17.23 | 4.34 | 16.61 | 17.86 | 6.5 | 30.6 | |||
| Total | 332 | 17.69 | 4.19 | 17.23 | 18.14 | 1.0 | 30.6 | |||
| Canal–sinus floor distance | Male | 144 | 8.88 | 4.31 | 8.17 | 9.59 | 0.00 | 25.40 | 0.0005 | |
| Female | 188 | 7.30 | 3.83 | 6.75 | 7.86 | 0.00 | 21.90 | |||
| Total | 332 | 7.99 | 4.12 | 7.54 | 8.43 | 0.00 | 25.40 | |||
Sexual dimorphism is assessed using the independent-samples t test (α = 0.0125)
SD standard deviation, CI confidence interval, Min minimum, Max maximum, P1 the first premolar, P2 the second premolar, M1 the first molar, M2 the second molar
Table 4.
Comparisons between the right and left maxilla sides in terms of the variables ‘canal diameter as well as the vertical distances from the inferior border of the canal to the sinus floor and the alveolar crest,’ using the independent-samples t test (α = 0.0125)
| Area | Parameter | Side | N | Mean | SD | 95% CI | Min | Max | P | |
|---|---|---|---|---|---|---|---|---|---|---|
| P1 | Canal diameter | Right | 123 | 0.99 | 0.33 | 0.93 | 1.05 | 0.3 | 1.8 | 0.1044 |
| Left | 110 | 0.92 | 0.33 | 0.86 | 0.98 | 0.3 | 1.8 | |||
| Canal–alveolar crest distance | Right | 123 | 25.07 | 4.87 | 24.20 | 25.94 | 10.7 | 36.2 | 0.1182 | |
| Left | 110 | 25.98 | 3.91 | 25.24 | 26.72 | 14.8 | 35.8 | |||
| Canal–sinus floor distance | Right | 123 | 4.18 | 4.62 | 3.36 | 5.01 | 0.0 | 17.1 | 0.6515 | |
| Left | 110 | 3.91 | 4.55 | 3.05 | 4.77 | 0.0 | 24.5 | |||
| P2 | Canal diameter | Right | 162 | 0.89 | 0.32 | 0.84 | 0.94 | 0.2 | 1.9 | 0.0140 |
| Left | 154 | 0.80 | 0.31 | 0.75 | 0.85 | 0.2 | 1.5 | |||
| Canal–alveolar crest distance | Right | 162 | 20.42 | 6.00 | 19.49 | 21.36 | 2.0 | 35.4 | 0.1556 | |
| Left | 154 | 21.31 | 5.06 | 20.51 | 22.12 | 10.7 | 35.1 | |||
| Canal–sinus floor distance | Right | 162 | 5.54 | 4.75 | 4.80 | 6.27 | 0.0 | 29.0 | 0.7397 | |
| Left | 154 | 5.71 | 4.28 | 5.02 | 6.39 | 0.0 | 20.8 | |||
| M1 | Canal diameter | Right | 147 | 0.82 | 0.31 | 0.77 | 0.87 | 0.3 | 2.1 | 0.3392 |
| Left | 138 | 0.78 | 0.32 | 0.73 | 0.83 | 0.2 | 1.6 | |||
| Canal–alveolar crest distance | Right | 147 | 16.83 | 4.63 | 16.08 | 17.59 | 1.1 | 36.8 | 0.4849 | |
| Left | 138 | 16.47 | 4.21 | 15.76 | 17.17 | 0.7 | 32.4 | |||
| Canal–sinus floor distance | Right | 147 | 7.35 | 4.50 | 6.62 | 8.09 | 0.0 | 28.8 | 0.0689 | |
| Left | 138 | 6.43 | 4.04 | 5.75 | 7.11 | 0.0 | 19.5 | |||
| M2 | Canal diameter | Right | 171 | 0.75 | 0.31 | 0.71 | 0.80 | 0.2 | 2.5 | 0.5299 |
| Left | 160 | 0.73 | 0.33 | 0.68 | 0.78 | 0.2 | 2.1 | |||
| Canal–alveolar crest distance | Right | 171 | 17.44 | 3.93 | 16.84 | 18.03 | 6.5 | 29.4 | 0.2964 | |
| Left | 160 | 17.92 | 4.44 | 17.22 | 18.61 | 1.0 | 30.6 | |||
| Canal–sinus floor distance | Right | 171 | 7.82 | 3.97 | 7.22 | 8.42 | 0.0 | 25.4 | 0.4003 | |
| Left | 160 | 8.20 | 4.26 | 7.54 | 8.87 | 0.0 | 21.9 | |||
SD standard deviation, CI confidence interval, Min minimum, Max maximum, P1 the first premolar, P2 the second premolar, M1 the first molar, M2 the second molar
Patterns of Alterations in the PSAA Anatomy
Canal diameter
The repeated-measures two-way ANCOVA showed a significant increase in canal diameter on its path from the second molar area to the first premolar area (P = 0.004, Fig. 2). The association between age and canal diameter was marginally significant (P = 0.084), while the role of sex was significant (P = 0.001, Fig. 3). All interactions were non-significant (P > 0.1).
The distance between the alveolar ridge and the PSAA
Fig. 2.

Estimated marginal means (and 95% CI) of the PSAA canal diameters at different anatomical areas of males and females aged 45.4 years old. P1, the first premolar; P2, the second premolar; M1, the first molar; M2, the second molar
Fig. 3.
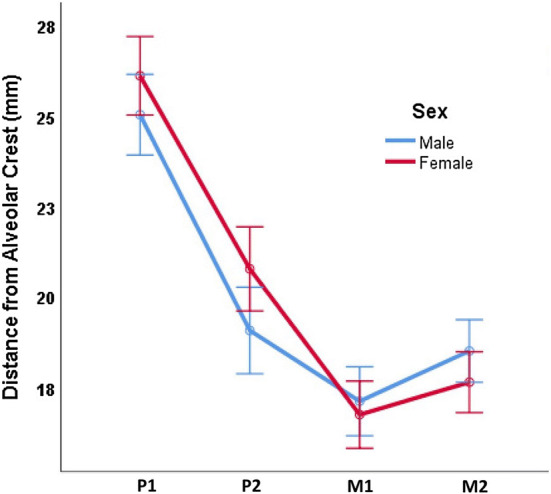
Estimated marginal means (and 95% CI) of the distances between the inferior border of the PSAA canal and the alveolar crest at different anatomical areas of males and females. P1, the first premolar; P2, the second premolar; M1, the first molar; M2, the second molar
The distance between the canal and the alveolar crest first decreased and then increased from the second molar to the first premolar (P = 0.000, Fig. 4). The effects of age (P = 0.906) or sex (P = 0.485) were non-significant. All interactions were non-significant (P > 0.2), except the interaction between sex and changes of canal diameter across different dental regions (P = 0.031, Fig. 3).
The distance between the sinus floor and the PSAA
Fig. 4.

Estimated marginal means (and 95% CI) of the distances between the inferior border of the PSAA canal and the sinus floor at different anatomical areas of males and females. P1, the first premolar; P2, the second premolar; M1, the first molar; M2, the second molar
The distance between the canal and the sinus floor reduced marginally significantly from the posterior to the anterior area (P = 0.074, Fig. 4). Age (P = 0.855) and sex (P = 0.187) were not significantly associated with changes in the canal floor distance.
Discussion
The findings of this study showed that CBCT detection rates of PSAA were between 83% in the second molar area and 58.5% in the first premolar area; the overall detection rate observed in this study was in line with previous studies [4, 5, 9–14]; on the other hand, it was higher than some studies [9, 15, 16] but were smaller than rates reported by certain other studies (93.9% and 89.3%) [1, 10]. It should be noted that cadaver studies have reported a prevalence of 100% for PSAA [17, 18], suggesting that perhaps the canal exists in all cases, but its detection rates differ in radiographic examinations. This can happen due to factors such as various methods’ resolutions, noises, fields of view, and diagnostic accuracies [4, 5, 11, 13, 14], as well as the canal’s diameter and density (which might differ across ethnicities), together with the expertise of the radiologist or clinician [5]; also, the medium on which the PSAA is being detected can matter; for example, earlier studies with low prevalences were on prints of CBCT slices, while digital software may allow digital enhancements such as zooming and contrast/brightness modifications [5, 14, 19]. It is suggested that in the case of the lack of PSAA observation in CBCT slices, it might be implied that the canal exists, but its diameter is less than 0.5 mm [4]. In this study, however, the minimum diameter of detected canals reached 0.2 mm.
The average diameter in this sample ranged between 0.74 mm in the second molar area and 0.96 mm in the first premolar area; the overall diameter was close to some other findings (such as 0.8 [20] and 0.94 mm [1]) but smaller than average diameters such as 1.17 [5], 1.18 [13], 1.2 [9], 1.3 [4, 11], 1.5 [21], and 1.6 mm [18]. These differences might as well be attributable to ethnic differences and methodological differences. The canal diameter has a direct impact on the extent and severity of hemorrhage [4]. Most arteries in this study were smaller than 1 mm in diameter, with prevalences ranging from 53% in the first premolar area to 80% in the second molar area. Many studies have asserted that less than one-third of canals might be smaller than 1 mm in diameter (13.9% [21], 26% [19], 30.2% [4], or 36.1% [11]); however, a study reported a much higher percentage for narrow canals (68.9%) [1], which was closer to the present results. In our sample, a rather low prevalence of larger canals (1–2 mm in diameter) was seen, ranging from 19% in the second molar area to 47% in the first premolar area. Some other studies had shown higher prevalences of canals between 1 and 2 mm in diameter (e.g., 59.1% [4]). In this study, almost no cases of very large canals larger than 2 mm in diameter were observed; this was in contrast to other studies reporting higher percentages for such arteries (e.g., 4%, 4.3%, 6.4%, 6.7%, 10.5% [4, 5, 14, 16, 19]). Serious hemorrhages happen when the canal diameter is greater than 2 mm [2, 5, 14]. Therefore, it seems that the current population might have one of the lowest probabilities of severe bleeding after damage to the PSAA.
The distance between the canal and the alveolar ridge in this sample ranged from the minimum of 16.7 mm in the first molar area to 25.5 mm in the first premolar area. These distances (with an overall average of 19.9 mm) were greater than all other studies reporting average distances such as 16.2, 16.4, 16.9, 18, and 18.9 mm [1, 4, 11, 12, 17, 19, 21].
In the present study, the average distance between the PSAA and the sinus floor did not have significant changes from the posterior side (8.0 mm) to the anterior side (4.0 mm). Our findings differed from those seen in other studies in terms of the averages/minimums/maximums as well as in terms of the pattern of distance alteration; this might be attributed to the ethnical variations in the path of the artery and the morphology of sinus floor, as well as technical differences such as sample sizes [5, 11, 14]. In the study of Apostolakis and Bissoon [14], the distance was first 8 mm in the posterior region and then reduced to 5.9 mm in the first molar area and remained around this value through the rest of the canal course. On the other hand, the distance between the PSAA and sinus floor had a rather constant value from the posterior segment to the anterior one, in the studies of Watanabe et al. [12] (with a mean distance of 9.6 mm), Yang and Kye [15] (with a mean distance of 7.8 mm), Hur et al. [20] (who showed minor fluctuations around a mean distance of 9.7 mm), and Danesh-Sani et al. [5] (who observed that the average distance slightly decreased from 9.3 mm in the posterior region to 8.1 mm in the first molar area and then slightly increased to 8.6 mm in the anterior region). It should be noted that there were considerable variations around the means in many studies, rendering the mean values not practically useful [5, 14].
Conclusions
The PSAA was detected in about 73% of evaluated slices. The diameter of the PSAA canals in this population is smaller than all other populations studied before, with almost no large arteries (larger than 2 mm in diameter); this probably ensures a lower risk of severe hemorrhage compared to the incidence of severe bleeding in other populations. The PSAA diameter may increase subtly on its course from the posterior side toward the anterior regions (still, large canals are least likely present in these areas). Also, it would be greater in males compared to females, probably increasing the hemorrhage risk in men. The minimum distance between the canal and alveolar ridge may exist in the first molar area. Age might not affect the diameter of canal or its distance from the alveolar ridge or sinus floor as well as its position relative to the sinus wall. Sex as well might not affect the distances between the canal with the alveolar crest and sinus floor. The right and left sides show no noticeable differences.
Funding
No funding received.
Compliance with Ethical Standards
Conflict of interest
The authors declare that they do not have any conflicts of interest.
Ethical Approval
All procedures were in accordance with the ethical standards of the institutional research committee and with the 1964 Helsinki Declaration and its later amendments.
Informed Consent
This was a retrospective study, and no patient was involved in this study.
Footnotes
Publisher's Note
Springer Nature remains neutral with regard to jurisdictional claims in published maps and institutional affiliations.
References
- 1.Ilguy D, Ilguy M, Dolekoglu S, Fisekcioglu E. Evaluation of the posterior superior alveolar artery and the maxillary sinus with CBCT. Braz Oral Res. 2013;27:431–437. doi: 10.1590/S1806-83242013000500007. [DOI] [PubMed] [Google Scholar]
- 2.Taschieri S, Rosano G. Management of the alveolar antral artery during sinus floor augmentation procedures. J Oral Maxillofac Surg. 2010;68:230. doi: 10.1016/j.joms.2009.06.036. [DOI] [PubMed] [Google Scholar]
- 3.Hong YH, Mun SK. A case of massive maxillary sinus bleeding after dental implant. Int J Oral Maxillofac Surg. 2011;40:758–760. doi: 10.1016/j.ijom.2010.11.027. [DOI] [PubMed] [Google Scholar]
- 4.Chitsazi MT, Shirmohammadi A, Faramarzi M, Esmaieli F, Chitsazi S. Evaluation of the position of the posterior superior alveolar artery in relation to the maxillary sinus using the Cone-Beam computed tomography scans. J Clin Exp Dent. 2017;9:e394–e399. doi: 10.4317/jced.53213. [DOI] [PMC free article] [PubMed] [Google Scholar]
- 5.Danesh-Sani SA, Movahed A, ElChaar ES, Chong Chan K, Amintavakoli N. Radiographic evaluation of maxillary sinus lateral wall and posterior superior alveolar artery anatomy: a cone-beam computed tomographic study. Clin Implant Dent Relat Res. 2017;19:151–160. doi: 10.1111/cid.12426. [DOI] [PubMed] [Google Scholar]
- 6.Maridati P, Stoffella E, Speroni S, Cicciu M, Maiorana C. Alveolar antral artery isolation during sinus lift procedure with the double window technique. Open Dent J. 2014;8:95–103. doi: 10.2174/1874210601408010095. [DOI] [PMC free article] [PubMed] [Google Scholar]
- 7.Pandharbale AA, Gadgil RM, Bhoosreddy AR, Kunte VR, Ahire BS, Shinde MR, Joshi SS. Evaluation of the posterior superior alveolar artery using cone beam computed tomography. Pol J Radiol. 2016;81:606–610. doi: 10.12659/PJR.899221. [DOI] [PMC free article] [PubMed] [Google Scholar]
- 8.Kurt M, Kurşun E, Alparslan E, Öztaş B. Posterior superior alveolar artery evaluation in a Turkish subpopulation using CBCT. Clin Dent Res. 2014;38:12–19. [Google Scholar]
- 9.Ella B, Sédarat C, Da Costa Noble R, Normand E, Lauverjat Y, Siberchicot F, Caix P, Zwetyenga N. Vascular connections of the lateral wall of the sinus: surgical effect in sinus augmentation. Int J Oral Maxillofac Implants. 2008;23:1047–1052. [PubMed] [Google Scholar]
- 10.Anamali S, Avila-Ortiz G, Elangovan S, Qian F, Ruprecht A, Finkelstein M, Allareddy V. Prevalence of the posterior superior alveolar canal in cone beam computed tomography scans. Clin Oral Implants Res. 2015;26:e8–e12. doi: 10.1111/clr.12318. [DOI] [PubMed] [Google Scholar]
- 11.Güncü GN, Yildirim YD, Wang H-L, Tözüm TF. Location of posterior superior alveolar artery and evaluation of maxillary sinus anatomy with computerized tomography: a clinical study. Clin Oral Implants Res. 2011;22:1164–1167. doi: 10.1111/j.1600-0501.2010.02071.x. [DOI] [PubMed] [Google Scholar]
- 12.Watanabe T, Shiota M, Gao S, Imakita C, Tachikawa N, Kasugai S. Verification of posterior superior alveolar artery distribution in lateral wall of maxillary sinus by location and defect pattern. Quintessence Int. 2014;45:673–678. doi: 10.3290/j.qi.a32239. [DOI] [PubMed] [Google Scholar]
- 13.Kang S-J, Shin S-I, Herr Y, Kwon Y-H, Kim G-T, Chung J-H. Anatomical structures in the maxillary sinus related to lateral sinus elevation: a cone beam computed tomographic analysis. Clin Oral Implants Res. 2011;24:75–81. doi: 10.1111/j.1600-0501.2011.02378.x. [DOI] [PubMed] [Google Scholar]
- 14.Apostolakis D, Bissoon AK. Radiographic evaluation of the superior alveolar canal: measurements of its diameter and of its position in relation to the maxillary sinus floor: a cone beam computerized tomography study. Clin Oral Implants Res. 2013;25:553–559. doi: 10.1111/clr.12119. [DOI] [PubMed] [Google Scholar]
- 15.Yang S-M, Kye S-B. Location of maxillary intraosseous vascular anastomosis based on the tooth position and height of the residual alveolar bone: computed tomographic analysis. J Periodontal Implant Sci. 2014;44:50–56. doi: 10.5051/jpis.2014.44.2.50. [DOI] [PMC free article] [PubMed] [Google Scholar]
- 16.Rosano G, Taschieri S, Gaudy J-F, Weinstein T, Del Fabbro M. Maxillary sinus vascular anatomy and its relation to sinus lift surgery. Clin Oral Implants Res. 2010;22:711–715. doi: 10.1111/j.1600-0501.2010.02045.x. [DOI] [PubMed] [Google Scholar]
- 17.Kqiku L, Biblekaj R, Weiglein AH, Kqiku X, Städtler P. Arterial blood architecture of the maxillary sinus in dentate specimens. Croat Med J. 2013;54:180–184. doi: 10.3325/cmj.2013.54.180. [DOI] [PMC free article] [PubMed] [Google Scholar]
- 18.Solar P, Geyerhofer U, Traxler H, Windisch A, Ulm C, Watzek G. Blood supply to the maxillary sinus relevant to sinus floor elevation procedures. Clin Oral Implants Res. 1999;10:34–44. doi: 10.1034/j.1600-0501.1999.100105.x. [DOI] [PubMed] [Google Scholar]
- 19.Mardinger O, Abba M, Hirshberg A, Schwartz-Arad D. Prevalence, diameter and course of the maxillary intraosseous vascular canal with relation to sinus augmentation procedure: a radiographic study. Int J Oral Maxillofac Surg. 2007;36:735–738. doi: 10.1016/j.ijom.2007.05.005. [DOI] [PubMed] [Google Scholar]
- 20.Hur M-S, Kim J-K, Hu K-S, Bae HEK, Park H-S, Kim H-J. Clinical implications of the topography and distribution of the posterior superior alveolar artery. J Craniofac Surg. 2009;20:551–554. doi: 10.1097/SCS.0b013e31819ba1c1. [DOI] [PubMed] [Google Scholar]
- 21.Kim JH, Ryu JS, Kim K-D, Hwang SH, Moon HS. A radiographic study of the posterior superior alveolar artery. Implant Dent. 2011;20:306–310. doi: 10.1097/ID.0b013e31822634bd. [DOI] [PubMed] [Google Scholar]