

Abstract
Introduction
In Indian population, the estimated prevalence of OSA is 7.5% to 13.5%. Craniofacial anatomical variations and obesity are the major risk factors for OSA. Among the craniofacial anatomy, the neck circumference and abnormal craniofacial morphology play an important role in the pathogenesis of OSA. Obesity is the major risk factor for which waist and hip circumference and BMI are considered.
Aim
The aim of this paper was to evaluate the impact of hyoid position, mandible body length (MBL) and anthropometric measurements on sleep indices in patients with snoring in North Indian population.
Methods
In this cross-sectional study, we analyzed the position of the hyoid, mandible body length and anthropometric measurements, of 104 patients attending ENT OPD with the complaint of snoring and excessive daytime sleepiness. All subjects underwent a full overnight polysomnography. The position of the hyoid, MBL and the anthropometric measurements were compared with the sleep architecture of the subjects, and a p value < 0.05 was considered significant.
Results
A strong positive correlation is seen between the position of the hyoid, MBL and anthropometric measurements on the sleep indices in this study. Pearson 2-tailed correlation was evaluated, and upon analysis, it was found that at significance level of 0.01, obesity (BMI) is strongly correlated with overall AHI with correlation coefficient of 0.926, whereas AHI in supine position was having coefficient of 0.837 and AHI on right side and left side was almost same 0.597 and 0.575, respectively. Similarly WC is strongly correlated with AHI and RDI, having coefficient of 0.930 with both. NC and HC also showed strong positive correlation with overall AHI and RDI having correlation coefficient of 0.893, 0.926 with AHI and 0.893, 0.926 with RDI, respectively. The MBL also showed a strong positive correlation with AHI and RDI with correlation coefficient of 0.994 in both. The position of the hyoid also showed a strong positive correlation with AHI and RDI.
Conclusion
Results indicated that significant positive correlation was found between position of the hyoid, MBL and anthropometric measurements on the sleep indices in patients with snoring in North Indian population.
Keywords: Anthropometric, Hyoid position, Mandible body length sleep study, Polysomnography, AHI, RDI, Mandible, Hyoid
Introduction
Obstructive sleep apnea (OSA) is an obstructive type of respiratory disorder which is characterized by repetitive apnea and/or hypopnea during sleep, the reason being the relaxation of the upper airway and tongue musculature during sleep, resulting in hypoxemia. These apnoeic and hypopneic events occur numerous times during sleep in the night time resulting in arousals from sleep and sleep disruptions causing sleep fragmentation leading to excessive daytime sleepiness [1]. Apnea can be defined as an interruption of breathing during sleep, with persistence of thoracic and/or abdominal movements associated with a decrease in oxygen tension and a consequent desaturation of oxygen of the arterial hemoglobin [2]. The term hypopnea is defined as a decrease of > 50% in airflow, with a persistence of the thoracic and/or abdominal movements. Hypopnea can also be defined as a reduction of breathing width (but > 50%) associated with a reduction of oxygen saturation (SaO2) > 3% or an awakening [2]. Traditionally, polysomnography (PSG) in an attended setting is used as a reference standard for the diagnosis of OSA. Polysomnography is a gold standard tool for diagnosis of OSA, it is costly, complex test, and, in many developing countries, it is difficult to access. PSG monitors sleep stages, respiratory efforts, oxygen saturation, heart rate, body position and limb movements. These data are used to calculate the apnea–hypopnea index (AHI) or the respiratory disturbance index (RDI). The AHI is the sum of apneas–hypopnea per hour of sleep where apnea means absence of flow for ≥ 10 s and hypopnea as reduction in respiratory effort with ≥ 4% oxygen desaturation. The RDI is the sum of apneas, hypopneas and the abnormal respiratory events per hour of sleep.
Lifestyle modifications in the recent era have contributed to the emergence of sleep changes in younger population [3]. Poor sleep is more commonly reported in elderly people and people with disturbed sleep routine like night shift workers [4]. Studies have reported that obesity, particularly central obesity, is significantly associated with an increased prevalence of, as it promotes enlargement of the soft tissue structures within and surrounding the airway, thereby contributing significantly to pharyngeal airway narrowing [5, 6]. Neck circumference and BMI hold an important place in snorers with OSA [7, 8]. Neck circumference (NC) has been known to be a strong predictor of OSA [5, 6]. However, some authors have demonstrated that body mass index (BMI) correlates with OSA better than NC [6]. Further craniofacial anatomical variations are also described in patients of OSA [9]. So, the purpose of this study was to evaluate the influence of hyoid position, MBL and anthropometric measurements of on sleep indices in patients with OSA in North Indian population and to compare these data with the review of literature.
Materials and Methods
Patients
This study was approved by the ethical committee of the institute, and all participants gave written consent. It included 104 patients presenting to the Department of Otorhinolaryngology in a tertiary Institute of North India with complaints of snoring and daytime sleepiness.
Exclusion Criteria
Patients who suffered from diabetes, pulmonary disorders, sleep disorders other than OSA including central sleep apnea, mental disorders, cardiovascular disorders, neuromuscular diseases, drug users, smokers and people who had been taking medication affecting sleeping were excluded.
Study Design
Cross-sectional study.
Method
All the 104 patients coming to the OPD with either of the complaints of snoring, witnessed apnoeic incidents, excessive daytime sleepiness, nocturnal gasping or choking or were suspected of having OSA were included in the study. History from the patient and fellow attendant was taken to document the symptoms. Various anthropometric, craniofacial measurements and BMI were calculated of individual patient. Anthropometric measurements included neck circumference, (NC) waist circumference (WC), hip circumference (HC). The NC was measured along a horizontal line across the midline of the thyroid cartilage. The WC and the HC were measured with patients in the standing position. The WC was measured at the midpoint between the lower border of the rib cage and the iliac crest in the upright position, and the HC was measured along the femoral greater trochanter. Anthropometric measurements were based on the WHO guidelines. Standardized lateral cephalograms with the mandible in position of maximum inter-cuspation and in neutral head position were taken. In order to fix the hyoid position the patient was requested to breathe in slowly and then exhale and hold the breath during exhalation, while the film was exposed. The radiographs were traced by a single examiner, and three hard tissue points were identified (Figs. 1, 2). In the cephalometric analysis we chose two parameters, the mandible body length (MBL), i.e., distance between go.-gn. and the perpendicular distance from the hyoid bone to the mandibular line (AH-M). The method of cephalometric analysis was strictly followed as suggested by Burstone et al. [10].
Fig. 1.

The Cephalometric reference points and lines used in this study
Fig. 2.
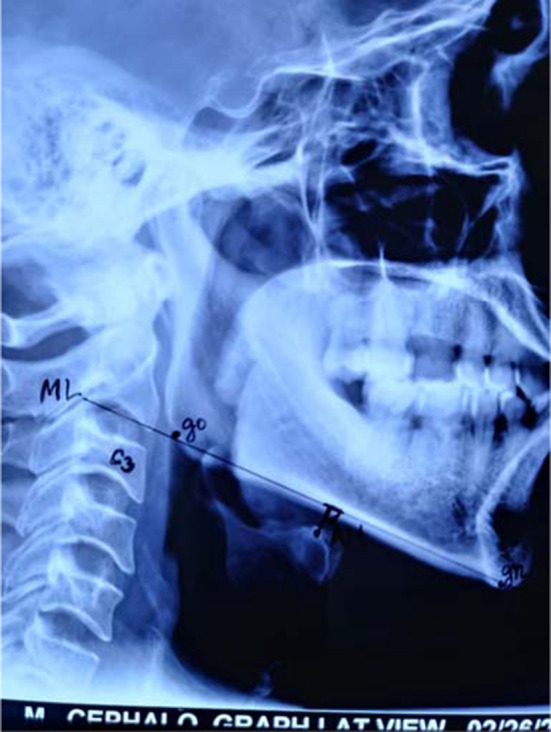
Lateral Cephalogram with reference points and lines used in this study
Overnight polysomnography, the gold standard sleep study was then done in these 104 patients and it included polygraphic recordings from surface electrodes for electroencephalography, electrooculography, electrocardiography and electromyography and from nasal pressure transducer with thermistors for nasal and oral airflow, tracheal sounds and thoracic and abdominal respiration. The monitoring of transcutaneous oxygen saturation was performed continuously with a finger pulse oximeter. Positional changes during sleep were recorded, and the full-night video recordings were done during the test period. The procedure was terminated after the final waking in the morning. Sleep was defined according to the criteria of Rechtschaffen and Kales [11]. Respiratory events were scored according to the criteria of the American Academy of Sleep Medicine [12]. Apnea was defined as a cessation of airflow lasting at least 10 s. The hypopnea was defined if there was a reduction of airflow measured by nasal pressure transducer > 30% that lasted > 10 s along with > 4% oxygen desaturation, or 50% or more decrease in airflow lasting at least 10 s, a discernible decrease of 3% or more oxygen saturation or an electroencephalography arousal. AHI was defined as the number of apnea and hypopnea events that occurred per h of sleep. The AHI, when associated with typical symptoms, was scored as follows: AHI > 5 events/h was diagnosed as OSA, of these, 15 > AHI > 5 events/h was considered mild, 30 > AHI.15 events/h was considered moderate, and.30 events/h was considered severe OSA [13]. The BMI was calculated as weight (kg) divided height (m2). Patients with Epworth sleepiness score 10 or more were considered to have excessive daytime sleepiness [14]. RDI (Respiratory Disturbance Index) in various positional changes was also recorded.
The data thus obtained were statistically analyzed. The continuous variables were compared with Student's t test. The correlations between the variables were assessed with a Pearson’s correlation test. The p values less than 0.05 were considered statistically significant.
Results
Out of 104 North Indian patients studied, 80 were males and 24 were females with mean age 49.42 years ranging from 25 to 74 years. In total, 86 patients were obese and 14 were nonobese with mean of the study falling toward obese side (35.13 ± 3.29 kg/m2) with a range from 26.4 to 41 kg/m2. Table 1 presents the scalar variables in our statistical analysis of the study data, their variations and means. Table 2 shows an analysis of the Pearson correlation coefficients used to evaluate the relationship between hyoid position, mandible body length and anthropometric measurements on sleep indices. A strong positive correlation is seen between anthropometric measurements and sleep indices. Pearson 2-tailed correlation was evaluated, and upon analysis, it was found that at significance level of 0.01, obesity (BMI) is strongly correlated with overall AHI with correlation coefficient of 0.926, whereas with AHI in supine position was having coefficient of 0.837 and AHI on right side and left side was almost same 0.597 and 0.575. Similarly WC is strongly correlated with AHI and RDI having coefficient of 0.930 with both. NC and HC also showed strong positive correlation with overall AHI and RDI having correlation coefficient of 0.893, 0.926 with AHI and 0.893, 0.926 with RDI, respectively. MBL showed a strong positive correlation with AHI and RDI with correlation coefficient of 0.994 in both. The perpendicular distance from hyoid to the mandibular line (AH-M) also showed a strong positive correlation with AHI and RDI with a correlation coefficient of 0.553 and 0.662, respectively.
Table 1.
Demographic data of the study subjects (n=104)
| Mean | Std. error of mean | Median | Std. deviation | Minimum | Maximum | |
|---|---|---|---|---|---|---|
| BMI (kg/m2) | 35.1336 | .46461 | 36.0300 | 3.28528 | 26.40 | 41.00 |
| Waist circumference in inches | 47.0858 | .31585 | 47.6750 | 2.23340 | 41.00 | 50.20 |
| Hip circumference in inches | 44.6840 | .31350 | 45.2500 | 2.21676 | 38.60 | 47.80 |
| Neck circumference | 17.4684 | .05704 | 17.6050 | .40330 | 16.30 | 18.23 |
| Apnea–hypopnea index | 46.0660 | 3.65199 | 45.4500 | 25.82346 | 8.90 | 110.30 |
| RDI | 46.0660 | 3.65199 | 45.4500 | 25.82346 | 8.90 | 110.30 |
| Oxygen desaturation | 108.8600 | 17.38186 | 92.5000 | 122.90830 | 69.00 | 960.00 |
| AHI_Back | 51.3960 | 3.76136 | 51.0000 | 26.59685 | 2.00 | 104.80 |
| AHI_left | 35.5820 | 4.69106 | 23.3500 | 33.17079 | .00 | 112.30 |
| AHI_Right | 32.5940 | 4.83802 | 15.6000 | 34.20994 | .00 | 120.00 |
| _Mandible body in cm | 7.2480 | .05420 | 7.4000 | 4.38327 | 7.080 | 7.6.00 |
| Hyoid to mandible length(AH-M)in mm | 26.012 | .08451 | 28.651 | 5.6542 | 20.506 | 33.233 |
Table 2.
Correlations of demographic data and polysomnograpy parameters (n=104)
| Apnea–hypopnea index | RDI | AHI_Back | AHI_left | AHI_Right | ||
|---|---|---|---|---|---|---|
| BMI (kg/m2) | Pearson correlation | .926** | .926** | .837** | .597** | .575** |
| Sig. (2-tailed) | .000 | .000 | .000 | .000 | .000 | |
| Waist circumference (inches) | Pearson correlation | .930** | .930** | .841** | .593** | .574** |
| Sig. (2-tailed) | .000 | .000 | .000 | .000 | .000 | |
| Hip circumference (inches) | Pearson correlation | .926** | .926** | .833** | .594** | .572** |
| Sig. (2-tailed) | .000 | .000 | .000 | .000 | .000 | |
| Neck circumference | Pearson correlation | .893** | .893** | .809** | .577** | .553** |
| Sig. (2-tailed) | .000 | .000 | .000 | .000 | .000 | |
| Mandible body length | Pearson correlation | .994** | .994** | .874** | .647** | .650** |
| AH-M | Pearson correlation | .575 | .574 | .572 | .553 | .662 |
| Sig. (2-tailed) | .000.000 | .000.000 | .000.000 | .000.000 | .000.000 |
**Correlation is significant at the 0.01 level (2-tailed)
*Correlation is significant at the 0.05 level (2-tailed)
Discussion
It is assumed that obesity may increase susceptibility to OSA by causing fat deposition in the upper airway tissues, narrowing the nasopharyngeal lumen, hence leading to hypoventilation [15]. Measurement of craniofacial morphology in OSA patients not only helps specialists in recognizing morphologic changes induced by altered sleep patterns, but also provides the patient with adequate treatment [16]. There is a vast amount of scientific literature on cephalometric and anthropometric measures, which compares control groups and snorers to OSA patients and aims at using these measurements as predictors of this condition [16–18].
Obesity has been frequently associated with OSA, and the measurement of height and weight and thereby calculation of BMI to define and quantify obesity are one of the important components of the physical parameters [19, 20]. Grunstein and colleagues demonstrated that the BMI of at least 25 mg/m2 was associated with a 93% sensitivity and 74% specificity for OSA [21]. Increased NC has consistently been shown to be a more reliable clinical predictor of OSA and has been shown in many studies to correlate with severity of disease [22–24]. Katz and colleagues showed that patients with OSA had an increased NC of 43.7 ± 4.5 cm versus 39.6 ± 4.5 cm in control group [25]. Likewise, Kushida et al. found that NC of 40 cm was associated with a sensitivity of 61% and specificity of 93% for OSA [26]. In our study too, of 104 North Indian patients the NC was 43.671 ± 3.978 cm. Davies and Stradling (1990) confirmed that the NC is the best clinical predictor of OSA compared to other anthropometric measurements [23]. Deegan and McNicholas (1996) concluded that the WC correlated best with sleep disorders [27]. Our study analyzed various anthropometric measures of 104 North Indian patients and their associations with the presence, as well as the severity of OSA. All of the anthropometric indices (NC, WC and BMI) were significantly correlated with the severity of OSA.
We found a significant relation among the variables NC, AC, and HC, and OSA severity. The most significant of them in our data was the NC (p < 0.001), followed by the WC (p < 0.001) and HC (p < 0.001). These findings confirm other published results, suggesting that circumference measures are predictive factors for OSA severity. These results were similar to those of previous studies. Kushida et al. described four craniofacial parameters indicative of upper airway narrowing, maxillary intermolar distance, mandibular intermolar distance, palatal height and dental overjet [26]. Yamagishi and colleagues have examined the prevalence of OSA among Hispanic and white Americans and in people of Japanese origin [28], suggesting that in spite of the racial and ethnic difference, BMI and sleep disordered breathing were strongly associated in all races, and the prevalence of OSA best corresponded with differences in BMI. A recent similar preliminary study of 119 subjects from Korea evaluated the influential clinical and anthropometric characteristics that affected AHI in suspected OSA patients [29]. In literature, BMI is the most influential factor that affects AHI, and weight, NC, WC and hip circumference are significantly correlated with AHI. Davidson et al. have shown that WC correlates most significantly with AHI for both men and women in a cohort of 414 patients [29]. Soylu et al. have reported that NC has a greater value than WC regarding an association with OSA in Turkish adults. They suggested that the optimal cutoff values of NC for predicting OSA were 35.5 cm in females and 39 cm in males, while for WC the cutoff values were 105 cm in males and 101 cm in females [30]. In our study the mean WC was 117.714 ± 5.54 cm. Generally, abdominal obesity is defined as a WC of 90 cm or more in men or 80 cm or more in women in the Asian population and 94 cm or more in men or 80 cm or more in women in Middle East and Caucasian [31]. Despite suffering from a similar severity of OSA, Asian patients are less obese compared to Caucasian patients, suggesting that ethnicity may differentially contribute to OSA [32]. Martin et al. have reported that a BMI > 30 kg/m2 in both genders is associated with the development of OSA [33]. Soylu et al. have shown that BMI values over 27.77 kg/m2 in females and over 28.93 kg/m2 in males increase the risk of OSA in a Turkish population [30], while in our study the mean BMI was 35.13 ± 3.28. The mean MBL in our study is 7.248 ± 4.38 cm which is comparable with studies in literature [34, 35]. OSA subjects showed reduction in the MBL, and this is well supported by the work done by Joanna et al., Anderson and Brattstrom. The anatomical differences place the facial complex closer to the cervical spine and thus contribute to the reduction in space required for breathing [34, 35]. The hyoid bone position is believed to be crucial for pharyngeal patency, and an imbalance between suprahyoid and infrahyoid muscles may influence the hyoid bone position. The mean of the perpendicular distance from hyoid to the mandibular line (AH-M) in our study is 26.012 mm ± 5.65 mm, and similar figures have been quoted in review articles [34–37]. The position of hyoid is more inferiorly and posteriorly placed in our patients; hence, AH-M distance and MBL were significantly smaller in Indian OSA patients as compared to the Caucasians, suggesting a smaller hypopharynx in the Indian OSA patients as compared to the Caucasians. In comparison with the Japanese patients, mandible body length was significantly smaller in our OSA patients, whereas AH-M length and the facial axis angle were significantly greater in the Indians. So a lower and posterior placed hyoid coupled with shorter mandible concentrates more tongue mass in the hypopharyngeal region contributing to the severity of OSA [36, 37].
Ethnicity involves multiple factors such as obesity and craniofacial measurements, which individually or in combination influence OSA [19]. While Asian patients with OSA are generally less obese than their Caucasian counterparts, a low hyoid bone and retro-position of either of the maxilla or mandible are common predisposing factors for OSA in the Asian populations [32]. When compared, the Indian patients were found to be obese compared to Asians and to have smaller mandible length compared to other ethnic groups. However, our results suggested that the analysis of hyoid position, mandible body length and anthropometric measurements in North Indian patients might provide useful information for a presumptive diagnosis for OSA. Such analyses are helpful because physicians without immediate access to facilities for sleep studies depend on clinical features to raise their suspicion of the disease. Our study was a cross-sectional analysis, there was the possibility that confounding factors that were unaccounted for may have resulted in biased results, and also because of the usual male predominance referrals to sleep clinics, there was an unbalanced gender distribution and it included the North Indian population only, so the results should be applied with caution to the general population.
Conclusion
In conclusion, this study confirms strong correlation of anthropometric (BMI, NC, HC and WC) measurements with the AHI, making them good predictors of OSA. The strong correlation of hyoid position and MBL with the severity of OSA further indicates that both the indices can be used as predictors and for planning surgical interventions used for the treatment of OSA.
Compliance with Ethical Standards
Conflict of interest
None.
Footnotes
Publisher's Note
Springer Nature remains neutral with regard to jurisdictional claims in published maps and institutional affiliations.
Contributor Information
Vikas Kakkar, Email: kakkarvikasdr13@gmail.com.
Vanita Sarin, Email: drvanitasarin@gmail.com.
Amit Dhawan, Email: surg.amit@gmail.com.
Rasleen Kaur, Email: coolzinnia@gmail.com.
Ateev Juneja, Email: ateevjuneja1998@gmail.com.
References
- 1.Rotenberg BW, Vicini C, Pang EB, Pang KP. Reconsidering first-line treatment for obstructive sleep apnea: a systematic review of the literature. J Otolaryngol Head Neck Surg. 2016;23:45. doi: 10.1186/s40463-016-0136-4. [DOI] [PMC free article] [PubMed] [Google Scholar]
- 2.Sleep-related breathing disorders in adults: recommendations for syndrome definition and measurement techniques in clinical research. The Report of an American Academy of Sleep Medicine Task Force. Sleep; 1999; 22(5):667–689 [PubMed]
- 3.Araújo CLO, Ceolim MF. Sleep quality of elders living in long- term care institutions. Rev Esc Enferm USP. 2010;44(3):619–626. doi: 10.1590/S0080-62342010000300010. [DOI] [PubMed] [Google Scholar]
- 4.Onat A, Hergenc G, Yüksel H, Can G, Ayhan E, et al. Neck circumference as a measure of central obesity: associations with metabolic syndrome and obstructive sleep apnea syndrome beyond waist circumference. Clin Nutr. 2009;28:46–51. doi: 10.1016/j.clnu.2008.10.006. [DOI] [PubMed] [Google Scholar]
- 5.Cizza G, de Jonge L, Piaggi P, Mattingly M, Zhao X, et al. Neck circumference is a predictor of metabolic syndrome and obstructive sleep apnea in short-sleeping obese men and women. Metab Syndr Relat Disord. 2014;12:231–241. doi: 10.1089/met.2013.0093. [DOI] [PMC free article] [PubMed] [Google Scholar]
- 6.Hoffstein V, Mateika S. Differences in abdominal and neck circumferences in patients with and without obstructive sleep apnoea. Eur Respir J. 1992;5:377–381. [PubMed] [Google Scholar]
- 7.Susarla SM, Thomas RJ, Abramson ZR, Kaban LB. Biomechanics of the upper airway: changing concepts in the pathogenesis of obstructive sleep apnea. Int J Oral Maxillofac Surg. 2010;39(12):1149–1159. doi: 10.1016/j.ijom.2010.09.007. [DOI] [PubMed] [Google Scholar]
- 8.Zucconi M, Ferini-Strambi L, Palazzi S, Orena C, Zonta S, Smirne S. Habitual snoring with and without obstructive sleep apnea: the importance of cephalometric variables. Thorax. 1992;47:157–161. doi: 10.1136/thx.47.3.157. [DOI] [PMC free article] [PubMed] [Google Scholar]
- 9.Duran J, Esnaola S, Rubio R, Iztueta A. Obstructive sleep apnea-hypopnea and related clinical features in a population-based sample of subjects aged 30 to 70 yr. Am J Respir Crit Care Med. 2001;157:685–689. doi: 10.1164/ajrccm.163.3.2005065. [DOI] [PubMed] [Google Scholar]
- 10.Burstone CJ, James RB, Legan H, Murphy GA, Norton LA. Cephalometrics for orthognathic surgery. J Oral Surg. 1978;36:269–277. [PubMed] [Google Scholar]
- 11.Rechtschaffen A, Kales A. A manual of standardized terminology, techniques and scoring system for sleep stages in human subjects. Los Angeles: Brain Information Service/Brain Research Institute, University of California; 1968. [Google Scholar]
- 12.Iber C, Ancoli-Israel S, Chesson A, Quan SF. American Academy of Sleep Medicine (2007) The AASM manual for the scoring of sleep and associated events: rules, terminology and technical specifications. 1. Westchester: AASM; 2007. [Google Scholar]
- 13.McNicholas WT. Diagnosis of obstructive sleep apnea in adults. Proc Am Thorac Soc. 2008;5:154–160. doi: 10.1513/pats.200708-118MG. [DOI] [PubMed] [Google Scholar]
- 14.Johns MW. A new method for measuring daytime sleepiness: the Epworth sleepiness scale. Sleep. 1991;14:540–545. doi: 10.1093/sleep/14.6.540. [DOI] [PubMed] [Google Scholar]
- 15.Redline S, Tishler PV. The genetics of sleep apnea. Sleep Med Rev. 2000;4:583–602. doi: 10.1053/smrv.2000.0120. [DOI] [PubMed] [Google Scholar]
- 16.Bharadwaj R, Ravikumar A, Krishnaswamy NR. Evaluation of craniofacial morphology in patients with obstructive sleep apnea using lateral cephalometry and dynamic MRI. Indian J Dent Res. 2011;22:739–748. doi: 10.4103/0970-9290.94566. [DOI] [PubMed] [Google Scholar]
- 17.Olszewska E, Sieskiewicz A, Rozycki J, Rogalewski M, Tarasow E, Rogowski M, et al. A comparison of cephalometric analysis using radiographs and craniofacial computed tomography in patients with obstructive sleep apnea syndrome: preliminary report. Eur Arch Otorhinolaryngol. 2009;266:535–542. doi: 10.1007/s00405-008-0826-2. [DOI] [PubMed] [Google Scholar]
- 18.Julià-Serdà G, Pérez-Peñate G, Saavedra-Santana P, Ponce-González M, Valencia-Gallardo JM, Rodríguez- Delgado R, et al. Usefulness of cephalometry in sparing polysomnography of patients with suspected obstructive sleep apnea. Sleep Breath. 2006;10:181–187. doi: 10.1007/s11325-006-0073-y. [DOI] [PubMed] [Google Scholar]
- 19.Young T, Palta M, Dempsey J, et al. The occurrence of sleep disordered breathing among middle-aged adults. N Engl J Med. 1993;328:1230–1235. doi: 10.1056/NEJM199304293281704. [DOI] [PubMed] [Google Scholar]
- 20.Strohl KP, Redline S. Recognition of obstructive sleep apnea. Am J Respir Crit Care Med. 1996;154:279–289. doi: 10.1164/ajrccm.154.2.8756795. [DOI] [PubMed] [Google Scholar]
- 21.Grunstein R, Wilcox I, Yang TS, et al. Snoring and sleep apnoea in men: association with central obesity and hypertension. Int J Obes Relat Metab Disord. 1993;17:533–540. [PubMed] [Google Scholar]
- 22.Kales A, Cadieux RJ, Bixler EO, et al. Severe obstructive sleep apnea. I: Onset, clinical course, and characteristics. J Chron Dis. 1985;38:419–425. doi: 10.1016/0021-9681(85)90137-7. [DOI] [PubMed] [Google Scholar]
- 23.Davies RJ, Stradling JR. The relationship between neck circumference, radiographic pharyngeal anatomy, and the obstructive sleep apnoea syndrome. Eur Respir J. 1990;3:509–514. [PubMed] [Google Scholar]
- 24.Stradling J, Crosby J. Predictors and prevalence of obstructive sleep apnoea and snoring in 1001 middle aged men. Thorax. 1991;46:85. doi: 10.1136/thx.46.2.85. [DOI] [PMC free article] [PubMed] [Google Scholar]
- 25.Katz I, Stradling J, Slutsky AS, et al. Do patients with obstructive sleep apnea have thick necks? Am Rev Respir Dis. 1990;141:1228–1231. doi: 10.1164/ajrccm/141.5_Pt_1.1228. [DOI] [PubMed] [Google Scholar]
- 26.Kushida CA, Efron B, Guilleminault C. A predictive morphometric model for the obstructive sleep apnea syndrome. Ann Intern Med. 1997;127:581–587. doi: 10.7326/0003-4819-127-8_Part_1-199710150-00001. [DOI] [PubMed] [Google Scholar]
- 27.Deegan PC, McNicholas WT. Predictive value of clinical features for the obstructive sleep apnoea syndrome. Eur Respir J. 1996;9:117–124. doi: 10.1183/09031936.96.09010117. [DOI] [PubMed] [Google Scholar]
- 28.Yamagishi K, Ohira T, Nakano H, Bielinski SJ, Sakurai S, et al. Cross-cultural comparison of the sleep-disordered breathing prevalence among Americans and Japanese. Eur Respir J. 2010;36:379–384. doi: 10.1183/09031936.00118609. [DOI] [PMC free article] [PubMed] [Google Scholar]
- 29.Davidson TM, Patel MR. Waist circumference and sleep disordered breathing. Laryngoscope. 2008;118:339–347. doi: 10.1097/MLG.0b013e3181587d7c. [DOI] [PubMed] [Google Scholar]
- 30.Soylu AC, Levent E, Sarıman N, Yurtlu S, Alparslan S, et al. Obstructive sleep apnea syndrome and anthropometric obesity indexes. Sleep Breath. 2012;16:1151–1158. doi: 10.1007/s11325-011-0623-9. [DOI] [PubMed] [Google Scholar]
- 31.No authors listed. Executive Summary of The Third Report of The National Cholesterol Education Program (NCEP) Expert Panel on Detection, Evaluation, and Treatment of High Blood Cholesterol in Adults (Adult Treatment Panel III). JAMA 2001; 2486–2497. [DOI] [PubMed]
- 32.Lee RW, Vasudavan S, Hui DS, Prvan T, Petocz P, et al. Differences in craniofacial structures and obesity in Caucasian and Chinese patients with obstructive sleep apnea. Sleep. 2010;33:1075–1080. doi: 10.1093/sleep/33.8.1075. [DOI] [PMC free article] [PubMed] [Google Scholar]
- 33.Martins AB, Tufik S, Moura SM. Physiopathology of obstructive sleep apnea-hypopnea syndrome. J Bras Pneumol. 2007;44:93–100. doi: 10.1590/S1806-37132007000100017. [DOI] [PubMed] [Google Scholar]
- 34.Battagel JM, L’Estrange PR. The cephalometric morphology of patients with obstructive sleep apnoea (OSA) Eur J Orthodont. 1996;18:557–569. doi: 10.1093/ejo/18.6.557. [DOI] [PubMed] [Google Scholar]
- 35.Anderson L. Brattstorm V (1991) Cephalometric analysis of permanently snoring patients with and without obstructive apnoea syndrome. Int J Oral Maxillofac Surg. 1991;20:59–162. doi: 10.1016/S0901-5027(05)80007-4. [DOI] [PubMed] [Google Scholar]
- 36.Lyberg T, Krogstad O, Djupesland G. Cephalometric analysis in patients with obstructive sleep apnoea syndrome. J Laryngol Otol. 1989;103:293–297. doi: 10.1017/S0022215100108746. [DOI] [PubMed] [Google Scholar]
- 37.Pracharktam N, Hans MG, Strohl KP, Redline S. Upright and supine cephalometric evaluation of obstructive sleep apnea syndrome and snoring subjects. Angle Orthod. 1994;64:63–72. doi: 10.1043/0003-3219(1994)064<0063:UASCEO>2.0.CO;2. [DOI] [PubMed] [Google Scholar]