

Abstract
It has been shown that brain functional networks constructed from electroencephalographic signals (EEG) continuously change topology as brain fatigue increases, and extracting the topological properties of the network can characterize the degree of brain fatigue. However, the traditional brain function network construction process often selects only the amplitude or phase components of the signal to measure the relationship between brain regions, and the use of a single component of the signal to construct a brain function network for analysis is rather one-sided. Therefore, we propose a method of functional synchronization analysis of brain regions. This method takes the EEG signal based on empirical modal decomposition (EMD) to obtain multiple intrinsic modal components (IMF) and inputs them into the Hilbert transform to obtain the instantaneous amplitude, and then calculates the amplitude locking value (ALV) to measure the synchronization relationship between all pairs of channels. The topological properties of the brain functional network are extracted to classify awake and fatigue states. The brain functional network is constructed based on the adjacency matrix of each waveform obtained from the ALV between all pairs of channels to realize the synchronization analysis between brain regions. Moreover, we achieved a satisfactory classification accuracy (82.84%) using the discriminative connection features in the Alpha band. In this study, we analyzed the functional network of ALV brain in fatigue and awake state, and the results showed that the connections between brain regions in fatigue state were significantly increased, and the connections between brain regions in the awake state were significantly decreased, and the information interaction between brain regions was more orderly and efficient.
Keywords: Electroencephalography, Functional brain networks, Amplitude locking value, Fatigue driving
Introduction
Drivers need to maintain a high level of alertness in their work, and if there is a drop in alertness, it will have a great possibility of traffic accidents resulting in injuries or deaths. Therefore, fatigue driving monitoring is a very important research topic with great application value. The existing researches include non-contact monitoring methods, mainly by extracting the behavioral characteristics of vehicles or people for analysis (Rong-Ben et al. 2003; Horng et al. 2004; Vural et al. 2007; Wang et al. 2006), but these methods are vulnerable to the influence of the external environment. To obtain more accurate indicators for monitoring fatigue driving, most researchers have opted for contact monitoring methods, using more accurate physiological signals for monitoring, such as EEG, electrooculography (EOG), and electrocardiography (ECG) (Fu and Wang 2014; Lee et al. 2019). It has been found that EEG signals are more accurate reflections of brain activity than other physiological signals (Chuang et al. 2015). Numerous scholars use EEG signals for fatigue monitoring, and they are more commonly used to directly extract the time–frequency features in the signal and have made some progress (Wang et al. 2018a, 2020; Xiong et al. 2016; Hu et al. 2019; Du et al. 2017). However, since EEG signals are non-stationary and discrete spatial signals, extracting only the time–frequency features in the signals cannot efficiently analyze the patterns of information interaction between brain regions, and the research results cannot fully reflect the real-time changing state of the brain.
With the development of brain science and technology, It has been shown that functional brain networks can well reflect the correlations between brain regions and their activity changes during brain activity (Sporns 2011; Wang et al. 2018b). The connectivity of the brain has a certain topological structure, and connectivity can characterize the synchronization of information interactions between brain regions (Sun et al. 2012). Synchronization means that signals from different brain regions exhibit stable relative relationships in terms of phase, amplitude, and other characteristics. Because the signal contains multiple components, there are multiple analytical methods to analyze the degree of correlation between brain regions based on the EEG signal. The degree of correlation between brain regions is resolved based on the phase information in the signal, and the features characterizing the fatigue state can be efficiently extracted from the non-stationary EEG signal. The phase information constructs a functional brain network that can reflect the difference between the brain in the awake state and the fatigue state. The components of the functional brain network that contain amplitudes can observe changes in the strength of connections between brain regions. Therefore, the information of phase and amplitude contained in the EEG signal is equally important, and either method to construct a functional brain network for fatigue driving monitoring can achieve good results.
Among many studies, breakthroughs have been made in constructing functional brain networks using the information on the phase and amplitude of EEG signals for fatigue driving monitoring. Some scholars used mean phase coherence (MPC) to measure the degree of correlation between brain regions and found that brain functional networks constructed under Delta and Alpha frequency bands in the frontal and parietal lobes showed a significant increase in brain synchronization as the driver's fatigue state increased, and the results showed that MPC could be used to distinguish between awake and fatigue states (Kong et al. 2017). Liu et al. used the directional transfer function (DTF) to calculate the synchronization relationship between all pairs of channels, the findings revealed that the DTF network constructed based on EEG signals could significantly observe the changes in information flow and connection strength in frontal and parietal brain regions during the intensification of brain fatigue state (Liu et al. 2010). A brain function network constructed based on phase lag index (PLI) was used to assess the degree of correlation of brain areas in drivers during different mental states, and stronger connectivity was obtained for fatigue than the awake state in the Theta band (Chen et al. 2018). Although many scholars have focused on constructing functional brain networks using the components of the signal phase, the amplitude of the EEG signal is also a non-negligible part. Some scholars analyze the information of signal amplitude, coherence analysis measures the degree of common power between two channels of signals at a specific frequency, and the method is proposed for the amplitude characteristics of signals. Brain functional networks were constructed by calculating ordinary coherence (OC) based on the components of signal amplitude, and analyzing the topological properties of the networks observed a significant increase in the strength of connections between awake to fatigued state brain regions (Zhao et al. 2016). Both phase and amplitude components are important components of the signal, therefore, we propose a method to solve the ALV between brain all pairs of channels, which extracts the phase component of the signal while preserving the amplitude component, and can efficiently characterize the characteristic properties of brain functional networks in different states.
The rest of this paper is as follows: the second part of the paper describes the proposed synchronization analysis method, the third part presents the experimental results and analysis, the fourth part provides a discussion of this study, and the fifth part contains Acknowledgements.
Methods
Data acquisition and preprocessing
The SEED-VIG, the public dataset of the experiments we performed is from Shanghai Jiao Tong University. As shown in Fig. 2(a) regarding the international 10–20 electrode system, with CPZ as the reference electrode, and a total of 17 channels (CP1, CP2, P1, PZ, P2, PO3, POZ, PO4, O1, OZ, O2, FT7, FT8, T7, T8, TP7, TP8) of EEG data of the signals with an actual sampling frequency of 200 Hz (Zheng and Lu 2017).
Fig. 1.

Fatigue driving monitoring framework. EEG signals are acquired from scalp electrodes a, which are arranged according to the international 10–20 standard b; the EEG signal is preprocessed by ICA as shown in Figure c; then the EMD decomposition is performed in the signal analysis section as shown in Figure d; the Hilbert transform is performed in Figure e; in addition, the adjacency matrix is constructed in the feature extraction section as shown in Figure f, and then it is converted into a topological map as shown in g; the degree, feature path length in the topological map, and clustering coefficients as shown in Fig. h; finally, the results are obtained in the classification recognition part
Fig. 2.

a is an international 10–20 electrode system and b is a simulated driving environment
A large LCD screen was set up for the experiment, and to simulate the real driving environment and make the subjects more prone to fatigue, straight and monotonous roads were set up, and the experimental scenario of simulated driving is shown in Fig. 2(b). A total of 23 subjects participated in the experiment, with an average age of 23.3 years. All subjects had a physical examination before the experiment, and all had normal vision and were in good health. Adequate sleep was guaranteed the day before the start of the experiment, food such as coffee, tea, and alcohol products were prohibited for 24 h before the experiment, and all subjects were trained in advance and familiarized with the experimental procedures. The experiments were conducted starting at 13:30 after lunch, and some of the experiments were conducted in the middle of the night. The whole process lasted for 2 h, and each subject's data contained both awake and fatigued states.
The collected raw data contains a large amount of interference information, such as eye movement artifacts and ECG artifacts. To obtain the source EEG signal, numerous scholars have preprocessed the raw data by artifact subtraction and regression methods, but these methods require recording target artifacts and remove certain valid EEG data. In recent years, Blind source separation has been widely used in the field of signal processing, and independent component analysis (ICA) has achieved good results in biomedical signal processing (James and Hesse 2004). Zheng et al. used pseudo-trace subtraction and ICA to process EEG data and extract features, and then used EOG and EEG signal feature fusion for vigilance assessment, which showed that as the fatigue level increased, the activity of Theta and Alpha bands increased Gamma band decreased (Zheng and Lu 2017). The results showed that as fatigue increased Theta and Alpha band activity increased Gamma band activity decreased. In this study, the filtering was first performed using band-pass filtering to obtain three frequency bands, Theta (4 ~ 8 Hz), Alpha (8 ~ 13 Hz), and Beta (13 ~ 30 Hz) bands, and then pre-processed using ICA. The steps of ICA are as follows, let be the observed signals. where represents the single-channel signal. is the mutually independent source signals that generate the observed signals, , the observation signal is generated by linear mixing of the source signal through an unknown matrix , i.e.:
| 1 |
With the mixing matrix and the source signal unknown, a linear transformation separation matrix is found using only the assumption that the observed signal and the source signal are statistically independent, and the solved signal is as close as possible to the true source signal (Cardoso 1998).
This study uses the SEED-VIG dataset for experiments, and the experimental procedure is processed using python (version 3.7) as well as the internal mne toolbox (version 0.22.0. https://mne.tools/0.22/index.html).
Construction of ALV Functional Connectivity Network
The method of constructing brain functional network in this study firstly obtained multiple IMFs after EMD, and then used Hilbert transform to find ALV by using IMFs as input. At the end of the last century, Huang N E proposed a method that can be used to analyze nonlinear, non-smooth signals: EMD (Huang et al. 1998), which can decompose any complex signal into a finite number of IMFs.
The decomposition process of EMD:
The Alpha band signal of one channel is input for processing, such that . The Alpha, Theta, and Beta band signals of other channels are processed in the same way.
The is fitted to the minima and maxima points by means of three spline curves to solve for the mean value of the upper and lower envelopes . If becomes a monotonic function or has only one extreme value and cannot continue to solve for , the screening process is stopped.
-
The original signal is differenced from the mean to obtain a new data sequence , as shown in Eq. (2):
2 Determine if the IMF conditions are met: (1) in the whole data set, the number of extrema and the number of zero crossings must either equal or differ at most by one; and (2) at any point, the mean value of the envelope defined by the local maxima and the envelope defined by the local minima is zero. If the condition is satisfied, get the first IMF component , let , go to step 4) to judge whether satisfies the stopping condition D; if the IMF condition is not satisfied, let , go to step 2) and continue the screening until is the original signal of an IMF component .
- To determine whether can continue the decomposition: the standard deviation (SD) is used to control whether the screening process continues, and the stopping condition is , as shown in Eq. (3), and ends the screening process if it is less than 0.25 (refer to the experimental procedure set according to citation (Huang et al. 1998), otherwise it is transferred to step 2) to continue the screening.
3
The original data is decomposed into an intrinsic mode function and a residual component as shown in Eq. (4):
| 4 |
The acquired intrinsic modal function component is Hilbert transformed to obtain , as shown in Eq. (5), where the integral term is the Cauchy principal value.
| 5 |
The instantaneous amplitude is obtained by means of Eq. (6):
| 6 |
ALV characterizes the degree of correlation between each channel, and the equations and represent the instantaneous amplitudes of the two channels, respectively. the value of ALV is defined as [0,1], where 0 indicates no synchronization and 1 indicates strong synchronization. As shown in Eq. (7):
| 7 |
There are 17 electrodes in the data set, including the left temporal lobe (FT7, T7, TP7), right temporal lobe (FT8, T8, TP8), and occipital lobe (other channels). The proposed method focuses on both signal amplitude and phase information to achieve a more comprehensive analysis of the synchronization of EEG signals. The 17 electrodes were used as nodes, and the values of ALV between nodes were used as the connection between nodes to calculate two states of fatigue and awakening on the Theta, Alpha, and Beta bands. The adjacency matrix of size 17*17 is solved, a threshold is set for binarization to construct a brain function network, and the mean value of the computational matrix is set as a threshold, and no isolated points are guaranteed. Li J et al. used the PLI as a metric to analyze the strength of association between all pairs of channels, and found that the brain regions that best characterized fatigue status were located in the frontal part by analyzing the Alpha band (Li et al. 2016). Li et al. extracted the Theta, Alpha, and Beta frequency bands of the EEG signal for analysis and used kernel principal component analysis (KPCA) analysis to derive two important effective electrodes (FP1, O1) for fatigue driving assessment with good applicability (Li et al. 2012). Therefore, the brain networks of Theta, Alpha, and Beta bands related to fatigue driving were mainly analyzed in this study.
Graph theoretical analysis
A functional brain network based on ALV was constructed to characterize the structure of connections between all pairs of channels in different mental states. Since the brain functional network is too complex, to further monitor the fatigue state of the brain, multiple topological properties of the brain functional network were extracted using graph theory in this study (Rubinov and Sporns 2010). The results of the analysis by constructing functional brain networks to extract clustering coefficients, shortest path lengths, and other features have led to significant changes in brain networks as fatigue increases and brain connectivity and clustering coefficients increase (Chen et al. 2019). Therefore three attributes were extracted from the network for analysis in this study, as shown in Table 1.
Table 1.
Network metrics
| Symbol | Concept | Explanation |
|---|---|---|
| Deg | Degree | Number of neighbors for a given node in the network |
| CPL | Characteristic path length | Path length of two nodes in the network |
| CC | Clustering coefficient http://blog.sina.com.cn/s/blog_439371b501012lgw.html | The aggregation coefficient of nodes in the network |
Deg
The degree in a network indicates that the number of connections a node has with other nodes, and the degree can be used as a metric to analyze the importance of a node in a network in some sense. The degree indicates the number of edges connecting the node to other nodes. The greater the degree the more important the node is. Degree of node :
| 8 |
CPL
The characteristic path length is the average of the shortest path length between two nodes. The shortest path of two nodes is the minimum number of edges passed from one node to another. The characteristic path length can measure the information interaction strength between two nodes, and the shorter length means the stronger information interaction between these two nodes, which can effectively characterize the connectivity of two nodes. By extracting CC and CPL as features (Han et al. 2019), the experimental results achieved a high classification accuracy. The characteristic path length is defined by Eq:
| 9 |
In the above equation is the number of shortest path edges between node and , and is the number of nodes.
CC
The clustering coefficient in complex brain function networks can characterize the degree of clustering among nodes in the network and is an important parameter to measure the grouping within the network. The clustering coefficients are divided into global and local, which can not only describe the aggregation degree of the whole network, but also characterize the aggregation degree of each node, and the global clustering coefficient is chosen as one of the features in this study. The clustering coefficient of a node in a network is the ratio of the number of edges present in the nodes connected to node to the number of possible edges present in neighbouring nodes, and the local clustering coefficient is defined by the following formula:
| 10 |
where denotes the number of neighboring nodes this node has, and denotes the number of possible edges between the neighboring nodes. In complex networks due to the high number of nodes, most will solve for the global clustering coefficients by taking the mean of the clustering coefficients for all nodes:
| 11 |
in the above equation is the total number of nodes.
Experimental results and analysis
ALV network analysis
To specifically analyze the differences in brain functional networks of subjects in different states, data from multiple subjects in fatigue and awake states were selected for experiments to increase the generalizability of the model. We divided the data into fatigue state and awake state and plotted the ALV matrix by finding the mean of the adjacency matrix separately. Kong et al. analyzed network properties such as global efficiency, feature path length, etc. by constructing a Granger causality network (GCN). The argument yields a significant change in the brain functional network constructed by the three frequency bands Theta, Alpha, and Beta during the change from awake to fatigued state, with a decrease in attention and reaction speed, Theta and Alpha bands change more significantly (Kong et al. 2015). Based on the results of previous studies, these three bands were selected in this study to construct a functional brain network for analysis to determine the specific relationship between the awake state of the brain and the brain's information-processing mechanisms.
The adjacency matrices for the fatigue and awake states are given in Fig. 3. Compared to the awake state, the activity between the channels within the temporal and occipital regions is significantly enhanced in the fatigue state. The awake state presents a more ordered state with fewer connections between the two brain regions and retains more efficient connections for information interaction; the information interaction between all channels becomes chaotic in the fatigued state, and efficient connections between temporal and occipital regions cannot be identified. These results are more consistent with other studies in the literature (Chua et al. 2017), suggesting that brain activity in the awake state is efficient in the interaction of information between brain regions. The adjacency matrix in Fig. 4 was binarized to construct the brain functional network. We can find some differences in the topological structure of brain networks in fatigue and awake states under the same network density, with more connections between channels in fatigue state and vice versa in the awake state, and the results indicate that the information interaction between channels in fatigue state is more intensive.
Fig. 3.

ALV matrix for Theta, Alpha, and Beta bands in fatigue and wakefulness states. The matrix is a 17*17 approach, where the X and Y axes correspond to 17 channels, and where the entries indicate the ALV between specific pairs of channels. The strength of the ALV is indicated with a color scale, from blue to red
Fig. 4.

ALV matrices of Fig. 2 converted to the graph. Schematic image of the head seen from above, with the positions of the 17 electrodes indicated by colored dots
Fatigue effect on topological properties
The topological properties of brain functional networks were analyzed by graph theory, and different mental states were experimentally found to be associated with the topological properties of brain functional networks. Figure 5 shows the calculated results of Deg of the brain functional network in the fatigue and awake states. As the experiment proceeded, the subjects entered the fatigue state, the connection density of the brain functional network increased, the Deg property of the Theta band was slightly greater than that of the awake state, and the Deg property of the Beta band was greater than that of the awake state in most cases. Figure 6 shows the results of CPL calculations for the two brain function networks, and the CPL values in the three frequency bands are significantly smaller in the fatigued state than in the awake state. Figure 7 calculates the CC of the functional brain network, and the CC attributes of the fatigue state are greater than those of the awake state. All three frequency bands showed a more consistent trend during brain fatigue, with Deg and CC increasing and CPL becoming shorter as the brain entered a fatigued state. This is consistent with the results of this paper in a study by Kar et al. examining the effects of sleep deprivation on brain function (Kar and Routray 2012).
Fig. 5.
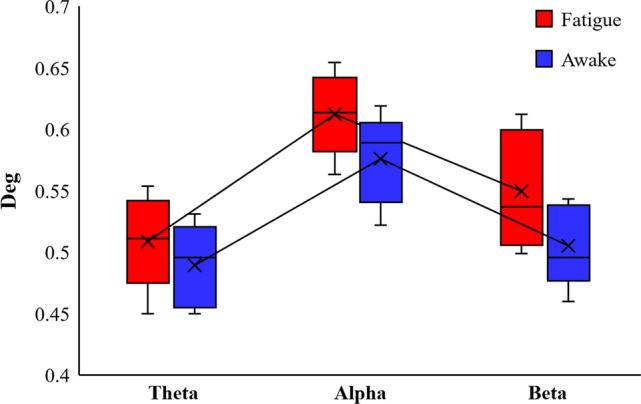
Comparison of the degree of fatigue state and awake state in the Theta, Alpha and Beta bands respectively
Fig. 6.
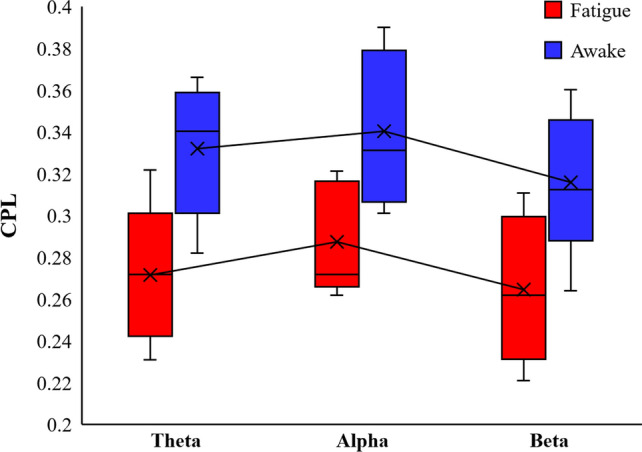
Comparison of the Characteristic path length of fatigue state and awake state in the Theta, Alpha and Beta bands respectively
Fig. 7.
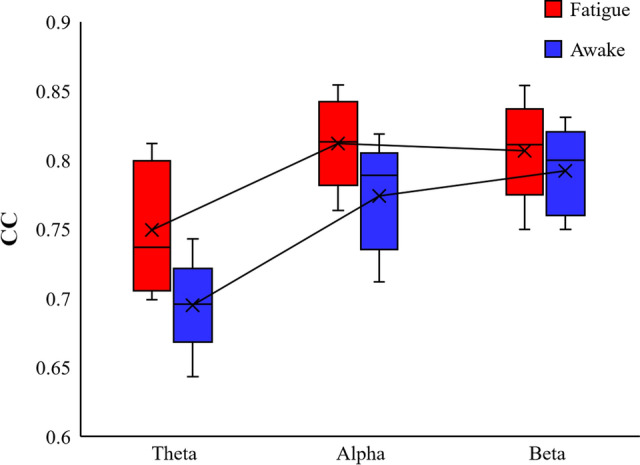
Comparison of the Clustering coefficient of fatigue state and awake state in the Theta, Alpha and Beta bands respectively
To assess whether different mental states produce significant effects on changes in the topological properties of functional brain networks. In this study, the topological properties of three ALV brain function networks, Deg, CPL, and CC, were analyzed in three frequency bands, and one-way analysis of variance (ANOVA) was used to assess whether the change in ALV network properties from the awake state to the fatigued state was significant. A value of was applied to establish the statistical significance. All statistical analyses were performed in the SPSS at the version of 23.0. (https://www.ibm.com/products/spss-statistics).
The results of the ANOVA analysis are shown in Table 2. The -values of the seven bolded test statistics were less than 0.05, except for the Deg values in the Theta band, which were greater than 0.05 in the fatigue and awake states. Significant differences in Deg, CPL, and CC were found in the Alpha and Beta bands for both fatigue and awake states, as well as in CPL and CC for the Theta band. Thus, the topological properties of the ALV network changed significantly from the awake state to the fatigue state, indicating that the network topological properties can be used to monitor the fatigue state of the driver.
Table 2.
Differential analysis of topological properties of ALV networks with different mental states
| Topological Properties | |||
|---|---|---|---|
| Deg | 0.063 | 0.041 | 0.023 |
| CPL | 0.021 | 0.006 | 0.032 |
| CC | 0.008 | 0.012 | 0.031 |
Data analysis was performed using one-way ANOVA. indicates the fatigue state Theta band. indicates the awake state Theta band. , , , represent the fatigue and awake states in the Alpha and Beta bands. Significant differences () between awake and fatigue state are highlighted in bold.
Classification
In this study, SVM and XGBoost were used for classification recognition, respectively, and three features extracted from the ALV brain function network, Deg, CPL, and CC, were input to the classifier. To construct a functional brain network based on information about signal amplitude, we used a coherence analysis method, which analyzes the degree of correlation of signal amplitudes in the frequency domain. Ten et al. computed the coherence between signals from brain regions, recording the spatially connected groups of pairs of coherent signal electrodes to construct functional units (FU), the results of the study showed that by constructing FU at low frequencies for differentiating between fatigue and awake states is more obvious (Caat et al. 2008). Both phase-locked value (PLV) and PLI are based on the information of phase to study the degree of correlation between signals. PLI can minimize the volume conductor effect, and this method has been applied in numerous brain network studies, and some research progress has been made (Chen et al. 2018). The ALV method proposed in this study analyzes the phase component while also focusing on the signal amplitude component, and the amplitude-based coherence (CO) analysis method is chosen for comparison experiments. PLI is proposed based on the improvement of the imaginary part of CO, and since coherence has been chosen for the comparison test, we have chosen PLV for the comparison test based on the phase analysis method. Cynthia A used PLV to construct a brain functional network to extract network attributes such as clustering coefficients, local efficiency, and global efficiency and obtained a high recognition rate using an artificial neural network (ANN) method for classification (Cynthia et al. 2017). In this paper, three brain functional networks were constructed using ALV, CO, and PLV, and the same network topological properties (Deg, CPL, and CC) were extracted for classification experiments, and experiments were conducted in the three frequency bands (Theta, Alpha and Beta) that best characterize the mental state of the brain. Finally, tenfold cross-validation was performed in SVM and XGBoost, respectively, and the results are shown in Fig. 8. The experimental results show that XGBoost outperforms SVM in terms of classification accuracy in all three frequency bands, and Table 3 shows the average values after tenfold cross-validation. The analysis revealed that dichotomous classification based on topological features extracted from the ALV brain function network outperformed the CO brain function network and PLV brain function network in terms of classification accuracy. The use of the component of phase in the signal (PLV) is preferable to the extraction of amplitude (CO) for classification and identification, and the Alpha band is better able to characterize the mental state of the brain compared to the other two bands, which is consistent with previous studies (Gharagozlou et al. 2015). The results of this experiment tentatively confirm that the construction of the ALV brain function network in the Alpha band is most suitable for fatigue driving monitoring.
Fig. 8.

Tenfold cross-validation using SVM and XGBoost in three frequency bands
Table 3.
Average classification accuracy of three brain function networks in SVM and XGBoost
| Accuracy (%) | SVM | XGBoost | ||||
|---|---|---|---|---|---|---|
| ALV | CO | PLV | ALV | CO | PLV | |
| Theta | 69.51 | 67.76 | 69.31 | 78.88 | 73.35 | 76.13 |
| Alpha | 72.91 | 64.91 | 66.31 | 82.84 | 76.18 | 79.05 |
| Beta | 66.93 | 59.51 | 63.89 | 76.49 | 71.09 | 73.81 |
Bold text represents significant results
Discussion
Previous studies have constructed brain functional networks for fatigue driving monitoring based on the components of signal amplitude (Zhao et al. 2016; Caat et al. 2008), and good results have been obtained for classification in different wavebands. Classification monitoring based on phase components has been studied to better characterize the mental state of the brain compared to the amplitude information in the signal, but both do not make better use of the valid information in the signal (Kong et al. 2017; Liu et al. 2010; Chen et al. 2018; Cynthia et al. 2017). In this study, to better analyze the synchronization relationship between channels, both amplitude, and phase information were selected to construct brain functional networks, and the topological properties of fatigue-related brain functional networks were mainly investigated by calculating the functional connectivity between awake and fatigue state channels, aiming to find an efficient method to be able to perform fatigue driving monitoring in real-time. We first used ICA for data preprocessing to obtain the source EEG signal, extracted the components of phase and amplitude in the EEG signal, and calculated the ALV measurement synchronization relationship to quantitatively analyze the topological properties of functional connectivity based on graph theory. It has been shown that graph theory can be used for fatigue monitoring in some vigilance tasks, and experiments have demonstrated that the topological properties of functional brain networks change continuously with the driver's mental state (Qi et al. 2019). In addition, the topological properties of the functional brain networks in fatigue and awake states were extracted separately in this study, and the experimental results showed that the connections between brain regions in fatigue state were significantly increased, while the connections between brain regions in awake state were significantly decreased, and the information interaction was more ordered.
In this study, topological properties of brain functional networks were calculated in each of the three frequency bands to analyze the properties of functional brain connections. Vecchio et al. studied the structure of brain functional networks before and after sleep based on graph theory, and the analysis showed that sleep onset is associated with Delta and Theta frequency bands and that graph theory can be used for the analysis of multi-band brain functional networks (Vecchio et al. 2017). The statistical analysis of the experimental results in this study showed that there were significant differences in the topological characteristics of the network between the fatigued and awake states, with the brain fatigue increasing and alertness gradually decreasing as the working time increased, and there were regular changes in the topological properties of the network (Deg, CPL, CC) compared to the awake state. Analysis using the ALV brain functional network showed that the CPL of individual bands became significantly shorter with increasing fatigue, and significant increases in CC and Deg attributes implied enhanced connectivity between neighboring nodes, which is consistent with some previous studies (Kar et al. 2011). CPL and CC characterize the ability to process and transmit information between brain regions. In this paper, the topological properties of functional brain networks were investigated in three wavelengths, and the analysis of experimental results illustrates the significant differences between the topological properties of functional connectivity in the fatigued brain and the awake state.
The topological properties of brain functional networks based on different frequency bands have been widely used in existing studies to analyze the characteristics of fatigue driving, and fatigue driving detection by frequency bands is a proven method. Most current studies have focused on the Theta and Delta bands (Lal and Craig 2001) and have shown that low-frequency wave activity increases throughout the cerebral cortex when the brain enters a state of fatigue (Jap et al. 2009; Craig et al. 2012). In the field of fatigue driving monitoring based on brain functional networks, previous studies have focused on network connections based on graph-theoretic statistics of their variance (Dimitrakopoulos et al. 2018). We searched for effective indicators that could be used for fatigue driving monitoring, and finally found that Deg, CPL, and CC are more sensitive for conducting fatigue driving monitoring, especially the brain functional network features in Theta and Alpha bands can efficiently characterize fatigue and awake states Two classifiers, SVM and XGBoost, were used in the experiments to evaluate the performance of the brain function network, as shown in Table 3. XGBoost achieved good classification accuracy in all three bands while showing the best classification results in Theta and Alpha bands.
Conclusion
In this study, the functional connectivity relationships between channels were investigated based on EEG signals, and features were extracted for classification using graph theory, and key connections between channels were the main features for fatigue driving monitoring. We further revealed the spatial distribution of key connections, and the results showed that the network features in the Alpha band were efficient for fatigue monitoring, especially the increase of brain area connections significantly responded to the fatigue state of the brain. However, there is some individual variation across subjects, and new subjects need to rediscover the optimal threshold, so future research can focus on how to reduce individual differences.
Acknowledgements
This work was supported by the National Natural Science Foundation of China, No. 61373116; National Natural Science Foundation of China, No. 62002287; Natural Science Basic Research Program of Shaanxi, No. 2021JQ-722; General Project in the Industrial Field of Shaanxi Province, No. 2018GY-013; Special Scientific Research Program of Shaanxi Provincial Education Department, No. 20JK0912;
Author contribution
RZ and ZW contributed equally to this work.
Data availability
SEED-VIG data not included in the manuscript can be found at: https://doi.org/10.1088/1741-2552/aa5a98. All other data are available from the authors upon reasonable request.
Declarations
Conflict of interest
The authors declare no competing financial interests.
Footnotes
Publisher's Note
Springer Nature remains neutral with regard to jurisdictional claims in published maps and institutional affiliations.
References
- Cardoso JF. Blind signal separation: statistical principles. Proc IEEE. 1998;86(10):2009–2025. doi: 10.1109/5.720250. [DOI] [Google Scholar]
- Chen J, Wang H, Hua C, et al. Graph analysis of functional brain network topology using minimum spanning tree in driver drowsiness. Cogn Neurodyn. 2018;12(6):569–581. doi: 10.1007/s11571-018-9495-z. [DOI] [PMC free article] [PubMed] [Google Scholar]
- Chen J, Wang H, Wang Q, et al. Exploring the fatigue affecting electroencephalography based functional brain networks during real driving in young males. Neuropsychologia. 2019;129:200–211. doi: 10.1016/j.neuropsychologia.2019.04.004. [DOI] [PubMed] [Google Scholar]
- Chua B L, Dai Z, Thakor N, et al. (2017) Connectome pattern alterations with increment of mental fatigue in one-hour driving simulation//2017 39th Annual International Conference of the IEEE Engineering in Medicine and Biology Society (EMBC). IEEE, 2017: 4355–4358 [DOI] [PubMed]
- Chuang CH, Huang CS, Ko LW, et al. An EEG-based perceptual function integration network for application to drowsy driving. Knowl-Based Syst. 2015;80:143–152. doi: 10.1016/j.knosys.2015.01.007. [DOI] [Google Scholar]
- Craig A, Tran Y, Wijesuriya N, et al. Regional brain wave activity changes associated with fatigue. Psychophysiology. 2012;49(4):574–582. doi: 10.1111/j.1469-8986.2011.01329.x. [DOI] [PubMed] [Google Scholar]
- Cynthia A, Patricia G, Nisrine J, et al. (2017) A new system for detecting fatigue and sleepiness using brain connectivity: EEG based estimation of fatigue, vigilance and sleepiness for drivers. In 2017 Fourth International Conference on Advances in Biomedical Engineering (ICABME). IEEE, 2017: 1–4
- Dimitrakopoulos GN, Kakkos I, Dai Z, et al. Functional connectivity analysis of mental fatigue reveals different network topological alterations between driving and vigilance tasks. IEEE Trans Neural Syst Rehabil Eng. 2018;26(4):740–749. doi: 10.1109/TNSRE.2018.2791936. [DOI] [PubMed] [Google Scholar]
- Du L H, Liu W, Zheng W L, et al. (2017) Detecting driving fatigue with multimodal deep learning. In 2017 8th International IEEE/EMBS Conference on Neural Engineering (NER). IEEE, 74–77.
- Fu R, Wang H. Detection of driving fatigue by using noncontact EMG and ECG signals measurement system. Int J Neural Syst. 2014;24(03):1450006. doi: 10.1142/S0129065714500063. [DOI] [PubMed] [Google Scholar]
- Gharagozlou F, Saraji GN, Mazloumi A, et al. Detecting driver mental fatigue based on EEG alpha power changes during simulated driving. Iran J Public Health. 2015;44(12):1693. [PMC free article] [PubMed] [Google Scholar]
- Han C, Sun X, Yang Y, et al. Brain complex network characteristic analysis of fatigue during simulated driving based on electroencephalogram Connectome pattern alterations with increment of mental fatigue in one-hour driving simulation signals. Entropy. 2019;21(4):353. doi: 10.3390/e21040353. [DOI] [PMC free article] [PubMed] [Google Scholar]
- Horng WB, Chen CY, Chang Y, et al. Driver fatigue detection based on eye tracking and dynamic template matching. IEEE Int Conf Netw Sens Control. 2004;1:7–12. [Google Scholar]
- Hu J, Liu F, Wang P (2019) EEG-Based Multiple Entropy Analysis for Assessing Driver Fatigue. In 2019 5th International Conference on Transportation Information and Safety (ICTIS). IEEE, 1290–1294.
- Huang NE, Shen Z, Long SR, et al. The empirical mode decomposition and the Hilbert spectrum for nonlinear and non-stationary time series analysis. Proc Royal Soc Lond Ser A Math Phys Eng Sci. 1998;454(1971):903–995. doi: 10.1098/rspa.1998.0193. [DOI] [Google Scholar]
- James CJ, Hesse CW. Independent component analysis for biomedical signals. Physiol Meas. 2004;26(1):R15. doi: 10.1088/0967-3334/26/1/R02. [DOI] [PubMed] [Google Scholar]
- Jap BT, Lal S, Fischer P, et al. Using EEG spectral components to assess algorithms for detecting fatigue. Expert Syst Appl. 2009;36(2):2352–2359. doi: 10.1016/j.eswa.2007.12.043. [DOI] [Google Scholar]
- Kar S, Routray A. Effect of sleep deprivation on functional connectivity of EEG channels. IEEE Trans Syst Man Cybern Syst. 2012;43(3):666–672. doi: 10.1109/TSMCA.2012.2207103. [DOI] [Google Scholar]
- Kar S, Routray A, Nayak BP. Functional network changes associated with sleep deprivation and fatigue during simulated driving: validation using blood biomarkers. Clin Neurophysiol. 2011;122(5):966–974. doi: 10.1016/j.clinph.2010.08.009. [DOI] [PubMed] [Google Scholar]
- Kong W, Lin W, Babiloni F, et al. Investigating driver fatigue versus alertness using the granger causality network. Sensors. 2015;15(8):19181–19198. doi: 10.3390/s150819181. [DOI] [PMC free article] [PubMed] [Google Scholar]
- Kong W, Zhou Z, Jiang B, et al. Assessment of driving fatigue based on intra/inter-region phase synchronization. Neurocomputing. 2017;219:474–482. doi: 10.1016/j.neucom.2016.09.057. [DOI] [Google Scholar]
- Lal SKL, Craig A. A critical review of the psychophysiology of driver fatigue. Biol Psychol. 2001;55(3):173–194. doi: 10.1016/S0301-0511(00)00085-5. [DOI] [PubMed] [Google Scholar]
- Lee H, Lee J, Shin M. Using wearable ECG/PPG sensors for driver drowsiness detection based on distinguishable pattern of recurrence plots. Electronics. 2019;8(2):192. doi: 10.3390/electronics8020192. [DOI] [Google Scholar]
- Li W, He Q, Fan X, et al. Evaluation of driver fatigue on two channels of EEG data. Neurosci Lett. 2012;506(2):235–239. doi: 10.1016/j.neulet.2011.11.014. [DOI] [PubMed] [Google Scholar]
- Li J, Lim J, Chen Y, et al. Mid-task break improves global integration of functional connectivity in lower alpha band. Front Hum Neurosci. 2016;10:304. doi: 10.3389/fnhum.2016.00304. [DOI] [PMC free article] [PubMed] [Google Scholar]
- Liu JP, Zhang C, Zheng CX. Estimation of the cortical functional connectivity by directed transfer function during mental fatigue. Appl Ergon. 2010;42(1):114–121. doi: 10.1016/j.apergo.2010.05.008. [DOI] [PubMed] [Google Scholar]
- Qi P, Ru H, Gao L, et al. Neural mechanisms of mental fatigue revisited: New insights from the brain connectome. Engineering. 2019;5(2):276–286. doi: 10.1016/j.eng.2018.11.025. [DOI] [Google Scholar]
- Rong-Ben W, Ke-You G, Shu-Ming S, et al. (2003) A monitoring method of driver fatigue behavior based on machine vision. IEEE IV2003 Intelligent Vehicles Symposium. 2003: 110–113
- Rubinov M, Sporns O. Complex network measures of brain connectivity: uses and interpretations. Neuroimage. 2010;52(3):1059–1069. doi: 10.1016/j.neuroimage.2009.10.003. [DOI] [PubMed] [Google Scholar]
- Sporns O. The human connectome: a complex network. Ann N Y Acad Sci. 2011;1224(1):109–125. doi: 10.1111/j.1749-6632.2010.05888.x. [DOI] [PubMed] [Google Scholar]
- Sun J, Hong X, Tong S. Phase synchronization analysis of EEG signals: an evaluation based on surrogate tests. IEEE Trans Biomed Eng. 2012;59(8):2254–2263. doi: 10.1109/TBME.2012.2199490. [DOI] [PubMed] [Google Scholar]
- Ten Caat M, Lorist MM, Bezdan E, et al. High-density EEG coherence analysis using functional units applied to mental fatigue. J Neurosci Methods. 2008;171(2):271–278. doi: 10.1016/j.jneumeth.2008.03.022. [DOI] [PubMed] [Google Scholar]
- Vecchio F, Miraglia F, Gorgoni M, et al. Cortical connectivity modulation during sleep onset: a study via graph theory on EEG data. Hum Brain Mapp. 2017;38(11):5456–5464. doi: 10.1002/hbm.23736. [DOI] [PMC free article] [PubMed] [Google Scholar]
- Vural E, Cetin M, Ercil A, et al. Drowsy driver detection through facial movement analysis. Berlin, Heidelberg: International Workshop on Human-Computer Interaction. Springer; 2007. pp. 6–18. [Google Scholar]
- Wang H, Dragomir A, Abbasi NI, et al. A novel real-time driving fatigue detection system based on wireless dry EEG. Cogn Neurdyn. 2018;12(4):365–376. doi: 10.1007/s11571-018-9481-5. [DOI] [PMC free article] [PubMed] [Google Scholar]
- Wang F, Zhang X, Fu R, et al. EEG characteristic analysis of coach bus drivers based on brain connectivity as revealed via a graph theoretical network. RSC Adv. 2018;8(52):29745–29755. doi: 10.1039/C8RA04846K. [DOI] [PMC free article] [PubMed] [Google Scholar]
- Wang Z, Zhou X, Wang W, et al. Emotion recognition using multimodal deep learning in multiple psychophysiological signals and video. Int J Mach Learn Cybern. 2020;11(4):923–934. doi: 10.1007/s13042-019-01056-8. [DOI] [Google Scholar]
- Wang Q, Yang J, Ren M, et al. (2006) Driver fatigue detection: a survey. In 2006 6th world congress on intelligent control and automation. IEEE, 2: 8587-8591
- Xiong Y, Gao J, Yang Y, et al. Classifying driving fatigue based on combined entropy measure using EEG signals. Int J Control Autom. 2016;9(3):329–338. doi: 10.14257/ijca.2016.9.3.30. [DOI] [Google Scholar]
- Zhao C, Zhao M, Yang Y, et al. The reorganization of human brain networks modulated by driving mental fatigue. IEEE J Biomed Health Inform. 2016;21(3):743–755. doi: 10.1109/JBHI.2016.2544061. [DOI] [PubMed] [Google Scholar]
- Zheng W-L, Lu B-L. A multimodal approach to estimating vigilance using EEG and forehead EOG. J Neural Eng. 2017;14(2):026017. doi: 10.1088/1741-2552/aa5a98. [DOI] [PubMed] [Google Scholar]
Associated Data
This section collects any data citations, data availability statements, or supplementary materials included in this article.
Data Availability Statement
SEED-VIG data not included in the manuscript can be found at: https://doi.org/10.1088/1741-2552/aa5a98. All other data are available from the authors upon reasonable request.