

Abstract
Aims
This study sought to investigate the association between blood pressure (BP) trajectories from early to middle adulthood and echocardiographic indices of structure and function in middle age.
Methods and results
This prospective cohort study included 4717 black and white adults aged 18–30 years at baseline (1985–86) who were followed over 30 years in the Coronary Artery Risk Development in Young Adults (CARDIA) study. Trajectories of systolic BP (SBP), diastolic BP (DBP), and pulse pressure (PP) from the Year 0 examination to Year 30 examination were identified using latent mixture modelling. Echocardiographic indices of myocardial structure, systolic function, and diastolic function were assessed at the Year 30 examination. Five distinct SBP trajectory groups were identified: low‐stable [1110 participants (23.5%)], moderate‐stable [2188 (46.4%)], high‐stable [850 (18.0%)], moderate‐increasing [416 (8.8%)], and high‐increasing [153 (3.2%)]. After adjustment for clinical variables, a significant decreasing trend was observed from the high‐increasing and moderate‐increasing groups through to the low‐stable group for left ventricular (LV) mass index [mean (SE): high‐increasing, 112.3 (3.4); moderate‐increasing, 99.3 (2.6); high‐stable, 88.9 (2.5); moderate‐stable, 86.1 (2.3); low‐stable, 82.1 (2.4), P trend < 0.01], as well as LV end‐diastolic dimension, left atrial volume index, and E/e′, while an increasing trend was apparent for LV longitudinal strain, E/A ratio, and average e′ velocities. Results were generally consistent for trajectories of DBP and PP.
Conclusions
Higher BP trajectories from early to middle adulthood were associated with worse indices of myocardial modelling and LV systolic and diastolic function at middle age.
Keywords: Blood pressure, Trajectories, Echocardiography, Myocardial structure and function
Background
Heart failure (HF) is a major cause of morbidity and mortality and has deleterious impacts on economic burden worldwide. 1 , 2 , 3 Hypertension is a well‐established risk factor for the development of HF. 1 , 4 Most longstanding hypertension ultimately leads to HF. 5 According to the model proposed by Vasan and Levy, the time course of progression from hypertension to HF may take several decades. 6 Therefore, prevention of hypertension early in life may substantially prolong HF‐free survival.
Epidemiological studies have shown that elevated blood pressure (BP) is associated with adverse alterations in myocardial structure and function. 7 , 8 However, most studies were conducted in middle aged or older adults and mainly included myocardial structure as the outcome of interest (e.g. hypertrophy). Importantly, previous investigations primarily focused on assessing the relationship between cumulative and average BP levels, and subsequent echocardiographic outcomes. In actuality, individual patterns of BP changes throughout the life course are often highly variable among individuals. These prior studies ignored the dynamic changes in BP over time and the potential diversity in BP developmental patterns.
Recent evidence suggests heterogeneous BP trajectories exist and are associated with an increased risk for cardiovascular disease (CVD). 9 , 10 , 11 , 12 , 13 The association of the longitudinal trajectories of BP from early adulthood onwards with myocardial structure and left ventricular (LV) systolic and diastolic function in middle age remains unknown. Assessing trajectories of BP over time might better characterize the association between BP and echocardiography outcomes.
Aims
Using data from the Coronary Artery Risk Development in Young Adults (CARDIA) study, we sought to evaluate the association of trajectory of BP from early adulthood (ages 18–30 years) to middle age (ages 48–60 years) with echocardiographic indices of cardiac structure and function in middle age.
Methods
Data availability
Anonymized data were obtained from the CARDIA Coordinating Center (cardia.dopm.uab.edu/contact‐cardia). The National Heart, Lung, and Blood Institute policies governing the data and describing its access are described online (https://www.cardia.dopm.uab.edu/study‐information/nhlbi‐data‐repository‐data). This article has been reviewed by CARDIA for scientific content.
Study population
The CARDIA is a prospective multicentre population‐based longitudinal cohort study designed to investigate the development of cardiovascular risk and disease. A total of 5115 black and white men and women aged 18 to 30 years between 1985 and 1986 (Year 0) were recruited from 4 US cities (Birmingham, Alabama; Chicago, Illinois; Minneapolis, Minnesota; and Oakland, California). Study recruitment was approximately balanced on age, sex, race, and education. Serial follow‐up examinations were conducted at Years 2, 5, 7, 10, 15, 20, 25, and 30 after baseline (Year 0), and retention rates across examinations were 91%, 86%, 81%, 79%, 74%, 72%, 72%, and 71%, respectively. All participants provided written informed consent at each examination, and institutional review boards from each field centre approved the study protocols. For the current analysis, participants with BP measures at 3 or more examinations during the 30 years of follow‐up (Year 0 to Year 30) and echocardiography available at Year 30 were included in the analysis. Of the 5115 participants, 4717 with 3 or more BP measurements during follow‐up were included in BP trajectory modelling. Of these, 3174 participants with Year 30 echocardiography data were included in investigating the association between BP trajectories and echocardiographic outcomes.
Blood pressure measurements
Blood pressure was measured on the right arm with a Hawksley random zero sphygmomanometer (WA Baum Company, Copaigue, NY) by trained research staff using standardized methods after the participant had rested for 5 min at Years 0, 2, 5, 7, 10, and 15. From Year 20 onwards, a digital BP monitor (Omron HEM‐907XL; Online Fitness, Santa Monica, CA) was used. Three measurements were obtained at 1 min intervals. The average of the second and third measurements was used for the analysis. These BP measurements were calibrated and standardized to the sphygmomanometer measures, so that no machine bias remained.
We evaluated trajectories in systolic BP (SBP), diastolic BP (DBP), and pulse pressure (PP).
Echocardiography
Comprehensive two‐dimensional, M‐mode, and Doppler echocardiography was performed using standard equipment (Apilo Artida scanner; Toshiba Medical Systems) by trained sonographers across all field centres at the Year 30 examination. Quality control procedures assessed intrasonographer and intersonographer reliability throughout the Year 30 examination. 14 Sonographers made measurements from digitized images using a standard off‐line image analysis system (Digisonics, Houston, Texas). Studies were sent electronically to the echocardiography core reading centre (Johns Hopkins University, Baltimore, Maryland). Left atrial (LA) volume and LV ejection fraction were measured using the apical two‐chamber and four‐chamber views based on the American Society of Echocardiography guidelines. 15 LV mass was calculated using the Devereux formula. 16 LV end‐diastolic dimension was measured from the parasternal long‐axis view. LV mass, LA volume, and LV diastolic dimension were indexed to body surface area. Peak velocities of the early phase (E) and late phase (A) of the mitral inflow, and their ratio (E/A ratio) were measured from pulse‐wave Doppler echocardiography recordings of mitral flow. Early peak diastolic mitral annular velocities (e′) were measured using tissue Doppler at the lateral and septal mitral annulus. E/e′ was defined as the E wave divided by the average of the septal and lateral e′ velocities and was used as an index of LV filling pressures. Speckle‐tracking echocardiography was performed using dedicated semiautomated software (Toshiba Medical Systems). LV strain curves were generated using three cardiac cycles. LV longitudinal strain curves were assessed from the apical four‐chamber view. LV circumferential strain was assessed from the mid‐LV cavity short‐axis view. Peak systolic strain was obtained from six segments of the LV in either the apical or short‐axis views. LV longitudinal strain and LV circumferential strain were subsequently calculated by averaging the peak systolic strain of the six segments from the apical four‐chamber and short‐axis views.
Covariates
Demographics, years of education, smoking status, history of alcohol use, and antihypertensive medication use were obtained by self‐administered and interviewer‐administered questionnaires. The Physical Activity History questionnaire was used to query the amount of time per week spent in 13 categories of leisure, occupational, and household physical activities during the previous 12 months. The details are described in the Methods in the Supporting Information. Body mass index (BMI) was calculated as weight in kilograms divided by height in metres squared. Glucose was measured using hexokinase coupled to glucose‐6‐phosphate dehydrogenase by Linco Research (St. Louis, MO). Total cholesterol was assayed enzymatically.
Statistical analysis
Trajectories of SBP, DBP, and PP were modelled among 4717 CARDIA participants with BP measured during at least three or more examinations from Year 0 to Year 30. BP data for Year 0 and Year 30 were available for all participants. Models were fit using PROC TRAJ in SAS Version 9.4 statistical software (SAS Institute, Inc). 17 The Traj procedure is a semiparametric, group‐based modelling strategy that uses a discrete mixture model to identify subgroups of CARDIA participants who shared similar underlying BP trajectories. Models were tested with different numbers of trajectory groups (ranging from 2 to 5) and with different orders of polynomials (linear, quadratic, or cubic). Model fit was assessed using the Bayesian information criterion (Supporting Information, Table S1 ). The posterior probability of group membership, that is, the probability of an individual belonging to each of the trajectory groups, was calculated for each individual to assess model's discrimination power. Ideally, average posterior probability equals 1, with values closer to 1 indicating greater precision. An average posterior probability > 0.7 was considered satisfactory. 10 , 17 , 18 The supplement includes additional details on the trajectory modelling process.
Differences between groups were tested by the χ 2 test for categorical data, and one‐way ANOVA or Kruskal–Wallis for continuous data. Multivariable linear models were used to assess the association of trajectory group with echocardiographic outcomes: myocardial structure (LV mass index, LV diastolic dimension, and LA volume index), LV systolic function (LV ejection fraction, LV longitudinal strain, and LV circumferential strain), and LV diastolic function (E/A ratio, average e′ velocity, and average E/e′ ratio). Models were adjusted for the Year 30 covariates: age, sex, race, education, smoking, alcohol consumption, BMI, physical activity, antihypertensive medication use (Year 0 to Year 30), baseline SBP and DBP, diabetes mellitus, hyperlipidaemia, atrial fibrillation, and myocardial infarction. P trend for linear associations across the trajectory groups were calculated.
To test the robustness of our findings, we performed the following three sensitivity analyses: (i) We evaluated trajectories in mean arterial pressure (MAP, calculated as 1/3 SBP + 2/3 DBP); (ii) to assess whether antihypertensive medication use could change BP trajectory patterns, participants taking antihypertensive medications during follow‐up were excluded; and (iii) the main analysis was repeated applying inverse probability of censoring weights (IPCW) to account for biases introduced by participants who did not attend the Year 30 examination. IPCW is a statistical method that corrects for bias resulting from the exclusion of study participants that are systematically different from those included. 19 Using this method, observations are weighted by the inverse of the probability of the observation being included in the study.
A P value < 0.05 was considered statistically significant. All tests were two‐sided. All analyses were performed using SAS, Version 9.4 (SAS Institute).
Results
Population characteristics
The 4717 participants who had at least 3 measures of BP over the 30 year follow‐up period from early adulthood to middle age were included in trajectory analyses. Of these, 3174 participants with Year 30 echocardiography data were included in the final analytic cohort. Compared with the final analytic cohort, those who were excluded were slightly younger (25.0 years vs. 24.4 years), more likely to be black, male, current smokers, and to have a higher SBP level and fasting glucose at baseline. There was no significant difference in BMI levels, alcohol consumption, physical activity, total cholesterol, and DBP level (Supporting Information, Table S2 ). Participant characteristics at the Year 0 and Year 30 examinations are shown in Supporting Information, Table S3 .
Characteristics of BP trajectory groups
Trajectories were modelled separately for three BP indices, namely, SBP, DBP, and PP. Five distinct trajectories were identified for SBP and DBP (Figure 1 ), namely, low‐stable, moderate‐stable, high‐stable, moderate‐increasing, and high‐increasing trajectories [distribution of participants among the aforementioned trajectories: SBP: 1110 (23.5%), 2188 (46.4%), 850 (18.0%), 416 (8.8%), 153 (3.2%); DBP: 905 (19.2%), 2118 (44.9%), 954 (20.2%), 526 (11.2%), 214 (4.5%)]. The mean posterior probability for all trajectories was high indicating good discrimination of trajectory assignment (mean posterior probability for each trajectory was SBP: 0.90, 0.86, 0.86, 0.86, 0.94; DBP: 0.86, 0.82, 0.81, 0.79, 0.91). Trajectories in SBP and DBP shared several common characteristics. For SBP and DBP trajectories, the low‐stable, moderate‐stable, and high‐stable trajectories maintained consistently low, moderate, and high BP levels, respectively, throughout follow‐up. The moderate‐increasing and high‐increasing groups started with moderate and high BP levels, respectively. For SBP trajectories, BP values in the moderate‐increasing groups rose at a rapid rate from the Year 10 examination, while a more constant increase was apparent for DBP. The high‐increasing groups maintained relatively elevated BP levels throughout follow‐up.
Figure 1.

Trajectories of (A) systolic blood pressure and (B) diastolic blood pressure over 30 years. Dashed lines indicate 95% confidence intervals.
In addition, five distinct trajectories were identified for PP (Figure 2A ), namely, low‐stable, moderate‐stable, high‐stable, low‐increasing, and moderate‐increasing trajectories [distribution of participants among PP trajectories: 2222 (47.1%), 434 (9.2%), 130 (2.8%), 1638 (34.7%), 293 (6.2%)]. The mean posterior probability for each trajectory follows: 0.86, 0.76, 0.87, 0.79, 0.87. The low‐stable, moderate‐stable, and high‐stable trajectories maintained consistently low, moderate, and high BP levels, respectively, throughout follow‐up. The low‐increasing group started with low BP levels and experienced a rapid increase from the Year 10 examination. The moderate‐increasing group started with moderate BP levels and experienced a rapid increase from the Year 10 examination.
Figure 2.
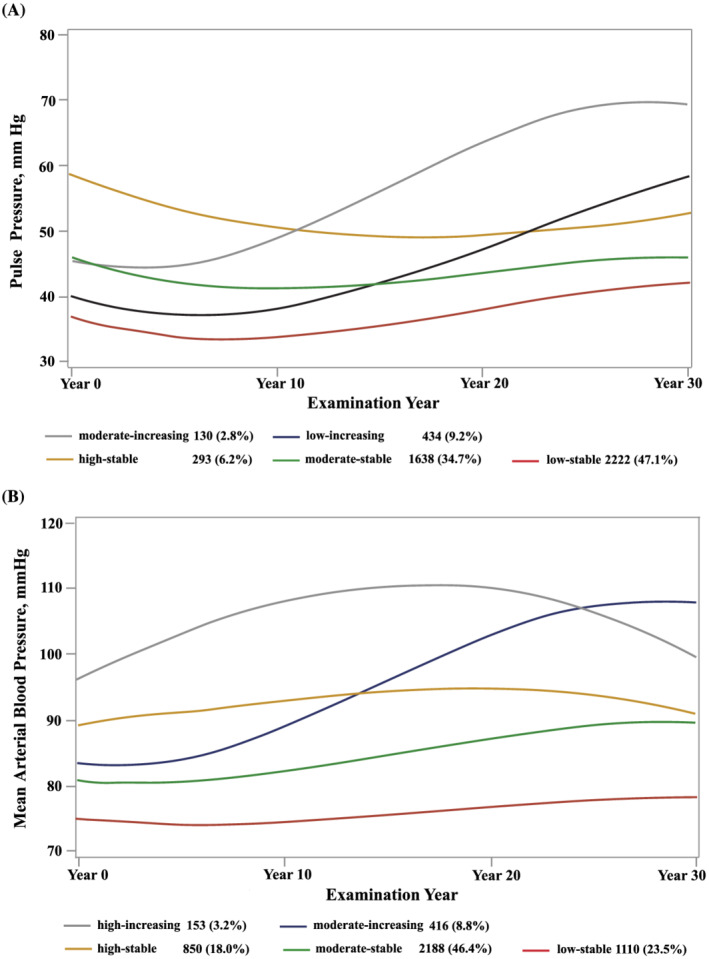
Trajectories of (A) pulse pressure and (B) mean arterial pressure over 30 years. Dashed lines indicate 95% confidence intervals.
Of the 3174 participants, 36 participants had a history of HF, and 3 of them had new onset HF. Characteristics of the participants at the Year 30 examination in each SBP group are presented in Table 1 . Compared with participants in the low‐stable group, those in the moderate‐increasing and high‐increasing groups were more likely to be black, less highly educated, and to have more pronounced CVD risk factors (Table 1 ). Group characteristics for DBP and PP trajectories had similar Year 30 characteristics to corresponding SBP trajectory groups (Supporting Information, Tables S4 and S5 ).
Table 1.
Participants characteristics at Year 30 examination by systolic blood pressure trajectory group
| Low‐stable (n = 804) | Moderate‐stable (n = 1441) | High‐stable (n = 532) | Moderate‐increasing (n = 318) | High‐increasing (n = 79) | P value | |
|---|---|---|---|---|---|---|
| Age, mean (SD), years | 55.0 (3.6) | 54.8 (3.6) | 55.2 (3.5) | 54.9 (3.5) | 56.3 (3.1) | 0.002 |
| Black race, no. (%) | 214 (26.6) | 709 (49.2) | 302 (56.8) | 232 (73.0) | 67 (84.8) | <0.001 |
| Female, no. (%) | 638 (79.4) | 794 (55.1) | 146 (27.4) | 195 (61.3) | 32 (40.5) | <0.001 |
| Body mass index, mean (SD), kg/m2 | 28.0 (6.3) | 30.5 (6.6) | 31.8 (6.8) | 32.4 (6.4) | 34.3 (8.3) | <0.001 |
| Educational attainment, mean (SD), years | 15.4 (1.8) | 14.8 (1.9) | 14.4 (1.9) | 14.3 (2.0) | 13.5 (1.8) | <0.001 |
| Smoking status, no. (%) | <0.001 | |||||
| Current | 74 (9.3) | 192 (13.4) | 90 (17.4) | 68 (21.7) | 13 (16.9) | |
| Former | 207 (26.0) | 340 (23.8) | 100 (19.3) | 65 (20.7) | 21 (27.3) | |
| Never | 515 (64.7) | 896 (62.7) | 328 (63.3) | 181 (57.6) | 43 (55.8) | |
| Alcohol consumption, median (IQR), drinks per week | 2 (0–6) | 1 (0–6) | 1 (0–6) | 2 (0–8) | 0 (0–3) | 0.010 |
| Physical activity, mean (SD), exercise units | 335 (251) | 330 (278) | 324 (274) | 257 (259) | 277 (295) | <0.001 |
| Total cholesterol, mean (SD), mg/dL | 197.4 (35.4) | 192.1 (37.8) | 180.6 (39.9) | 192.3 (36.9) | 180.1 (42.1) | <0.001 |
| Fasting glucose, mean (SD), mg/dL | 94.2 (16.2) | 102.2 (29.4) | 108.4 (33.0) | 111.6 (51.8) | 122.9 (58.2) | <0.001 |
| Antihypertensive medication, no. (%) | 48 (6.0) | 418 (29.1) | 326 (61.4) | 182 (57.4) | 65 (82.3) | <0.001 |
| SBP, mean (SD), mmHg | 105.9 (9.2) | 120.7 (10.8) | 124.0 (12.2) | 148.5 (15.3) | 141.3 (18.1) | <0.001 |
| DBP, mean (SD), mmHg | 65.2 (7.8) | 74.7 (8.5) | 76.0 (9.4) | 88.5 (10.6) | 82.5 (13.2) | <0.001 |
| Diabetes mellitus, no. (%) | 51 (6.3) | 198 (13.7) | 132 (24.8) | 69 (21.7) | 36 (45.6) | <0.001 |
| Hyperlipidaemia, no. (%) | 162 (20.1) | 412 (28.6) | 219 (41.2) | 79 (24.8) | 33 (41.8) | <0.001 |
| Atrial fibrillation, no. (%) | 8 (1.0) | 12 (0.8) | 8 (1.5) | 4 (1.3) | 0 (0.0) | 0.494 |
| Myocardial infarction, no. (%) | 8 (1.0) | 16 (1.1) | 15 (2.8) | 2 (0.6) | 5 (6.3) | 0.002 |
| Stroke, no. (%) | 3 (0.4) | 13 (0.9) | 18 (3.4) | 9 (2.8) | 11 (13.9) | <0.001 |
| Peripheral vascular disease, no. (%) | 0 (0.0) | 2 (0.1) | 1 (0.2) | 1 (0.3) | 1 (1.3) | — |
DBP, diastolic blood pressure; IQR, interquartile range; SBP, systolic blood pressure; SD, standard deviation.
Blood pressure trajectories and myocardial structure and function
Values of myocardial structural and functional indices across trajectories for SBP, DBP, and PP, after multivariable adjustment, are shown in Tables 2 , 3 , 4 .
Table 2.
Association of systolic blood pressure trajectory groups with indices of myocardial structure and function at Year 30 examination
| Echocardiographic variable | Trajectory group, adjusted least squares mean (SE) | |||||
|---|---|---|---|---|---|---|
| Low‐stable | Moderate‐stable | High‐stable | Moderate‐increasing | High‐increasing | P trend | |
| Myocardial structure | ||||||
| LV mass indexed, g/m2 | 82.1 (2.4) | 86.1 (2.3) | 88.9 (2.5) | 99.3 (2.6) | 112.3 (3.4) | <0.001 |
| LV diastolic dimension indexed, cm/m2 | 2.36 (0.03) | 2.37 (0.03) | 2.37 (0.03) | 2.40 (0.03) | 2.45 (0.04) | 0.010 |
| LA volume indexed, mL/m2 | 28.5 (0.8) | 28.4 (0.8) | 29.1 (0.9) | 30.7 (0.9) | 33.3 (1.2) | <0.001 |
| Myocardial systolic function | ||||||
| LVEF | 55.7 (0.7) | 55.2 (0.7) | 54.9 (0.7) | 55.0 (0.3) | 54.5 (1.0) | 0.086 |
| LV | ||||||
| Longitudinal strain | −13.3 (0.4) | −12.9 (0.3) | −12.9 (0.4) | −12.4 (0.4) | −12.6 (0.4) | <0.001 |
| Circumferential strain | −12.7 (0.5) | −12.4 (0.5) | −12.2 (0.5) | −11.7 (0.5) | −12.6 (0.7) | 0.008 |
| Myocardial diastolic function | ||||||
| E/A | 1.41 (0.04) | 1.34 (0.04) | 1.29 (0.04) | 1.27 (0.05) | 1.18 (0.06) | <0.001 |
| Average e′, cm/s | 10.7 (0.3) | 10.1 (0.3) | 9.9 (0.3) | 8.9 (0.3) | 8.9 (0.4) | <0.001 |
| E/e′ | 8.3 (0.3) | 8.7 (0.3) | 8.9 (0.3) | 9.9 (0.3) | 10.0 (0.4) | <0.001 |
LA, left atrial; LV, left ventricular; LVEF, left ventricular ejection fraction.
Models are adjusted for age, race, sex, body mass index, educational attainment, smoking, alcohol consumption, physical activity, antihypertensive medication use (Year 0 to Year 30), systolic and diastolic blood pressure at baseline, diabetes mellitus, hyperlipidaemia, atrial fibrillation, and myocardial infarction.
Table 3.
Association of diastolic blood pressure trajectory groups with indices of myocardial structure and function at Year 30 examination
| Echocardiographic variable | Trajectory group, adjusted least squares mean (SE) | |||||
|---|---|---|---|---|---|---|
| Low‐stable | Moderate‐stable | High‐stable | Moderate‐increasing | High‐increasing | P trend | |
| Myocardial structure | ||||||
| LV mass indexed, g/m2 | 86.0 (2.5) | 85.0 (2.4) | 85.7 (2.5) | 94.3 (2.6) | 99.3 (3.2) | <0.001 |
| LV diastolic dimension indexed, cm/m2 | 2.40 (0.03) | 2.35 (0.03) | 2.35 (0.03) | 2.36 (0.03) | 2.40 (0.03) | 0.351 |
| LA volume indexed, mL/m2 | 29.8 (0.9) | 28.2 (0.8) | 28.4 (0.9) | 29.0 (0.9) | 31.0 (1.1) | 0.577 |
| Myocardial systolic function | ||||||
| LVEF | 55.7 (0.7) | 55.5 (0.7) | 55.1 (0.7) | 54.8 (0.7) | 53.4 (0.9) | 0.002 |
| LV | ||||||
| Longitudinal strain | −13.8 (0.4) | −12.9 (0.3) | −12.6 (0.4) | −12.4 (0.4) | −11.8 (0.5) | <0.001 |
| Circumferential strain | −12.9 (0.5) | −12.4 (0.5) | −12.0 (0.5) | −11.7 (0.5) | −11.6 (0.6) | <0.001 |
| Myocardial diastolic function | ||||||
| E/A | 1.47 (0.04) | 1.33 (0.04) | 1.30 (0.04) | 1.22 (0.04) | 1.24 (0.05) | <0.001 |
| Average e′, cm/s | 10.9 (0.3) | 10.1 (0.3) | 9.7 (0.3) | 8.9 (0.3) | 9.3 (0.3) | <0.001 |
| E/e′ | 8.5 (0.3) | 8.7 (0.3) | 8.8 (0.3) | 9.4 (0.3) | 9.2 (0.4) | <0.001 |
LA, left atrial; LV, left ventricular; LVEF, left ventricular ejection fraction.
Models are adjusted for age, race, sex, body mass index, educational attainment, smoking, alcohol consumption, physical activity, antihypertensive medication use (Year 0 to Year 30), systolic and diastolic blood pressure at baseline, diabetes mellitus, hyperlipidaemia, atrial fibrillation, and myocardial infarction.
Table 4.
Association of pulse pressure trajectory groups with indices of myocardial structure and function at Year 30 examination
| Echocardiographic variable | Trajectory group, adjusted least squares mean (SE) | |||||
|---|---|---|---|---|---|---|
| Low‐stable | Moderate‐stable | High‐stable | Low‐increasing | Moderate‐increasing | P trend | |
| Mean arterial pressure | ||||||
| Myocardial structure | ||||||
| LV mass indexed, g/m2 | 82.8 (2.3) | 86.3 (2.4) | 92.1 (2.8) | 93.3 (2.5) | 108.4 (3.2) | <0.001 |
| LV diastolic dimension indexed, cm/m2 | 2.34 (0.03) | 2.38 (0.03) | 2.42 (0.03) | 2.39 (0.03) | 2.47 (0.04) | <0.001 |
| LA volume indexed, mL/m2 | 27.9 (0.8) | 29.0 (0.8) | 31.5 (1.0) | 29.7 (0.9) | 32.8 (1.1) | <0.001 |
| Myocardial systolic function | ||||||
| LVEF, % | 55.2 (0.7) | 55.4 (0.7) | 56.0 (0.8) | 55.5 (0.7) | 54.3 (0.9) | 0.838 |
| LV longitudinal strain, % | −12.8 (0.3) | −13.3 (0.3) | −13.5 (0.4) | −12.6 (0.4) | −13.2 (0.5) | 0.811 |
| LV circumferential strain, % | −12.1 (0.5) | −12.8 (0.5) | −12.7 (0.6) | −12.1 (0.5) | −13.1 (0.6) | 0.359 |
| Myocardial diastolic function | ||||||
| E/A | 1.33 (0.04) | 1.34 (0.04) | 1.41 (0.05) | 1.34 (0.04) | 1.37 (0.05) | 0.162 |
| Average e′, cm/s | 10.2 (0.3) | 10.1 (0.3) | 10.2 (0.3) | 9.8 (0.3) | 9.6 (0.3) | 0.001 |
| E/e′ | 8.4 (0.3) | 8.6 (0.3) | 9.2 (0.3) | 9.2 (0.3) | 10.6 (0.4) | <0.001 |
LA, left atrial; LV, left ventricular; LVEF, left ventricular ejection fraction.
Models are adjusted for age, race, sex, body mass index, educational attainment, smoking, alcohol consumption, physical activity, antihypertensive medication use (Year 0 to Year 30), systolic and diastolic blood pressure at baseline, diabetes mellitus, hyperlipidaemia, atrial fibrillation, and myocardial infarction.
For SBP trajectories (Table 2 ), a significant decreasing trend was observed from the high‐increasing and moderate‐increasing groups through to the low‐stable group for LV mass index, LV end‐diastolic dimension, LA volume index, and E/e′ ratio, while an increasing trend was apparent for LV longitudinal strain, E/A ratio, and average e′ velocities. There were no significant trends in LV ejection fraction.
For DBP trajectories (Table 3 ), a significant decreasing trend was observed from the high‐increasing and moderate‐increasing groups through to the low‐stable group for LV mass index and higher E/e′ ratio, while an increasing trend was apparent for LV ejection fraction, LV longitudinal strain, LV circumferential strain, E/A ratio, and average e′ velocities. There were no significant trends in LV end‐diastolic dimension or LA volume index.
For PP trajectories (Table 4 ), a significant decreasing trend was observed from the moderate‐increasing and low‐increasing groups through to the low‐stable group for LV mass index, LV end‐diastolic dimension, LA volume index, and E/e′, while an increasing trend was apparent for average e′ velocities. There were no significant trends in LV ejection fraction, LV longitudinal strain, LV circumferential strain, or E/A ratio.
Sensitivity analyses
In sensitivity analyses, (i) trajectory patterns in MAP were similar to those in SBP and DBP (Figure 2B ). The association between MAP trajectory groups and echocardiographic outcomes was generally consistent with SBP and DBP trajectory groups (Supporting Information, Table S6 ). (ii) Excluding participants taking antihypertensive medications during follow‐up produced generally similar trajectory patterns (Supporting Information, Figure S1 ) and did not substantially alter the significant association of BP trajectory groups with echocardiographic outcomes (Supporting Information, Table S7 ). (iii) Additionally, on accounting for selective attrition using IPCW, results were similar to the main analysis (Supporting Information, Table S8 ).
Discussion
In this community‐based cohort of young adults followed up over 30 years, we identified five distinct trajectories in SBP, DBP, and PP that were significantly associated with adverse alterations in myocardial structure, and systolic and diastolic LV function in middle age independent of baseline BP levels. In particular, groups with sustained high BP levels across early to middle adulthood (high‐increasing group) and those with a rapid increase in BP levels (moderate‐increasing group) had the highest degree of adverse myocardial structural and functional changes in middle age.
Prior studies have revealed associations between elevated BP and adverse myocardial structural and functional changes. The Framingham Heart Study demonstrated that 30 year average SBP is a better predictor of LV mass and wall thickness compared with current BP. 8 The British Birth Cohort study investigated the relationship of changes in SBP between two time points over different periods of adulthood (36–43, 43–53, 53–60/64 years) with myocardial remodelling and identified 43–53 years as a potential sensitive period when rise in SBP is associated with higher LV mass index. 7 However, these prior studies did not describe the specific patterns of BP development and thus fail to quantify the population impact of different BP trajectories over time on later‐life echocardiographic outcomes.
Through the utilization of a group‐based modelling approach, the developmental course of BP may be mapped, and individuals can be categorized into exclusive groups across their lifespan. This helps to conceptualize the pathways of progression of BP levels and their impact on cardiovascular events. A number of studies have prospectively explored BP trajectories at different periods of life and consistently found higher BP trajectories to be associated with subsequently increased risk of adverse health outcomes including coronary artery calcification, 9 impaired renal function, 10 , 20 incident atrial fibrillation, 13 , 21 and stroke. 22 , 23
The Georgia Stress and Heart (GSH) study, to our knowledge, is the only study to have used group‐based modelling to investigate BP trajectory in relation to myocardial structure. Three trajectory groups in BP over 23 years from childhood to young adulthood were identified in 683 participants. A faster rate of increase in BP was significantly associated with LV mass index levels in young adulthood. 11 However, this study was limited as the sample was small and relatively young. Additionally, only one echocardiographic parameter (i.e. LV mass index) was analysed as an outcome of interest. The present study addresses these deficiencies by following a sizeable sample, representing an older age group (early to middle adulthood), and including comprehensive echocardiographic outcomes (myocardial structure and function) in the analysis.
This study comprehensively assesses the association of BP trajectories from early adulthood throughout middle age with myocardial structure and systolic and diastolic LV function in middle age. The results extend existing knowledge by demonstrating that individuals with sustained high BP levels and with a rapid increase in BP levels across early to middle adulthood had the highest degree of myocardial remodelling and dysfunction in midlife, and this association was also present among those not taking antihypertensive medication.
Elevated BP induces an increase in LV afterload and arterial stiffness, which leads to myocyte hypertrophy and interstitial fibrosis, and results in alterations of LV contractility and relaxation. 24 , 25 , 26 Herein, we found participants in the moderate‐increasing group and in the high‐increasing group had the highest degree of adverse myocardial structural and functional attributes, despite participants in the moderate‐increasing group being in the range of normotensive BP or prehypertension most of the time. This suggests a role of BP trajectory, rather than elevated BP alone, in the development and progression of CVD.
Current evidence suggests that normalization of BP with antihypertensive medication does not completely mitigate the lifetime cardiovascular burden associated with elevated BP. 27 However, it remains to be seen whether interventions at an earlier phase, targeted towards modifying BP trajectories, may reduce myocardial remodelling and dysfunction and subsequently slow the progression to clinical HF. This approach may be particularly important for those who initially exhibit normal BP levels but subsequently experience a rapid increase in BP (i.e. moderate‐increasing group in our study). Speculatively, intervening early in this trajectory may reduce associated late‐life CVD risk.
Different trajectory profiles across the life course may reflect aetiologic heterogeneity, differences in prevention measures, and treatment. Further studies examining the determinants of increases in BP levels might facilitate effective prevention of hypertension and maintenance of optimal BP levels throughout a lifetime. Genome‐wide association studies have identified genetic variants related with BP and hypertension. 28 , 29 Identifying the contributions of genetics and individual health practices to these specific BP trajectories would provide critical insights into personalized clinical treatment approaches and prevention strategies.
By evaluating BP from a life‐course perspective, we assessed the impact of long‐term BP trajectory patterns on later‐life myocardial remodelling and dysfunction. Thereby, we were able to identify two high‐risk trajectories. These findings have important clinical implications. Given the widespread adoption of electronic medical records, it is clinically feasible for physicians to map BP trajectories across multiple time points and identify individuals in high‐risk trajectories. Further work is required to determine the optimal type (lifestyle or pharmacological) and timing of interventions that may alter the future risk of myocardial remodelling and dysfunction in these high‐risk individuals. Our results are notable because myocardial remodelling and subclinical LV systolic and diastolic dysfunction are important precursors of incident HF and are associated with increased risk of adverse cardiovascular outcomes and mortality. 30 , 31 , 32 , 33
Strengths of this study include a large, community‐based biracial cohort; long duration of follow‐up (30 years of BP measurement) with nine examinations enabling assessment of long‐term patterns of BP from early to middle adulthood; and a comprehensive echocardiographic assessment allowing assessment of myocardial structure, and systolic and diastolic LV function. This study has several limitations. First, not all participants had BP measurements available at all visits. However, of those who were included in the trajectory model analysis, the median and interquartile range of BP measurement was 8 (6 to 9), with 95.3% of participants completing at least 6 measurements. Therefore, the bias introduced due to missing BP measurements may be quite limited. Second, 24 h ambulatory BP monitoring was not available in our study; masked or white‐coat hypertension may have been missed. Third, potential bias related to selective attrition is a concern. Participants who were lost to follow‐up, attended fewer than three BP assessments, or had missing Year 30 echocardiographic data were excluded. However, when accounting for attrition using IPCW, the associations remained similar. In addition, those who were excluded had a higher comorbidity burden; exclusion of these generally higher‐risk participants would tend to bias our results to the null. Therefore, the true associations between BP trajectories and myocardial structure and function may have been underestimated. Furthermore, even though we adjusted our analyses for major confounders, residual confounding cannot be excluded. Finally, our cohort consisted of a biracial black and white population and these results may not be generalizable to other racial and ethnic groups.
Conclusions
BP trajectories from early to middle adulthood are independently associated with myocardial remodelling and LV systolic and diastolic dysfunction in middle age. Trajectories associated with the highest risk of adverse myocardial structural and functional changes include patients with sustained high or rapidly increasing BP levels. Public health efforts should focus on mapping BP trajectories across the life course, which may allow the identification of high‐risk trajectories and facilitate tailored treatment approaches and prevention strategies.
Conflict of interest
None declared.
Funding
The CARDIA study is conducted and supported by the National Heart, Lung, and Blood Institute in collaboration with the University of Alabama at Birmingham (HHSN268201800005I and HHSN268201800007I), Northwestern University (HHSN268201800003I), University of Minnesota (HHSN268201800006I), and Kaiser Foundation Research Institute (HHSN268201800004I).
Supporting information
Table S1. Estimation of trajectory groups for SBP, DBP, PP and MAP.
Table S2. Comparison of baseline characteristics of participants who were included and excluded from the current study.
Table S3. Participant characteristics at the CARDIA Year‐0 and Year‐30 examinations.
Table S4. Participants characteristics at Year‐30 examination by DBP trajectory group.
Table S5. Participants characteristics at Year‐30 examination by PP trajectory group.
Table S6. Association of MAP Trajectory Groups with Indices of Myocardial Structure and Function at Year‐30 examination.
Table S7. Association of BP trajectory groups with indices of myocardial structure and function among participants who never used anti‐hypertensive medication.
Table S8. Sensitivity analyses accounting for participants with missing Year‐30 data: association of BP trajectory groups with indices of myocardial structure and function.
Figure S1. Trajectories in (A) SBP (B) DBP (C) PP in the CARDIA Cohort (sensitivity analysis).
Acknowledgements
We thank the investigators, the staff, and the participants of the CARDIA study for their dedication and highly valued contributions.
Zhou, H. , Zhang, H. , Zhan, Q. , Bai, Y. , Liu, S. , Yang, X. , Li, J. , Ma, Z. , Huang, X. , Zeng, Q. , Ren, H. , and Xu, D. (2022) Blood pressure trajectories in early adulthood and myocardial structure and function in later life. ESC Heart Failure, 9: 1258–1268. 10.1002/ehf2.13803.
Contributor Information
Hao Ren, Email: renhao67@aliyun.com.
Dingli Xu, Email: dinglixu@smu.edu.cn.
References
- 1. Ponikowski P, Voors AA, Anker SD, Bueno H, Cleland JGF, Coats AJS, Falk V, Gonzalez‐Juanatey JR, Harjola VP, Jankowska EA, Jessup M, Linde C, Nihoyannopoulos P, Parissis JT, Pieske B, Riley JP, Rosano GMC, Ruilope LM, Ruschitzka F, Rutten FH, van der Meer P, ESC Scientific Document Group . 2016 ESC Guidelines for the diagnosis and treatment of acute and chronic heart failure: the Task Force for the diagnosis and treatment of acute and chronic heart failure of the European Society of Cardiology (ESC)Developed with the special contribution of the Heart Failure Association (HFA) of the ESC. Eur Heart J 2016; 37: 2129–2200. [DOI] [PubMed] [Google Scholar]
- 2. Hollenberg SM, Warner Stevenson L, Ahmad T, Amin VJ, Bozkurt B, Butler J, Davis LL, Drazner MH, Kirkpatrick JN, Peterson PN, Reed BN, Roy CL, Storrow AB. 2019 ACC expert consensus decision pathway on risk assessment, management, and clinical trajectory of patients hospitalized with heart failure: a report of the American College of Cardiology Solution Set Oversight Committee. J Am Coll Cardiol 2019; 74: 1966–2011. [DOI] [PubMed] [Google Scholar]
- 3. Benjamin EJ, Muntner P, Alonso A, Bittencourt MS, Callaway CW, Carson AP, Chamberlain AM, Chang AR, Cheng S, Das SR, Delling FN, Djousse L, Elkind MSV, Ferguson JF, Fornage M, Jordan LC, Khan SS, Kissela BM, Knutson KL, Kwan TW, Lackland DT, Lewis TT, Lichtman JH, Longenecker CT, Loop MS, Lutsey PL, Martin SS, Matsushita K, Moran AE, Mussolino ME, O'Flaherty M, Pandey A, Perak AM, Rosamond WD, Roth GA, Sampson UKA, Satou GM, Schroeder EB, Shah SH, Spartano NL, Stokes A, Tirschwell DL, Tsao CW, Turakhia MP, VanWagner L, Wilkins JT, Wong SS, Virani SS, American Heart Association Council on Epidemiology and Prevention Statistics Committee and Stroke Statistics Subcommittee . Heart Disease and Stroke Statistics—2019 update: a report from the American Heart Association. Circulation 2019; 139: e56–e528. [DOI] [PubMed] [Google Scholar]
- 4. Levy D, Larson MG, Vasan RS, Kannel WB, Ho KK. The progression from hypertension to congestive heart failure. JAMA 1996; 275: 1557–1562. [PubMed] [Google Scholar]
- 5. Messerli FH, Rimoldi SF, Bangalore S. The transition from hypertension to heart failure: contemporary update. JACC Heart Fail 2017; 5: 543–551. [DOI] [PubMed] [Google Scholar]
- 6. Vasan RS, Levy D. The role of hypertension in the pathogenesis of heart failure. A clinical mechanistic overview. Arch Intern Med 1996; 156: 1789–1796. [PubMed] [Google Scholar]
- 7. Ghosh AK, Hardy RJ, Francis DP, Chaturvedi N, Pellerin D, Deanfield J, Kuh D, Mayet J, Hughes AD, Medical Research Council National Survey of Health and Development (NHSD) Scientific and Data Collection Team . Midlife blood pressure change and left ventricular mass and remodelling in older age in the 1946 British Birth Cohort Study. Eur Heart J 2014; 35: 3287–3295. [DOI] [PMC free article] [PubMed] [Google Scholar]
- 8. Lauer MS, Anderson KM, Levy D. Influence of contemporary versus 30‐year blood pressure levels on left ventricular mass and geometry: the Framingham Heart Study. J Am Coll Cardiol 1991; 18: 1287–1294. [DOI] [PubMed] [Google Scholar]
- 9. Allen NB, Siddique J, Wilkins JT, Shay C, Lewis CE, Goff DC, Jacobs DR Jr, Liu K, Lloyd‐Jones D. Blood pressure trajectories in early adulthood and subclinical atherosclerosis in middle age. JAMA 2014; 311: 490–497. [DOI] [PMC free article] [PubMed] [Google Scholar]
- 10. Zheng W, Mu J, Chu C, Hu J, Yan Y, Ma Q, Lv Y, Xu X, Wang K, Wang Y, Deng Y, Yan B, Yang R, Yang J, Ren Y, Yuan Z. Association of blood pressure trajectories in early life with subclinical renal damage in middle age. J Am Soc Nephrol 2018; 29: 2835–2846. [DOI] [PMC free article] [PubMed] [Google Scholar]
- 11. Hao G, Wang X, Treiber FA, Harshfield G, Kapuku G, Su S. Blood pressure trajectories from childhood to young adulthood associated with cardiovascular risk: results from the 23‐year longitudinal Georgia Stress and Heart study. Hypertension 2017; 69: 435–442. [DOI] [PMC free article] [PubMed] [Google Scholar]
- 12. Theodore RF, Broadbent J, Nagin D, Ambler A, Hogan S, Ramrakha S, Cutfield W, Williams MJ, Harrington H, Moffitt TE, Caspi A, Milne B, Poulton R. Childhood to early‐midlife systolic blood pressure trajectories: early‐life predictors, effect modifiers, and adult cardiovascular outcomes. Hypertension 2015; 66: 1108–1115. [DOI] [PMC free article] [PubMed] [Google Scholar]
- 13. Sharashova E, Wilsgaard T, Ball J, Morseth B, Gerdts E, Hopstock LA, Mathiesen EB, Schirmer H, Lochen ML. Long‐term blood pressure trajectories and incident atrial fibrillation in women and men: the Tromso study. Eur Heart J 2020; 41: 1554–1562. [DOI] [PMC free article] [PubMed] [Google Scholar]
- 14. Armstrong AC, Ricketts EP, Cox C, Adler P, Arynchyn A, Liu K, Stengel E, Sidney S, Lewis CE, Schreiner PJ, Shikany JM, Keck K, Merlo J, Gidding SS, Lima JAC. Quality control and reproducibility in M‐mode, two‐dimensional, and speckle tracking echocardiography acquisition and analysis: the CARDIA study, year 25 examination experience. Echocardiography 2015; 32: 1233–1240. [DOI] [PMC free article] [PubMed] [Google Scholar]
- 15. Lang RM, Badano LP, Mor‐Avi V, Afilalo J, Armstrong A, Ernande L, Flachskampf FA, Foster E, Goldstein SA, Kuznetsova T, Lancellotti P, Muraru D, Picard MH, Rietzschel ER, Rudski L, Spencer KT, Tsang W, Voigt JU. Recommendations for cardiac chamber quantification by echocardiography in adults: an update from the American Society of Echocardiography and the European Association of Cardiovascular Imaging. J Am Soc Echocardiogr 2015;28: 1–39.e14. [DOI] [PubMed] [Google Scholar]
- 16. Devereux RB, Alonso DR, Lutas EM, Gottlieb GJ, Campo E, Sachs I, Reichek N. Echocardiographic assessment of left ventricular hypertrophy: comparison to necropsy findings. Am J Cardiol 1986; 57: 450–458. [DOI] [PubMed] [Google Scholar]
- 17. Nagin DS, Odgers CL. Group‐based trajectory modeling in clinical research. Annu Rev Clin Psychol 2010; 6: 109–138. [DOI] [PubMed] [Google Scholar]
- 18. Nagin DS. Group‐based Modeling of Development. Cambridge, Mass: Harvard University Press; 2005. [Google Scholar]
- 19. Weuve J, Tchetgen Tchetgen EJ, Glymour MM, Beck TL, Aggarwal NT, Wilson RS, Evans DA, Mendes de Leon CF. Accounting for bias due to selective attrition: the example of smoking and cognitive decline. Epidemiology 2012; 23: 119–128. [DOI] [PMC free article] [PubMed] [Google Scholar]
- 20. Joo YS, Lee C, Kim HW, Jhee J, Yun HR, Park JT, Chang TI, Yoo TH, Kang SW, Han SH. Association of longitudinal trajectories of systolic BP with risk of incident CKD: results from the Korean Genome and Epidemiology Study. J Am Soc Nephrol 2020; 31: 2133–2144. [DOI] [PMC free article] [PubMed] [Google Scholar]
- 21. Rahman F, Yin X, Larson MG, Ellinor PT, Lubitz SA, Vasan RS, McManus DD, Magnani JW, Benjamin EJ. Trajectories of risk factors and risk of new‐onset atrial fibrillation in the Framingham Heart Study. Hypertension 2016; 68: 597–605. [DOI] [PMC free article] [PubMed] [Google Scholar]
- 22. Li W, Jin C, Vaidya A, Wu Y, Rexrode K, Zheng X, Gurol ME, Ma C, Wu S, Gao X. Blood pressure trajectories and the risk of intracerebral hemorrhage and cerebral infarction: a prospective study. Hypertension 2017; 70: 508–514. [DOI] [PMC free article] [PubMed] [Google Scholar]
- 23. Kim BJ, Cho YJ, Hong KS, Lee J, Kim JT, Choi KH, Park TH, Park SS, Park JM, Kang K, Lee SJ, Kim JG, Cha JK, Kim DH, Nah HW, Lee BC, Yu KH, Oh MS, Kim DE, Ryu WS, Choi JC, Kim WJ, Shin DI, Yeo MJ, Sohn SI, Hong JH, Lee JS, Lee J, Han MK, Gorelick PB, Bae HJ. Trajectory groups of 24‐hour systolic blood pressure after acute ischemic stroke and recurrent vascular events. Stroke 2018; 49: 1836–1842. [DOI] [PubMed] [Google Scholar]
- 24. Grossman W, Jones D, McLaurin LP. Wall stress and patterns of hypertrophy in the human left ventricle. J Clin Invest 1975; 56: 56–64. [DOI] [PMC free article] [PubMed] [Google Scholar]
- 25. Frohlich ED, Gonzalez A, Diez J. Hypertensive left ventricular hypertrophy risk: beyond adaptive cardiomyocytic hypertrophy. J Hypertens 2011; 29: 17–26. [DOI] [PubMed] [Google Scholar]
- 26. Zanchetti A, Cuspidi C, Comarella L, Rosei EA, Ambrosioni E, Chiariello M, Leonetti G, Mancia G, Pessina AC, Salvetti A, Trimarco B, Volpe M, Grassivaro N, Vargiu G. Left ventricular diastolic dysfunction in elderly hypertensives: results of the APROS‐diadys study. J Hypertens 2007; 25: 2158–2167. [DOI] [PubMed] [Google Scholar]
- 27. Liu K, Colangelo LA, Daviglus ML, Goff DC, Pletcher M, Schreiner PJ, Sibley CT, Burke GL, Post WS, Michos ED, Lloyd‐Jones DM. Can antihypertensive treatment restore the risk of cardiovascular disease to ideal levels?: the Coronary Artery Risk Development in Young Adults (CARDIA) study and the Multi‐Ethnic Study of Atherosclerosis (MESA). J Am Heart Assoc 2015; 4: e002275. [DOI] [PMC free article] [PubMed] [Google Scholar]
- 28. Hoffmann TJ, Ehret GB, Nandakumar P, Ranatunga D, Schaefer C, Kwok PY, Iribarren C, Chakravarti A, Risch N. Genome‐wide association analyses using electronic health records identify new loci influencing blood pressure variation. Nat Genet 2017; 49: 54–64. [DOI] [PMC free article] [PubMed] [Google Scholar]
- 29. Evangelou E, Warren HR, Mosen‐Ansorena D, Mifsud B, Pazoki R, Gao H, Ntritsos G, Dimou N, Cabrera CP, Karaman I, Ng FL, Evangelou M, Witkowska K, Tzanis E, Hellwege JN, Giri A, Velez Edwards DR, Sun YV, Cho K, Gaziano JM, Wilson PWF, Tsao PS, Kovesdy CP, Esko T, Mägi R, Milani L, Almgren P, Boutin T, Debette S, Ding J, Giulianini F, Holliday EG, Jackson AU, Li‐Gao R, Lin WY, Luan J, Mangino M, Oldmeadow C, Prins BP, Qian Y, Sargurupremraj M, Shah N, Surendran P, Thériault S, Verweij N, Willems SM, Zhao JH, Amouyel P, Connell J, de Mutsert R, Doney ASF, Farrall M, Menni C, Morris AD, Noordam R, Paré G, Poulter NR, Shields DC, Stanton A, Thom S, Abecasis G, Amin N, Arking DE, Ayers KL, Barbieri CM, Batini C, Bis JC, Blake T, Bochud M, Boehnke M, Boerwinkle E, Boomsma DI, Bottinger EP, Braund PS, Brumat M, Campbell A, Campbell H, Chakravarti A, Chambers JC, Chauhan G, Ciullo M, Cocca M, Collins F, Cordell HJ, Davies G, de Borst MH, de Geus EJ, Deary IJ, Deelen J, Del Greco MF, Demirkale CY, Dörr M, Ehret GB, Elosua R, Enroth S, Erzurumluoglu AM, Ferreira T, Frånberg M, Franco OH, Gandin I, Gasparini P, Giedraitis V, Gieger C, Girotto G, Goel A, Gow AJ, Gudnason V, Guo X, Gyllensten U, Hamsten A, Harris TB, Harris SE, Hartman CA, Havulinna AS, Hicks AA, Hofer E, Hofman A, Hottenga JJ, Huffman JE, Hwang SJ, Ingelsson E, James A, Jansen R, Jarvelin MR, Joehanes R, Johansson Å, Johnson AD, Joshi PK, Jousilahti P, Jukema JW, Jula A, Kähönen M, Kathiresan S, Keavney BD, Khaw KT, Knekt P, Knight J, Kolcic I, Kooner JS, Koskinen S, Kristiansson K, Kutalik Z, Laan M, Larson M, Launer LJ, Lehne B, Lehtimäki T, Liewald DCM, Lin L, Lind L, Lindgren CM, Liu Y, Loos RJF, Lopez LM, Lu Y, Lyytikäinen LP, Mahajan A, Mamasoula C, Marrugat J, Marten J, Milaneschi Y, Morgan A, Morris AP, Morrison AC, Munson PJ, Nalls MA, Nandakumar P, Nelson CP, Niiranen T, Nolte IM, Nutile T, Oldehinkel AJ, Oostra BA, O'Reilly PF, Org E, Padmanabhan S, Palmas W, Palotie A, Pattie A, Penninx BWJH, Perola M, Peters A, Polasek O, Pramstaller PP, Nguyen QT, Raitakari OT, Ren M, Rettig R, Rice K, Ridker PM, Ried JS, Riese H, Ripatti S, Robino A, Rose LM, Rotter JI, Rudan I, Ruggiero D, Saba Y, Sala CF, Salomaa V, Samani NJ, Sarin AP, Schmidt R, Schmidt H, Shrine N, Siscovick D, Smith AV, Snieder H, Sõber S, Sorice R, Starr JM, Stott DJ, Strachan DP, Strawbridge RJ, Sundström J, Swertz MA, Taylor KD, Teumer A, Tobin MD, Tomaszewski M, Toniolo D, Traglia M, Trompet S, Tuomilehto J, Tzourio C, Uitterlinden AG, Vaez A, van der Most PJ, van Duijn CM, Vergnaud AC, Verwoert GC, Vitart V, Völker U, Vollenweider P, Vuckovic D, Watkins H, Wild SH, Willemsen G, Wilson JF, Wright AF, Yao J, Zemunik T, Zhang W, Attia JR, Butterworth AS, Chasman DI, Conen D, Cucca F, Danesh J, Hayward C, Howson JMM, Laakso M, Lakatta EG, Langenberg C, Melander O, Mook‐Kanamori DO, Palmer CNA, Risch L, Scott RA, Scott RJ, Sever P, Spector TD, van der Harst P, Wareham NJ, Zeggini E, Levy D, Munroe PB, Newton‐Cheh C, Brown MJ, Metspalu A, Hung AM, O'Donnell CJ, Edwards TL, Psaty BM, Tzoulaki I, Barnes MR, Wain LV, Elliott P, Caulfield MJ, Million Veteran Program . Genetic analysis of over 1 million people identifies 535 new loci associated with blood pressure traits. Nat Genet 2018; 50: 1412–1425. [DOI] [PMC free article] [PubMed] [Google Scholar]
- 30. Levy D, Garrison RJ, Savage DD, Kannel WB, Castelli WP. Prognostic implications of echocardiographically determined left ventricular mass in the Framingham Heart Study. N Engl J Med 1990; 322: 1561–1566. [DOI] [PubMed] [Google Scholar]
- 31. Velagaleti RS, Gona P, Pencina MJ, Aragam J, Wang TJ, Levy D, D'Agostino RB, Lee DS, Kannel WB, Benjamin EJ, Vasan RS. Left ventricular hypertrophy patterns and incidence of heart failure with preserved versus reduced ejection fraction. Am J Cardiol 2014; 113: 117–122. [DOI] [PMC free article] [PubMed] [Google Scholar]
- 32. Bluemke DA, Kronmal RA, Lima JA, Liu K, Olson J, Burke GL, Folsom AR. The relationship of left ventricular mass and geometry to incident cardiovascular events: the MESA (Multi‐Ethnic Study of Atherosclerosis) study. J Am Coll Cardiol 2008; 52: 2148–2155. [DOI] [PMC free article] [PubMed] [Google Scholar]
- 33. Yeboah J, Rodriguez CJ, Stacey B, Lima JA, Liu S, Carr JJ, Hundley WG, Herrington DM. Prognosis of individuals with asymptomatic left ventricular systolic dysfunction in the multi‐ethnic study of atherosclerosis (MESA). Circulation 2012; 126: 2713–2719. [DOI] [PMC free article] [PubMed] [Google Scholar]
Associated Data
This section collects any data citations, data availability statements, or supplementary materials included in this article.
Supplementary Materials
Table S1. Estimation of trajectory groups for SBP, DBP, PP and MAP.
Table S2. Comparison of baseline characteristics of participants who were included and excluded from the current study.
Table S3. Participant characteristics at the CARDIA Year‐0 and Year‐30 examinations.
Table S4. Participants characteristics at Year‐30 examination by DBP trajectory group.
Table S5. Participants characteristics at Year‐30 examination by PP trajectory group.
Table S6. Association of MAP Trajectory Groups with Indices of Myocardial Structure and Function at Year‐30 examination.
Table S7. Association of BP trajectory groups with indices of myocardial structure and function among participants who never used anti‐hypertensive medication.
Table S8. Sensitivity analyses accounting for participants with missing Year‐30 data: association of BP trajectory groups with indices of myocardial structure and function.
Figure S1. Trajectories in (A) SBP (B) DBP (C) PP in the CARDIA Cohort (sensitivity analysis).
Data Availability Statement
Anonymized data were obtained from the CARDIA Coordinating Center (cardia.dopm.uab.edu/contact‐cardia). The National Heart, Lung, and Blood Institute policies governing the data and describing its access are described online (https://www.cardia.dopm.uab.edu/study‐information/nhlbi‐data‐repository‐data). This article has been reviewed by CARDIA for scientific content.