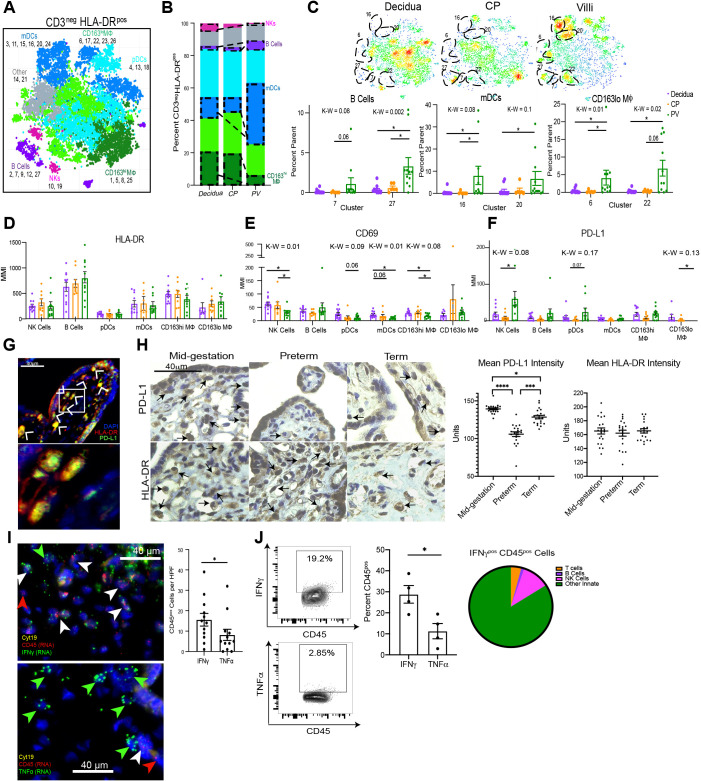
Fig. 4.
Antigen-presenting cells in the PV. (A) Cumulative CyTOF t-SNE for CD45pos CD3neg HLA-DRpos cells. (B) Stacked bar graph showing the abundance of major immune subtypes. (C) Top: Density plots separated by the tissue of origin from the data shown in A. Statistically significantly abundant clusters in the PV are outlined. Bottom: Cumulative data of PV abundant clusters (outlined in density plots). (D-F) MMI of HLA-DR (D), CD69 (E) and PD-L1 (F) for 2D-gated populations. *P<0.05 upon post-hoc analysis after Kruskal–Wallis (K-W) test. (G) PD-L1pos APC populations in PV. Boxed area is shown at higher magnification below. Arrowheads indicate positive staining of the transcript marked by the same color in the image key. (H) Representative images (left) and quantification of average stain intensity per stromal nuclei (right) for PD-L1 and HLA-DR IHC. n=2. (I) Representative images (left) and quantification of automated image analysis with CellProfiler (right) for dual RNA in situ hybridization and immunofluorescence in PV (n=12). (J) Flow plots and quantification for cytokine-positive PV immune cells by flow cytometry. n=4. Pie-chart shows major immune subset abundance of IFNγpos immune cells from flow cytometry. *P<0.05, ***P<0.001 and ****P<0.0001 (Mann–Whitney test). K-W, Kruskal–Wallis test P-value. CyTOF analysis starting with n=12 for each analysis; see Table S5 for omitted cases. Graphs show mean±s.e.m.

