

Abstract
Methane super-emitters emit non-methane co-pollutants that are harmful to human health. Yet no prior studies have assessed disparities in exposure to methane super-emitters with respect to race/ethnicity, socioeconomic status, and civic engagement. To do so, we obtained location, category (e.g., landfill, refinery), and emissions rate of California methane super-emitters from Next Generation Airborne Visible/Infrared Imaging Spectrometer (AVIRIS-NG) flights conducted between 2016–2018. We identified block groups within 2km of super-emitters (exposed) and 5-10km away (unexposed) using dasymetric mapping and assigned level of exposure among block groups within 2km (measured via number of super-emitter categories and total methane emissions). Analyses included 483 super-emitters. The majority were dairy/manure (n = 213) and oil/gas production sites (n = 127). Results from fully adjusted logistic mixed models indicate environmental injustice in methane super-emitter locations. For example, for every 10% increase in non-Hispanic Black residents, the odds of exposure increased by 10% (95% CI: 1.04, 1.17). We observed similar disparities for Hispanics and Native Americans, but not with indicators of socioeconomic status. Among block groups located within 2km, increasing proportions of non-White populations and lower voter turnout were associated with higher super-emitter emission intensity. Previously unrecognized racial/ethnic disparities in exposure to California methane super-emitters should be considered in policies to tackle methane emissions.
Keywords: Methane, Socioeconomic Factors, Race, Ethnic Groups, Environmental Justice, California
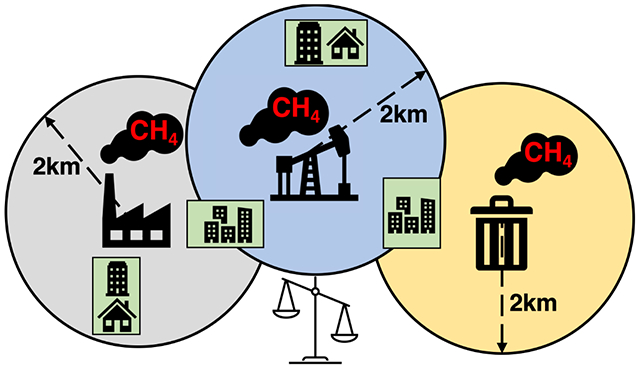
Graphical Abstract
INTRODUCTION
Since studies first documented the disproportionate siting of solid and hazardous waste facilities in Black communities in the 1980s,1,2 subsequent environmental justice scholarship has demonstrated a consistent correlation between race, poverty, and pollution burden across diverse environmental hazards and geographies. Literature reviews conclude that people of color reside in neighborhoods with worse air quality3–5 and more environmental hazards6–9 than White people in the United States. In California, environmental hazards including clean-up, hazardous waste, and solid waste sites are more regressively distributed with respect to race/ethnicity than poverty, suggesting that structural racism as opposed to class predominates in shaping inequalities.10 This pattern is consistent with the history of legal racial discrimination in civil rights, housing, employment, and education that has produced staggering gaps in present day distributions of wealth across racial groups and led to persistent racial residential segregation.11–13
In the current analysis, we investigate the social characteristics of communities near methane super-emitters to assess potential environmental justice concerns. Methane super-emitters are point sources of large methane releases that span a wide range of industries. Though methane spends less time in the atmosphere than carbon dioxide (CO2), its higher potency as a greenhouse gas make its per-ton ‘Global Warming Potential’ some 84-86 times that of CO2 over a 20-year period.14 Therefore, compared to CO2, reductions in methane emissions can more rapidly slow climate change. As a result, emissions reductions at large point sources of methane – including landfills, the oil and gas supply chain, livestock operations, and power plants – are being prioritized for near-term climate mitigation.15,16 Atmospheric methane concentrations, however, have increased rapidly since 2008, driven primarily by the agriculture, waste, and fossil fuel sectors.17 Moreover, studies suggest methane emissions in the U.S. substantially eclipse emissions inventories estimates, implying that methane releases are under-reported.18,19 In the natural gas sector, studies show that a small fraction of “super-emitters” (responsible for ~5% of leaks) contribute a disproportionate and under-reported amount of total methane emissions (~50% of emissions from leaks), often due to abnormal and avoidable operating conditions, including equipment malfunctions.20,21
While methane super-emitters are of significant interest due to their climate impacts, and specific types of super-emitters have been investigated from an environmental justice perspective (e.g., landfills, oil and gas wells, and concentrated animal feeding operations [CAFOs]), the possibility that super-emitters overall are disproportionately located in communities of color has not been examined. Although not directly toxic to humans, methane is co-emitted with other pollutants that do threaten the health of nearby communities. For example, upstream processes involved in the production and distribution of oil and natural gas emit numerous hazardous air pollutants in addition to methane, including particulate matter (PM), secondary ozone formation, and non-methane volatile organic compounds (VOCs),22–28 several of which are associated with neurological damage, birth defects, and cancer.29,30 California studies indicate that living in proximity to active oil and gas production wells is associated with increased risk of adverse birth outcomes.31,32 Air quality sampling during the largest point-source methane release ever recorded in the U.S.–the Aliso Canyon Natural Gas Storage field active blowout in 2015–revealed elevated levels of several hazardous air pollutants including benzene, a carcinogen and reproductive toxicant.33 Policies aimed at reducing methane emissions also show co-benefits for non-methane VOC and criteria air pollutant emissions. A recent analysis found that implementing strong federal and state methane policies in the oil and gas sector would result in 1400 fewer deaths and health benefits of $14 billion in 2028.34
Landfills can contaminate local drinking water supplies with hazardous chemicals via leachate, and also release “biogas,” an odorous chemical mixture of methane, CO2, and other VOCs. Residence near landfills has been associated with elevated rates of cancer, low birth weight, and birth defects.35,36
Research has also documented releases of ammonia, hydrogen sulfide, endotoxins, pathogens, and other airborne contaminants, along with methane from CAFOs. Residence near these operations is associated with asthma, decreased lung function, stress, and infection with antibiotic resistant bacteria37. Several studies report correlations between dairy farm ammonia and greenhouse gas emissions.38–40 These releases can further contribute to PM formation and exceedance of National Ambient Air Quality Standards for PM2.5 in intense CAFO areas like California’s San Joaquin Valley.40–42
Refineries emit hazardous air pollutants, including BTEX compounds (benzene, toluene, ethylbenzene, and xylene), and criteria air pollutants;43–45 gas power plants may co-emit the same pollutants along with leaked or incompletely combusted methane.46,47 Such emissions can impact community health, including higher risks of cancer48,49 and respiratory problems.50–52
Methane also contributes to the formation of ground-level ozone, which is linked to premature mortality, impaired respiratory health, and metabolic effects.53,54 By one estimate, reducing global methane emissions by 20% would result in approximately 370,000 avoided deaths over twenty years via reductions in global background ozone concentrations.55 Finally, many methane-emitting industries are predominately located in rural communities that also face reduced access to health care, higher rates of poverty, and lower rates of employment compared to urban areas.56–58 These social stressors may worsen the health effects of pollutant exposures associated with methane super-emitters.
In this study, we leverage data from a recent effort to identify methane super-emitters in California using airborne remote-sensing59 and estimates of community demographics refined via novel dasymetric mapping techniques to characterize populations residing near methane super-emitters with respect to race, ethnicity, and socioeconomic status (SES). Our analyses operationalize area-level measures of race/ethnicity and SES to assess inequities in community burdens of methane super-emitters and inform strategies to address potential environmental injustices in regulatory enforcement and permitting of these sources of potent greenhouse gases and co-pollutants.
MATERIALS AND METHODS
In this cross-sectional environmental justice analysis of methane super-emitters in California, we used the block group as our unit of analysis. Prior research indicates this is an appropriate spatial scale to assess racial/ethnic and socioeconomic disparities in environmental exposure.60 All California block groups included in the U.S. Census Bureau’s 2016 TIGER/Line Files were eligible for inclusion.
Methane super-emitter data
We obtained data on super-emitters from the California Air Resources Board (CARB).59 In brief, CARB provided data from the California Methane Survey conducted by NASA’s Jet Propulsion Laboratory, which used Next Generation Airborne Visible/Infrared Imaging Spectrometer (AVIRIS-NG) flights conducted between 2016–2018 to provide systematic information on methane emission point sources. The AVIRIS-NG flights identified 564 distinct strong methane point sources and their average hourly emission rates (kg/hour). The investigators assigned infrastructure elements within energy, agriculture, and waste sectors. From these descriptors, we created seven super-emitters categories: landfill/compost, power plant, refinery, wastewater treatment, oil/gas distribution (i.e., compressors, storage facilities, distribution lines, processing plants, liquid natural gas stations, and gathering lines), oil/gas production (stacks, drill rigs, tanks, lagoons, pump-jacks, plugged wells, and unknown infrastructure), and dairy/manure. We excluded super-emitters located >2km from the boundary of a populated area (n = 81 (14%), Supplemental Table 1).
Sociodemographic data
For analyses, we used 2012–2016 American Community Survey data61 to compute block group characteristics: population density (individuals per km2), percent Hispanic and percent non-Hispanic Native American, Asian, Black, and White, percent rural dwellers, percent linguistically isolated households (i.e., no one in the household older than 14 speaks English “very well”), as well as six measures of SES: percent living below the federal poverty threshold, percent with less than a high school education, percent unemployed, percent renters (vs. home owners), percent Supplemental Nutrition Assistance Program recipients, median household income. Urban block groups consisted of 100% urban population, semi-rural contained >0 to 99% urban population, and rural 0%. A block group-level measure of voter turnout was created using precinct-level elections data from the Statewide Database, California’s redistricting database,62 following Maizlish (2016).63 This measure is the average percent of registered voters who voted in the 2012 and 2016 general elections.
Super-emitter exposure measures
To characterize populations living close to super-emitters in California, we constructed a high-resolution spatial layer representing populated areas at sub-block granularity using novel dasymetric mapping methods. Dasymetric mapping refers to the process of disaggregating spatial data–in this case census block boundaries–to finer spatial units of analysis using ancillary data. It has been used in prior environmental justice analyses64 and helps to accurately identify residences in rural settings where census blocks (the smallest census geographic unit) can be large (i.e., > 50 km2) and sparsely populated. Two ancillary data sources were used along with census block population estimates to construct this layer: 1) a statewide database of tax parcel boundaries (smaller than census blocks) from DMP LightBox65; and 2) a layer of building footprints for nearly 11 million buildings in California, part of a nationwide layer developed by Microsoft using satellite imagery and machine learning classification techniques.66
Creation of the final populated areas layer using these data followed a tiered process. First, for each census block, we identified all residential parcels within it based on land use descriptions provided in the statewide parcel dataset for each individual parcel (Supplemental Table 2, Supplemental Figure 1). If residential parcels were identified in a given block, its population was assumed to be located within these residential areas alone. This parcel-based apportionment accounted for 91.8% of California’s population.
Second, for those blocks containing no residential parcels, but which had a non-zero population count according to the 2010 Census, we allocated population evenly across all building footprint areas identified within them. This was common for sparsely populated blocks in wilderness areas or zones of low-density agriculture, with parcels classified as ‘open space’ or ‘agricultural’ in the statewide parcel database, but which still contain residences. Apportioning population to all building footprint areas in these blocks has the advantage of masking out all open land from being considered as populated area but has the disadvantage of misallocating some population to non-residential buildings (e.g., barns, warehouses, processing facilities). This building footprint-based apportionment accounted for 7.9% of California’s population.
Finally, a small number of census blocks contained neither residential parcels nor building footprints, but still had a non-zero population count. These blocks were predominantly in very low-density wilderness areas with parcels generally classified as forests/open space and where tree canopies occluded detection of building rooftops via satellite imagery. We assumed that these blocks’ populations were evenly distributed across the entire block area. This ‘default’ method of population apportionment was applied to 0.3% of the state’s population. The final populated areas layer was created by merging the results of these three-tiered population apportionment steps into one statewide map.
We used the distance between methane super-emitters and the dasymetrically mapped populated areas to define exposed and unexposed block groups (Figure 1A). First, we identified populated areas with boundaries within 2km of a super-emitter (exposed). Next, we identified all populated areas with boundaries located within 5-10km of a super-emitter that were also located farther than 5km from all super-emitters (i.e., truly unexposed). Finally, we identified block groups containing the exposed (within 2km of a super-emitter) and unexposed (5-10km from a super-emitter) populated areas (Figure 1B). We opted to define unexposed block groups as those located 5-10km from a super-emitter to compare communities similar to the exposed block groups in terms of geographic location, rurality, and other factors, but that differed in super-emitter exposure status. After removing 24 (0.2%) block groups that were missing sociodemographic data, our study population consisted of 951 exposed and 8,722 unexposed block groups.
Figure 1:
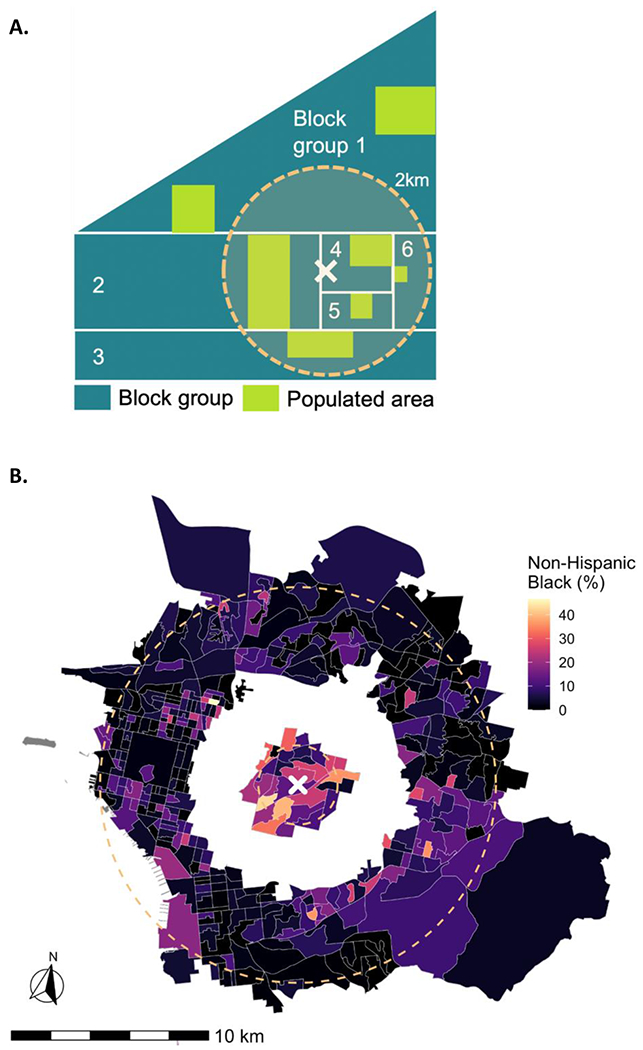
Example of exposure assignment of block groups. Panel A displays a schematic of block groups (turquoise) and populated areas (light green). Block groups 2-6 are exposed to a super-emitter (white “X”) but block group 1 is not because its populated areas are located >2km from the super-emitter. Panel B shows the location of a landfill super-emitter in San Diego County, California, exposed block groups and the percent of non-Hispanic Black residents within 2km and unexposed block groups 5-10km away. Block groups located 2-4.9km from super-emitters were not included in analysis because we considered them intermediately exposed. The western side of the map crosses over water and thus does not contain block groups. The inner dashed orange line represents the 2km radius around the super-emitter and the outer dashed orange line the 10km radius around the super-emitter.
We used two additional metrics to characterize intensity of exposure to super-emitters among block groups located within 2km. We generated a binary multi-category super-emitter variable that took the value 1 if a block group population area was located within 2km of 2 or more super-emitter categories (e.g., dairy and oil/gas production) and 0 if a block group population area was located within 2km of a single category of super-emitter (e.g., oil/gas distribution only, see Supplemental Figure 2). We further characterized exposed block groups by the sum of methane emitted from all sources within 2km: [ISP-CHK MATH], where i is a super-emitter located within 2km of block group j’s populated area’s boundary and E is the emission rate at super-emitter i in kg/hour.
Statistical analysis
We conducted descriptive analyses by exposure category. Then we used generalized additive mixed models with a logit-link to assess the association between block group-level sociodemographic variables and odds of exposure to a super-emitter or, among exposed block groups (those within 2km of a super-emitter), odds of higher intensity exposure to multiple categories of super-emitters. Mixed models included a random intercept for county. We allowed for deviations from linearity using penalized splines but included a linear term if the generalized cross-validation criterion indicated a linear association was a better fit. We used likelihood ratio testing to select the degrees of freedom for splines. All analyses were conducted using R Statistical Software (Vienna, Austria).
We first ran univariate models, adjusting for population density, for the 14 sociodemographic variables of interest and the three outcomes: 2km vs. 5-10km from a super-emitter, multiple versus 1 category of super-emitter exposure, and high versus low CH4 emissions. We then selected a pared group of variables to include in our fully adjusted models. These variables were selected based on a priori hypotheses (e.g., poverty would be associated with super-emitter exposure), Spearman correlations between the variables, (e.g., did not include variables correlated at >0.75 [Supplemental Figure 3]), and associations observed in the univariate models. The adjusted models included: population density, percent individuals of non-Hispanic Asian, Black, and Native American race/ethnicity, and percent individuals of Hispanic race/ethnicity, percent individuals living below the federal poverty threshold, percent voter turnout, percent renters, percent limited English speaking households, and percent uninsured individuals. We used semivariograms to assess residual spatial autocorrelation in our model results67 and did not observe any (Supplemental Figure 4).
In secondary analyses, we separately assessed the odds of being located within 2km vs. 5-10km from two specific types of super-emitters: (1) oil and gas production; and (2) dairy/manure sites. These two sub-categories of super-emitter have been associated with environmental justice concerns and adverse health outcomes in prior studies.68–73
RESULTS
AVIRIS-NG flights conducted between 2016–2018 identified 564 methane super-emitters in California, 483 (86%) of which we included in analyses as they were located within 2km of a populated area of a block group. Figure 2 shows the spatial distribution of California super-emitters and their relative emission rates. Dairy/manure facilities (N = 213) and oil/gas production sites (N = 127) made up the majority (70%) of the super-emitters. Landfill/compost facilities had the highest emission rates (median [25th, 75th percentile] = 468 kg/hr [254, 1195]) and refineries the lowest (median [25th, 75th percentile] = 20 kg/hr [8, 49], Supplemental Figure 5). One hundred percent of dairies, 84% of oil and gas production and distribution facilities, and 83% of landfills were in rural or semi-rural block groups while 71% of power plants, 92% of refineries, and 71% of wastewater treatment plants were located in urban block groups.
Figure 2:
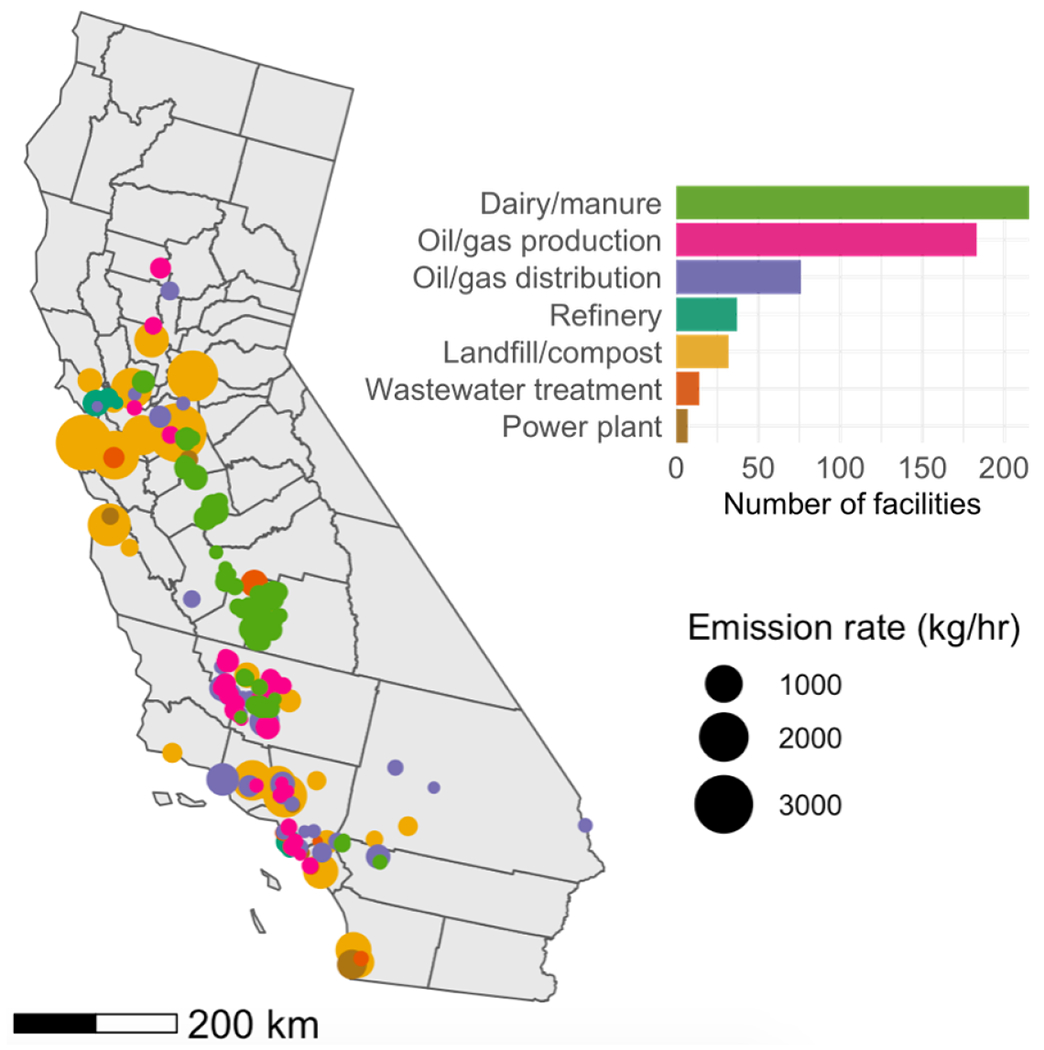
Location, type, and emission rate of methane super-emitters (N = 483) in California.
We identified 951 block groups with populated areas located within 2km of a super-emitter. Of these, 131 (13.8%) were located within 2km of more than one category of super-emitter (e.g., a dairy and an oil and gas well). The total hourly methane emissions at super-emitters located within 2km of block groups ranged from 2.8 to 3009 kg/hr (median [25th, 75th percentile] = 93 [40, 185]). The 8,722 block groups located 5-10km from super-emitters constituted our unexposed group.
In general, exposed and unexposed block groups had similar sociodemographic characteristics (Supplemental Table 3). Super-emitter exposed block groups had lower median population density than unexposed block groups (3100 individuals/km2 versus 4280 individuals/km2). We observed minimal differences in exposed versus unexposed block groups by super-emitter category (Supplemental Figure 6). Larger differences were apparent when comparing number of categories of super-emitter exposure among exposed block groups, though errors bars were still large (Supplemental Figure 7). Exposed block groups exposed with 2-4 versus 1 category of super-emitter, on average, had a higher percentage of Hispanic (50% versus 38%) and a lower percentage of non-Hispanic White individuals (26% versus 39%), a higher percentage of individuals with less than a high school education (26% versus 19%), and lower voter turnout (63% versus 69%). Similar patterns emerged across categories of total CH4 emissions exposure within 2km (Supplemental Figure 8). For example, block groups exposed to high (> tertile 3, 185 kg/hr) versus low (< tertile 1, 40 kg/hr) contained a higher percentage of Hispanic individuals (46% versus 36%), individuals living in poverty (17% versus 13%), linguistically isolated individuals (12% versus 8%), and individuals with less than a high school education (23% versus 16%). We observed strong correlations between several of the sociodemographic variables: for example, the Spearman ρ between educational attainment and Hispanic race/ethnicity was 0.8, poverty and SNAP use was 0.7, and median household income and poverty was −0.7 (Supplemental Figure 3).
In unadjusted analyses, we observed multiple non-linear relationships between sociodemographic variables and odds of being located within 2km versus 5-10km from a super-emitter (Supplemental Figure 9). For example, as percent non-Hispanic Asian individuals increased, odds of exposure increased until about 25% non-Hispanic Asians and then there was a steep decline in odds of exposure. The relationship between percent renters and exposure was an inverted U-shape, with the highest odds of being exposed at about 50% renters. Odds of exposure to super-emitters increased linearly with increasing percentage non-Hispanic Black individuals and Native American individuals. We noted somewhat reduced odds of exposure to a super-emitter with measures of lower SES, except for percent with < high school education. The lowest versus highest population density block groups had three times the odds of being exposed.
In unadjusted analyses considering odds of higher intensity exposure to super-emitters among block groups located within 2km of a super-emitter, increased odds of exposure to multiple categories of super-emitter and odds of high exposure to methane emissions were associated with increasing percent Hispanic individuals, uninsured individuals and individuals without a high school diploma (Supplemental Figures 10–11). Increasing percent individuals living in poverty and linguistically isolated households were additionally associated with increased odds of exposure to two or more categories of super-emitter. While income appeared inversely associated with odds of exposure to two or more categories of super-emitter, it was positively associated with odds of exposure to high methane emissions. Finally, an increasing percent of Hispanic and non-Hispanic Asian individuals were linearly associated with increased odds of high methane emissions.
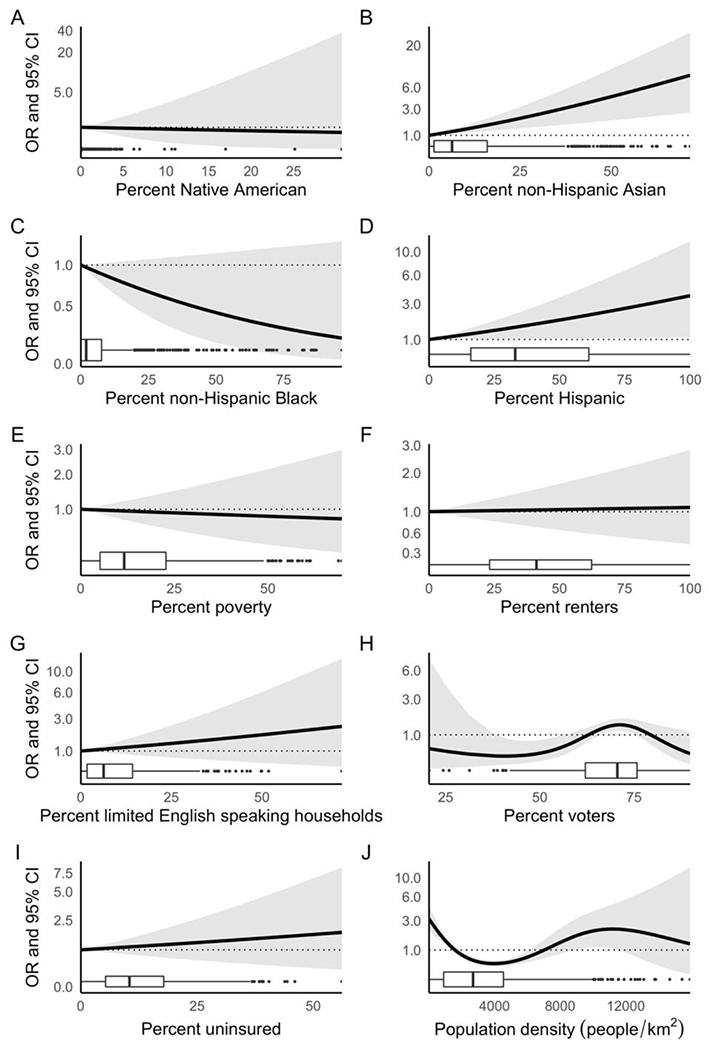
When we included 10 sociodemographic variables in a single model, race/ethnicity remained associated with increased odds of being within 2km of a super-emitter, but SES did not (Figures 3–5). For example, a 10% increase in percent non-Hispanic Black individuals and a 1% increase in non-Hispanic Native American individuals were each associated with a 10% increase in odds (95% CI: 1.04, 1.17 and 1.04, 1.15, respectively) of a block group being located within 2km of a super-emitter. The associations for non-Hispanic Asian and Hispanic individuals were non-linear. For Hispanics, the relationship was relatively flat until about 50% of the population consisted of Hispanics and then the odds of exposure to a super-emitter increased (Figure 3). Once a block group contained 25% non-Hispanic Asians, odds of exposure to a super-emitter began to decline. Percentage voter turnout demonstrated a unique association with the odds of exposure to a super-emitter peaking when around 75% of the block group voted and then rapidly declining as that proportion of voters increased.
Figure 3:
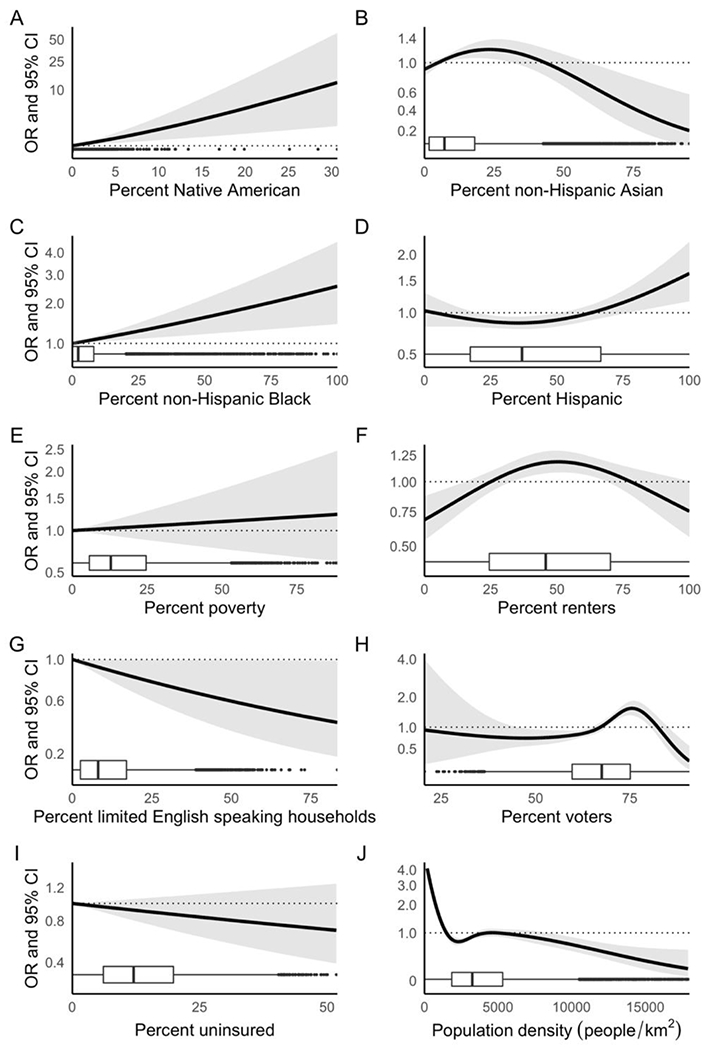
Association between sociodemographic variables and odds of being located within 2km versus 5-10km from a CH4 super-emitter. Includes n = 951 exposed and n = 8722 unexposed block groups. Black lines are odds ratios and grey areas represent the 95% confidence intervals. Results from a generalized additive mixed model with a logit link and a random intercept for county adjusted for block group-level percent individuals of non-Hispanic Native American, Asian, and Black race/ethnicity, and percent individuals of Hispanic race/ethnicity, percent individuals living below the federal poverty threshold, percent renters, percent limited English speaking households, percent voter turnout, percent uninsured individuals, and population density. Rug plot displayed along the x-axis shows the number of observations at each level of the respective sociodemographic variable. Non-linear associations in panels B, D, F, H, and J were all statistically significant at the α=0.05 level.
CI, confidence interval; OR, odds ratio.
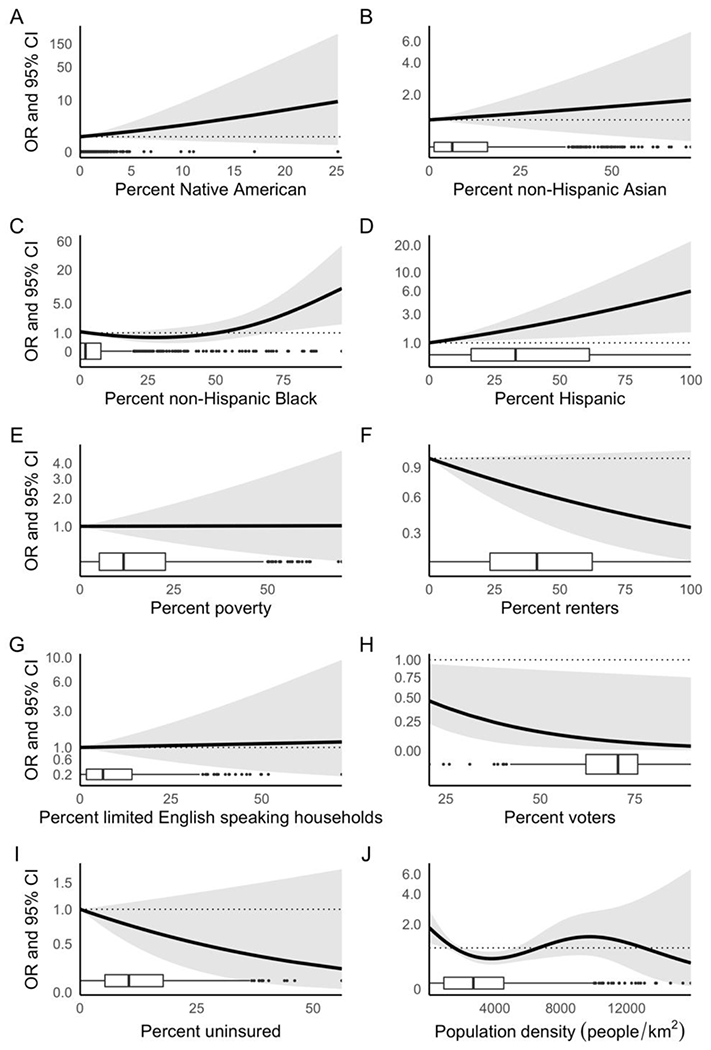
Figure 5:
Association between sociodemographic variables and odds of being exposed to high (>tertile 3 [185 kg/hr]) versus low (tertiles 1-3 [2.8-185 kg/hr]) CH4 emissions, among block groups located within 2km of at least 1 super-emitter (n = 951). Black lines are odds ratios and grey areas represent the 95% confidence interval. Results from a generalized additive mixed model with a logit link and a random intercept for county adjusted for block group-level for percent individuals of non-Hispanic Native American, Asian, and Black race/ethnicity, and percent individuals of Hispanic race/ethnicity, percent individuals living below the federal poverty threshold, percent renters, percent limited English speaking households, percent voter turnout, percent uninsured individuals, and population density. Rug plot displayed along the x-axis shows the number of observations at each level of the respective sociodemographic variable.
CI, confidence interval; OR, odds ratio. Non-linear associations in panels H and J were statistically significant at the α=0.05 level.
Similar to unadjusted analyses, increasing percent non-Hispanic Black (at 70% Black individuals, OR = 2.33, 95% CI: 0.98, 5.55) and Hispanic individuals (OR = 1.19, 95% CI: 1.04, 1.36 for each 10% increase in Hispanic individuals) were associated with increased odds of being exposed to two or more categories of super-emitter among block groups located within 2km of a super-emitter in adjusted analyses (Figure 4). Increasing percent renters (OR = 0.90, 95% CI: 0.80, 1.01 for each 10% increase) and voter turnout (OR = 0.67, 95% CI: 0.48, 0.95 for each 10% increase) were inversely associated with odds of exposure to two or more categories of super-emitter. Non-Hispanic Black race/ethnicity was inversely associated with odds of high methane emissions (OR = 0.85, 95% CI: 0.69, 1.03 for each 10% increase in non-Hispanic Black individuals), while increasing percent non-Hispanic Asian (OR = 1.35, 95% CI: 1.14, 1.59) and Hispanic (OR = 1.14, 95% CI: 1.01, 1.29) individuals were associated with increased odds of high methane emissions among block groups within 2km of a super-emitter (Figure 5).
Figure 4:
Association between sociodemographic variables and odds of being located within 2km of 2-4 versus 1 class of CH4 super-emitter, among block groups located within 2km of at least 1 super-emitter (n = 951). Black lines are odds ratios and grey areas represent the 95% confidence interval. Results from a generalized additive mixed model with a logit link and a random intercept for county adjusted for block group-level for percent individuals of non-Hispanic Native American, Asian, and Black race/ethnicity, and percent individuals of Hispanic race/ethnicity, percent individuals living below the federal poverty threshold, percent renters, percent limited English speaking households, percent voter turnout, percent uninsured individuals, and population density. Rug plot displayed along the x-axis shows the number of observations at each level of the respective sociodemographic variable.
CI, confidence interval; OR, odds ratio. Non-linear associations in panels C and J were statistically significant at the α=0.05 level.
When we assessed the odds of being located within 2km of an oil and gas production or a dairy/manure super-emitter, we observed similar racial/ethnic disparities to those observed for super-emitters overall, with some differences (Supplemental Figures 12–13). For oil and gas production sites, we observed increased odds of exposure with increasing percent Native American, non-Hispanic Black, and non-Hispanic Asian populations. For example, for each 10% increase in non-Hispanic Asian individuals there was a 26% increase in the odds of being located within 2km vs. 5-10km of an oil and gas production super-emitter (OR = 1.26, 95% CI: 1.06, 1.50). For dairy/manure sites, odds of exposure increased with higher percentages of Native American, Hispanic, and non-Hispanic Black individuals, for whom we observed the strongest relationship (OR = 1.81, 95% CI: 1.07, 3.06) for each 10% increase in non-Hispanic Black individuals.
DISCUSSION
We examined the location of 483 methane super-emitters in relation to community-level demographics based on race/ethnicity, SES, and civic engagement capacity. To our knowledge, this is the first environmental justice analysis to assess relationships between community characteristics and proximity to and intensity of exposure to multiple methane super-emitter types, including landfills/composting facilities, power plants, refineries, wastewater treatment plants, oil and gas distribution and production sites, and dairies/manure management sites. Landfills and composting facilities accounted for the highest rates of methane emissions, while dairies and manure management sites as well as oil and gas production facilities made up the largest proportion of super-emitters facilities in our analysis.59 Unadjusted models showed racial/ethnic and SES disparities in the odds of living in close proximity to methane super-emitters and intensity of exposure based on multiple industry categories and total methane emissions. In adjusted models, the associations with race/ethnicity persisted, while those for community-level SES (poverty rate, percent uninsured, and percent limited English-speaking households), were attenuated. Further, sub-analyses restricted to dairies/manure management facilities and oil and gas production revealed similar racial disparities as the main analysis. Our sub- and overall analyses also showed many non-linear relationships. Interestingly, once voter turnout, an indicator of community civic engagement, reached 75% the odds of being exposed to a super-emitter declined. This finding supports the idea that marginalized communities may be vulnerable to siting of environmental hazards due to lack of political power and limited resources to engage in regulatory decision-making or challenge facility permits.13,74 In addition, 84% of the methane super-emitters included in our study were located in semi-rural or rural block groups, highlighting what some researchers argue is an understudied form of rural environmental injustice in which urban areas drive the intensity of food and energy production in rural areas, and often return their wastes to these same rural communities.56 Our results indicate that future methane emission reduction policies to slow climate change, can also address exposure disparities to health-harming co-pollutants. This could be done by prioritizing and incentivizing deeper methane emissions reductions in environmental justice communities.
Prior studies have examined equity patterns of specific sources of methane emissions included in our analysis. For example, U.S. studies of solid and hazardous waste landfills indicate their disproportionate siting in communities of color.75,76 This body of work includes environmental justice assessments of CAFOs showing that weak regulations have led to the disproportionate location of swine CAFOs in communities of color and poor communities74,77–79 and near schools with predominantly low-income and nonwhite students.80 None of these studies, however, have examined CAFO sites, such as dairies, in California. Our results showed that odds of exposure (within 2km) to this category of methane super-emitter tended to increase with increasing percent Native American, non-Hispanic Black, and Hispanic individuals. In contrast to studies of all CAFOs, we did not observe increased odds of exposure among lower SES communities in adjusted models.
Similarly, environmental inequities associated with California’s oil and gas industry, particularly production sites, emerged in large part due to historical redlining beginning in the late 1930s through the late 1960s, which restricted many African Americans and Latino immigrant home-buyers to the petro-industrial neighborhoods of South Los Angeles.81,82 This legacy shapes present day race- and class-based inequities in the “petro-riskscapes” of Los Angeles and rural communities in San Joaquin and Kern Counties–epicenters of California’s oil and gas production.83 Our data support this theory. We observed increased odds of being located within 2 versus 5-10km from an oil and gas production super-emitter with increasing percent Native American, non-Hispanic Asian, and non-Hispanic Black individuals. In addition, the proliferation of unconventional oil and gas extraction technologies, such as hydraulic fracturing, raises new concerns regarding methane emissions84 and community health effects.29,85 These sites tend to be located in low income rural communities, such as the Marcellus Shale in Pennsylvania or the Eagle Ford Shale in Texas, and the few environmental justice studies conducted on unconventional drilling indicate that this development is often, though not always, disproportionately located in communities with lower home values and minority communities.64,86–90 Strong federal and state methane emission regulations could also reduce non-methane VOC and criteria air pollutant emissions, and such policies have the potential to prevent 1400 deaths and 50,000 asthma exacerbations in 2028.34
This study has several strengths. First, this is the first environmental justice analysis of methane super-emitters using several exposure metrics, including proximity to multiple sites, as well as airborne, remotely sensed estimates of cumulative methane emissions from diverse sources. Second, we used a high-resolution dataset of populated areas developed via dasymetric mapping to spatially characterize the location of populations within exposed and unexposed block groups. Third, we examined several demographic variables to assess patterns of inequity, including voter turnout, an indicator of community voice and political power that may be an important driver of environmental justice outcomes. Finally, we used splines and adjusted analyses to allow us to assess nonlinear trends and better isolate which community sociodemographic variables most likely explained observed associations. We found race/ethnicity better predicted exposure than low SES, potentially indicating housing discrimination, segregation, or procedural environmental injustice as drivers.91,92 We also highlight rurality as an important, yet understudied dimension of environmental injustice in California.56
Limitations include the cross-sectional design, which precludes assessment of temporal changes in block group demographic composition or distributional patterns of cumulative methane emissions; indeed, identification of methane super-emitters took place between 2016 and 2018 and emissions trends likely vary over time. In addition, although studies indicate that harmful compounds are often co-emitted with methane,29,30,34 which itself does not directly harm human health, we did not directly measure these co-pollutant emissions, and thus cannot characterize the potential health implications of these sites, which likely vary by super-emitter category and facility, for host communities. Finally, we treated each facility as a point location even though some facilities, such as dairies, span larger areas. This may have resulted in underestimation of exposed populations.
Future research should reassess temporal fluctuations in methane emissions from super-emitter sites and the extent to which these emissions correlate with potentially harmful co-pollutants across all facility types. Given that 10% of super-emitters in California were estimated to have contributed roughly 60% of point-source methane emissions,59 more targeted air quality monitoring, in collaboration with host communities, could provide much-needed data to better understand potential community health threats posed by these sites. While some analysts have cautioned against integrating air quality into climate policy, pointing out that co-pollutants are best regulated under existing laws such as the US Clean Air Act,93 more holistic regulatory strategies could target critical methane emission reductions to those communities where health co-benefits and health equity impacts are greatest.94,95 California’s Assembly Bill 61796 provides an innovative and potentially transformational blueprint for enhanced community participation in air monitoring and development of emissions reduction plans to improve local air quality and ultimately reduce environmental health disparities in disadvantaged communities.97 This legislative strategy to localize air quality management from a regional scale to a community scale can also embed environmental justice objectives in efforts to identify and more effectively regulate methane super-emitters. Indeed, harmonizing environmental justice and climate sustainability goals to incentivize greenhouse gas reductions in disadvantaged and highly polluted neighborhoods could enhance overall health benefits, particularly if a small number of methane super-emitter facilities present the greatest opportunities to improve local and regional air quality. This would require systematic temporal and spatial tracking of methane and co-pollutant emissions to characterize the health and environmental justice implications of super-emitters more fully. Such a strategy would also advance the overarching environmental justice goals articulated in California’s landmark climate change laws.
Supplementary Material
SYNOPSIS:
In California, environmental injustice appears to exist with respect to methane super-emitters; equity-based solutions should harmonize with climate sustainability goals.
Acknowledgements:
We thank Jessie Jaeger, graduate of the Department of City and Regional Planning and the School of Public Health at UC Berkeley, for her work processing the voter turnout data and Benjamin Steiger, a research assistant at Columbia Mailman School of Public Health, for his assistance creating the manuscript art.
Funding:
This study was funded, in part, by the California Air Resources Board (# 18RD018 – RMF & ND), and the National Institutes of Environmental Health Sciences (R00 ES027023 and P30 ES009089 – JAC).
Footnotes
Conflict of interest: We declare no conflict of interest.
Supporting information: Super-emitters excluded from analyses, residential parcel classifications, distribution of sociodemographic variables by exposure status, example of generating populated areas and exposure to multiple classes of super-emitter, correlation between analysis variables, semivariograms, distribution of methane emissions and sociodemographics by super-emitter classifications, unadjusted model results, and correlation between methane emissions and co-pollutant emissions for refineries and power plants in California.
REFERENCES
- (1).Bullard RD Solid Waste Sites and the Black Houston Community. Sociological Inquiry 1983, 53 (2–3), 273–288. 10.1111/j.1475-682X.1983.tb00037.x. [DOI] [PubMed] [Google Scholar]
- (2).Chavis BF; Lee C Toxic Wastes and Race in the United States ; United Church of Christ: New York, NY, 1987; p 69. [Google Scholar]
- (3).Morello-Frosch R; Jesdale BM Separate and Unequal: Residential Segregation and Estimated Cancer Risks Associated with Ambient Air Toxics in U.S. Metropolitan Areas. Environ Health Perspect 2006, 114 (3), 386–393. 10.1289/ehp.8500. [DOI] [PMC free article] [PubMed] [Google Scholar]
- (4).Clark LP; Millet DB; Marshall JD National Patterns in Environmental Injustice and Inequality: Outdoor NO2 Air Pollution in the United States. PLoS ONE 2014, 9 (4), e94431. 10.1371/journal.pone.0094431. [DOI] [PMC free article] [PubMed] [Google Scholar]
- (5).Grineski SE; Collins TW; Morales DX Asian Americans and Disproportionate Exposure to Carcinogenic Hazardous Air Pollutants: A National Study. Social Science & Medicine 2017, 185, 71–80. 10.1016/j.socscimed.2017.05.042. [DOI] [PMC free article] [PubMed] [Google Scholar]
- (6).Mohai P; Pellow D; Roberts JT Environmental Justice. Annual Review of Environment and Resources 2009, 34 (1), 405–430. 10.1146/annurev-environ-082508-094348. [DOI] [Google Scholar]
- (7).Ringquist EJ Assessing Evidence of Environmental Inequities: A Meta-Analysis. Journal of Policy Analysis and Management 2005, 24 (2), 223–247. 10.1002/pam.20088. [DOI] [Google Scholar]
- (8).Brulle RJ; Pellow DN ENVIRONMENTAL JUSTICE: Human Health and Environmental Inequalities. Annu. Rev. Public. Health 2006, 27 (1), 103–124. 10.1146/annurev.publhealth.27.021405.102124. [DOI] [PubMed] [Google Scholar]
- (9).Bullard RD; Mohai P; Saha R; Wright B Toxic Wastes and Race at Twenty: 1987-2007; United Church of Christ Justice & Witness Ministries, 2007; p 175. [Google Scholar]
- (10).Cushing L; Faust J; August LM; Cendak R; Wieland W; Alexeeff G Racial/Ethnic Disparities in Cumulative Environmental Health Impacts in California: Evidence From a Statewide Environmental Justice Screening Tool (CalEnviroScreen 1.1). Am J Public Health 2015, 105 (11), 2341–2348. 10.2105/AJPH.2015.302643. [DOI] [PMC free article] [PubMed] [Google Scholar]
- (11).Rothstein R The Color of Law: A Forgotten History of How Our Government Segregated America, First edition.; Liveright Publishing Corporation, a division of W. W. Norton & Company: New York ; London, 2017. [Google Scholar]
- (12).Brown TH Diverging Fortunes: Racial/Ethnic Inequality in Wealth Trajectories in Middle and Late Life. Race Soc Probl 2016, 8 (1), 29–41. 10.1007/s12552-016-9160-2. [DOI] [Google Scholar]
- (13).Morello-Frosch RA Discrimination and the Political Economy of Environmental Inequality. Environment and Planning C: Government and Policy 2002, 20 (4), 477–496. 10.1068/c03r. [DOI] [Google Scholar]
- (14).Myhre G; Shindell D; Bréon F-M; Collins W; Fuglestvedt J; Huang J; Koch D; Lamarque J-F; Lee D; Mendoza B; Nakajima T; Robock A; Stephens G; Takemura T; Zhang H 2013: Anthropogenic and Natural Radiative Forcing. In Climate Change 2013: The Physical Science Basis. Contribution of Working Group I to the Fifth Assessment Report of the Intergovernmental Panel on Climate Change; Stocker T, Qin D, Plattner G-K, Tignor M, Allen S, Boschung J, Nauels A, Xia Y, Bex V, Midgley P, Eds.; Cambridge University Press: Cambridge, United Kingdom and New York, NY, USA, 2013. [Google Scholar]
- (15).Jackson SC Parallel Pursuit of Near-Term and Long-Term Climate Mitigation. Science 2009, 326 (5952), 526–527. 10.1126/science.1177042. [DOI] [PubMed] [Google Scholar]
- (16).Thurmond TK California Assembly Bill 1496: Methane Emissions; 2016.
- (17).Jackson RB; Saunois M; Bousquet P; Canadell JG; Poulter B; Stavert AR; Bergamaschi P; Niwa Y; Segers A; Tsuruta A Increasing Anthropogenic Methane Emissions Arise Equally from Agricultural and Fossil Fuel Sources. Environ. Res. Lett 2020, 15 (7), 071002. 10.1088/1748-9326/ab9ed2. [DOI] [Google Scholar]
- (18).Alvarez RA; Zavala-Araiza D; Lyon DR; Allen DT; Barkley ZR; Brandt AR; Davis KJ; Herndon SC; Jacob DJ; Karion A; Kort EA; Lamb BK; Lauvaux T; Maasakkers JD; Marchese AJ; Omara M; Pacala SW; Peischl J; Robinson AL; Shepson PB; Sweeney C; Townsend-Small A; Wofsy SC; Hamburg SP Assessment of Methane Emissions from the U.S. Oil and Gas Supply Chain. Science 2018, 361 (6398), 186–188. 10.1126/science.aar7204. [DOI] [PMC free article] [PubMed] [Google Scholar]
- (19).Howarth RW Ideas and Perspectives: Is Shale Gas a Major Driver of Recent Increase in Global Atmospheric Methane? Biogeosciences 2019, 16 (15), 3033–3046. 10.5194/bg-16-3033-2019. [DOI] [Google Scholar]
- (20).Zavala-Araiza D; Lyon D; Alvarez RA; Palacios V; Harriss R; Lan X; Talbot R; Hamburg SP Toward a Functional Definition of Methane Super-Emitters: Application to Natural Gas Production Sites. Environ. Sci. Technol 2015, 49 (13), 8167–8174. 10.1021/acs.est.5b00133. [DOI] [PubMed] [Google Scholar]
- (21).Brandt AR; Heath GA; Cooley D Methane Leaks from Natural Gas Systems Follow Extreme Distributions. Environ. Sci. Technol 2016, 50 (22), 12512–12520. 10.1021/acs.est.6b04303. [DOI] [PubMed] [Google Scholar]
- (22).Brantley HL; Thoma ED; Eisele AP Assessment of Volatile Organic Compound and Hazardous Air Pollutant Emissions from Oil and Natural Gas Well Pads Using Mobile Remote and On-Site Direct Measurements. Journal of the Air & Waste Management Association 2015, 65 (9), 1072–1082. 10.1080/10962247.2015.1056888. [DOI] [PubMed] [Google Scholar]
- (23).Eisele AP; Mukerjee S; Smith LA; Thoma ED; Whitaker DA; Oliver KD; Wu T; Colon M; Alston L; Cousett TA; Miller MC; Smith DM; Stallings C Volatile Organic Compounds at Two Oil and Natural Gas Production Well Pads in Colorado and Texas Using Passive Samplers. J Air Waste Manag Assoc 2016, 66 (4), 412–419. 10.1080/10962247.2016.1141808. [DOI] [PubMed] [Google Scholar]
- (24).Gilman JB; Lerner BM; Kuster WC; de Gouw JA Source Signature of Volatile Organic Compounds from Oil and Natural Gas Operations in Northeastern Colorado. Environ. Sci. Technol 2013, 47 (3), 1297–1305. 10.1021/es304119a. [DOI] [PubMed] [Google Scholar]
- (25).Helmig D; Thompson CR; Evans J; Boylan P; Hueber J; Park J-H Highly Elevated Atmospheric Levels of Volatile Organic Compounds in the Uintah Basin, Utah. Environ. Sci. Technol 2014, 48 (9), 4707–4715. 10.1021/es405046r. [DOI] [PubMed] [Google Scholar]
- (26).Koss A; Yuan B; Warneke C; Gilman JB; Lerner BM; Veres PR; Peischl J; Eilerman S; Wild R; Brown SS; Thompson CR; Ryerson T; Hanisco T; Wolfe GM; Clair JMS; Thayer M; Keutsch FN; Murphy S; de Gouw J Observations of VOC Emissions and Photochemical Products over US Oil- and Gas-Producing Regions Using High-Resolution H3O+ CIMS (PTR-ToF-MS). Atmospheric Measurement Techniques 2017, 10 (8), 2941–2968. 10.5194/amt-10-2941-2017. [DOI] [Google Scholar]
- (27).Roy AA; Adams PJ; Robinson AL Air Pollutant Emissions from the Development, Production, and Processing of Marcellus Shale Natural Gas. Journal of the Air & Waste Management Association 2014, 64 (1), 19–37. 10.1080/10962247.2013.826151. [DOI] [PubMed] [Google Scholar]
- (28).Ahmadov R; McKeen S; Trainer M; Banta R; Brewer A; Brown S; Edwards PM; de Gouw JA; Frost GJ; Gilman J; Helmig D; Johnson B; Karion A; Koss A; Langford A; Lerner B; Olson J; Oltmans S; Peischl J; Pétron G; Pichugina Y; Roberts JM; Ryerson T; Schnell R; Senff C; Sweeney C; Thompson C; Veres PR; Warneke C; Wild R; Williams EJ; Yuan B; Zamora R Understanding High Wintertime Ozone Pollution Events in an Oil- and Natural Gas-Producing Region of the Western US. Atmospheric Chemistry and Physics 2015, 15 (1), 411–429. 10.5194/acp-15-411-2015. [DOI] [Google Scholar]
- (29).Garcia-Gonzales DA; Shonkoff SBC; Hays J; Jerrett M Hazardous Air Pollutants Associated with Upstream Oil and Natural Gas Development: A Critical Synthesis of Current Peer-Reviewed Literature. Annual Review of Public Health 2019, 40 (1), 283–304. 10.1146/annurev-publhealth-040218-043715. [DOI] [PubMed] [Google Scholar]
- (30).Johnston JE; Lim E; Roh H Impact of Upstream Oil Extraction and Environmental Public Health: A Review of the Evidence. Science of The Total Environment 2019, 657, 187–199. 10.1016/j.scitotenv.2018.11.483. [DOI] [PMC free article] [PubMed] [Google Scholar]
- (31).Tran KV; Casey JA; Cushing LJ; Morello-Frosch RA Residential Proximity to Oil and Gas Development and Birth Outcomes in California: A Retrospective Cohort Study of 2006–2015 Births. Environmental Health Perspectives 2020, 128 (6), 067001–0670013. 10.1289/EHP5842. [DOI] [PMC free article] [PubMed] [Google Scholar]
- (32).Gonzalez DJX; Sherris AR; Yang W; Stevenson DK; Padula AM; Baiocchi M; Burke M; Cullen MR; Shaw GM Oil and Gas Production and Spontaneous Preterm Birth in the San Joaquin Valley, CA: A Case–Control Study. Environmental Epidemiology 2020, 4 (4), e099. 10.1097/EE9.0000000000000099. [DOI] [PMC free article] [PubMed] [Google Scholar]
- (33).Garcia-Gonzales DA; Popoola O; Bright VB; Paulson SE; Wang Y; Jones RL; Jerrett M Associations among Particulate Matter, Hazardous Air Pollutants and Methane Emissions from the Aliso Canyon Natural Gas Storage Facility during the 2015 Blowout. Environment International 2019, 132, 104855. 10.1016/j.envint.2019.05.049. [DOI] [PubMed] [Google Scholar]
- (34).Buonocore J; Reka S; Yang D; Chang C; Roy A; Thompson T; Lyon D; McVay R; Michanowicz D; Arunachalam S Air Quality and Health Benefits of Methane Policies in the United States Oil & Gas Sector. September 3, 2021. 10.21203/rs.3.rs-199686/v1. [DOI]
- (35).Goldberg DMS; Al-Homsi N; Goulet L; Riberdy H Incidence of Cancer among Persons Living Near a Municipal Solid Waste Landfill Site in Montreal, Québec. Archives of Environmental Health: An International Journal 1995, 50 (6), 416–424. 10.1080/00039896.1995.9935977. [DOI] [PubMed] [Google Scholar]
- (36).Vrijheid M Health Effects of Residence near Hazardous Waste Landfill Sites: A Review of Epidemiologic Literature. Environmental health perspectives 2000, 108 Suppl 1, 101–112. [DOI] [PMC free article] [PubMed] [Google Scholar]
- (37).Casey JA; Kim BF; Larsen J; Price LB; Nachman KE Industrial Food Animal Production and Community Health. Curr Envir Health Rpt 2015, 2 (3), 259–271. 10.1007/s40572-015-0061-0. [DOI] [PubMed] [Google Scholar]
- (38).Ngwabie NM; Jeppsson K-H; Nimmermark S; Swensson C; Gustafsson G Multi-Location Measurements of Greenhouse Gases and Emission Rates of Methane and Ammonia from a Naturally-Ventilated Barn for Dairy Cows. Biosystems Engineering 2009, 103 (1), 68–77. 10.1016/j.biosystemseng.2009.02.004. [DOI] [Google Scholar]
- (39).Wu W; Zhang G; Kai P Ammonia and Methane Emissions from Two Naturally Ventilated Dairy Cattle Buildings and the Influence of Climatic Factors on Ammonia Emissions. Atmospheric Environment 2012, 61, 232–243. 10.1016/j.atmosenv.2012.07.050. [DOI] [Google Scholar]
- (40).Miller DJ; Sun K; Tao L; Pan D; Zondlo MA; Nowak JB; Liu Z; Diskin G; Sachse G; Beyersdorf A; Ferrare R; Scarino AJ Ammonia and Methane Dairy Emission Plumes in the San Joaquin Valley of California from Individual Feedlot to Regional Scales. Journal of Geophysical Research: Atmospheres 2015, 120 (18), 9718–9738. 10.1002/2015JD023241. [DOI] [Google Scholar]
- (41).Eilerman SJ; Peischl J; Neuman JA; Ryerson TB; Aikin KC; Holloway MW; Zondlo MA; Golston LM; Pan D; Floerchinger C; Herndon S Characterization of Ammonia, Methane, and Nitrous Oxide Emissions from Concentrated Animal Feeding Operations in Northeastern Colorado. Environ. Sci. Technol 2016, 50 (20), 10885–10893. 10.1021/acs.est.6b02851. [DOI] [PubMed] [Google Scholar]
- (42).Neuman JA; Nowak JB; Brock CA; Trainer M; Fehsenfeld FC; Holloway JS; Hübler G; Hudson PK; Murphy DM; Nicks DK; Orsini D; Parrish DD; Ryerson TB; Sueper DT; Sullivan A; Weber R Variability in Ammonium Nitrate Formation and Nitric Acid Depletion with Altitude and Location over California. Journal of Geophysical Research: Atmospheres 2003, 108 (D17). 10.1029/2003JD003616. [DOI] [Google Scholar]
- (43).Sun P; Young B; Elgowainy A; Lu Z; Wang M; Morelli B; Hawkins T Criteria Air Pollutant and Greenhouse Gases Emissions from U.S. Refineries Allocated to Refinery Products. Environ. Sci. Technol 2019, 53 (11), 6556–6569. 10.1021/acs.est.8b05870. [DOI] [PubMed] [Google Scholar]
- (44).Sanchez NP; Saffari A; Barczyk S; Coleman BK; Naufal Z; Rabideau C; Pacsi AP Results of Three Years of Ambient Air Monitoring Near a Petroleum Refinery in Richmond, California, USA. Atmosphere 2019, 10 (7), 385. 10.3390/atmos10070385. [DOI] [Google Scholar]
- (45).Mukerjee S; Smith LA; Thoma ED; Whitaker DA; Oliver KD; Duvall R; Cousett TA Spatial Analysis of Volatile Organic Compounds Using Passive Samplers in the Rubbertown Industrial Area of Louisville, Kentucky, USA. Atmospheric Pollution Research 2020, 11 (6), 81–86. 10.1016/j.apr.2020.02.021. [DOI] [PMC free article] [PubMed] [Google Scholar]
- (46).Burger JL; Lovestead TM; Bruno TJ Composition of the C6+ Fraction of Natural Gas by Multiple Porous Layer Open Tubular Capillaries Maintained at Low Temperatures. Energy Fuels 2016, 30 (3), 2119–2126. 10.1021/acs.energyfuels.6b00043. [DOI] [PMC free article] [PubMed] [Google Scholar]
- (47).van Kesteren P; in Biesebeek J; Palmen N; Bakker J; Muller J Risk Assessment of an Increased Concentration Limit of Benzene in Natural Gas; 601352002; National Institute for Public Health and the Environment, 2013; p 36. [Google Scholar]
- (48).Yu C-L; Wang S-F; Pan P-C; Wu M-T; Ho C-K; Smith TJ; Li Y; Pothier L; Christiani DC; Kaohsiung Leukemia Research Group. Residential Exposure to Petrochemicals and the Risk of Leukemia: Using Geographic Information System Tools to Estimate Individual-Level Residential Exposure. Am. J. Epidemiol 2006, 164 (3), 200–207. 10.1093/aje/kwj182. [DOI] [PubMed] [Google Scholar]
- (49).Yang CY; Cheng BH; Hsu TY; Tsai SS; Hung CF; Wu TN Female Lung Cancer Mortality and Sex Ratios at Birth near a Petroleum Refinery Plant. Environ. Res 2000, 83 (1), 33–40. 10.1006/enrs.2000.4038. [DOI] [PubMed] [Google Scholar]
- (50).Smargiassi Audrey; Kosatsky Tom; Hicks John; Plante Céline; Armstrong Ben; Villeneuve Paul J; Goudreau Sophie. Risk of Asthmatic Episodes in Children Exposed to Sulfur Dioxide Stack Emissions from a Refinery Point Source in Montreal, Canada. Environmental Health Perspectives 2009, 117 (4), 653–659. 10.1289/ehp.0800010. [DOI] [PMC free article] [PubMed] [Google Scholar]
- (51).Rusconi F; Catelan D; Accetta G; Peluso M; Pistelli R; Barbone F; Felice ED; Munnia A; Murgia P; Paladini L; Serci A; Biggeri A Asthma Symptoms, Lung Function, and Markers of Oxidative Stress and Inflammation in Children Exposed to Oil Refinery Pollution. Journal of Asthma 2011, 48 (1), 84–90. 10.3109/02770903.2010.538106. [DOI] [PubMed] [Google Scholar]
- (52).White N; teWaterNaude J; van der Walt A; Ravenscroft G; Roberts W; Ehrlich R Meteorologically Estimated Exposure but Not Distance Predicts Asthma Symptoms in Schoolchildren in the Environs of a Petrochemical Refinery: A Cross-Sectional Study. Environ Health 2009, 8 (1), 45. 10.1186/1476-069X-8-45. [DOI] [PMC free article] [PubMed] [Google Scholar]
- (53).U.S. Environmental Protection Agency. Integrated Science Assessment (ISA) for Ozone and Related Photochemical Oxidants (Final Report); EPA/600/R-20/012; Washington, D.C., 2020; p 1468. [Google Scholar]
- (54).Jerrett M; Burnett RT; Pope CA; Ito K; Thurston G; Krewski D; Shi Y; Calle E; Thun M Long-Term Ozone Exposure and Mortality. New England Journal of Medicine 2009, 360 (11), 1085–1095. 10.1056/NEJMoa0803894. [DOI] [PMC free article] [PubMed] [Google Scholar]
- (55).West JJ; Fiore AM; Horowitz LW; Mauzerall DL Global Health Benefits of Mitigating Ozone Pollution with Methane Emission Controls. PNAS 2006, 103 (11), 3988–3993. 10.1073/pnas.0600201103. [DOI] [PMC free article] [PubMed] [Google Scholar]
- (56).Kelly-Reif K; Wing S Urban-Rural Exploitation: An Underappreciated Dimension of Environmental Injustice. Journal of Rural Studies 2016, 47, 350–358. 10.1016/j.jrurstud.2016.03.010. [DOI] [Google Scholar]
- (57).Ricketts TC The Changing Nature of Rural Health Care. Annual Review of Public Health 2000, 21 (1), 639–657. 10.1146/annurev.publhealth.21.1.639. [DOI] [PubMed] [Google Scholar]
- (58).Singh GK; Siahpush M Widening Rural–Urban Disparities in Life Expectancy, U.S., 1969–2009. American Journal of Preventive Medicine 2014, 46 (2), e19–e29. 10.1016/j.amepre.2013.10.017. [DOI] [PubMed] [Google Scholar]
- (59).Duren RM; Thorpe AK; Foster KT; Rafiq T; Hopkins FM; Yadav V; Bue BD; Thompson DR; Conley S; Colombi NK; Frankenberg C; McCubbin IB; Eastwood ML; Falk M; Herner JD; Croes BE; Green RO; Miller CE California’s Methane Super-Emitters. Nature 2019, 575 (7781), 180–184. 10.1038/s41586-019-1720-3. [DOI] [PubMed] [Google Scholar]
- (60).Krieger N; Chen J; Waterman P; Soobader M; Subramanian S; Carson R Choosing Area Based Socioeconomic Measures to Monitor Social Inequalities in Low Birth Weight and Childhood Lead Poisoning: The Public Health Disparities Geocoding Project (US). J Epidemiol Community Health 2003, 57 (3), 186–199. 10.1136/jech.57.3.186. [DOI] [PMC free article] [PubMed] [Google Scholar]
- (61).Manson S; Schroeder J; Van Riper D; Ruggles S National Historical Geographic Information System: Version 12.0, 2017. 10.18128/D050.V12.0. [DOI]
- (62).Statewide Database | Election Data https://statewidedatabase.org/election.html (accessed 2020 -07 -01).
- (63).Maizlish N Technical Documentation: California Health Disadvantage Index (HDI 1.1); Public Health Alliance of Southern California, 2016; p 38. [Google Scholar]
- (64).Clough E; Bell D Just Fracking: A Distributive Environmental Justice Analysis of Unconventional Gas Development in Pennsylvania, USA. Environ. Res. Lett 2016, 11 (2), 025001. 10.1088/1748-9326/11/2/025001. [DOI] [Google Scholar]
- (65).Nationwide Parcel Data & Property Level Geocodes | SmartParcels® https://www.digmap.com/platform/smartparcels/ (accessed 2020 -07 -01).
- (66).Microsoft/USBuildingFootprints; Microsoft, 2019. [Google Scholar]
- (67).Bivand R; Pebesma EJ; Gómez-Rubio V Applied Spatial Data Analysis with R, second edition.; Use R!; Springer: New York Heidelberg Dordrecht London, 2013. [Google Scholar]
- (68).Wing S; Cole D; Grant G Environmental Injustice in North Carolina’s Hog Industry. Environ Health Perspect 2000, 108 (3), 225–231. [DOI] [PMC free article] [PubMed] [Google Scholar]
- (69).Donham KJ; Wing S; Osterberg D; Flora JL; Hodne C; Thu KM; Thorne PS Community Health and Socioeconomic Issues Surrounding Concentrated Animal Feeding Operations. Environ Health Perspect 2007, 115 (2), 317–320. 10.1289/ehp.8836. [DOI] [PMC free article] [PubMed] [Google Scholar]
- (70).Mirabelli MC; Wing S; Marshall SW; Wilcosky TC Race, Poverty, and Potential Exposure of Middle-School Students to Air Emissions from Confined Swine Feeding Operations. Environ Health Perspect 2006, 114 (4), 591–596. 10.1289/ehp.8586. [DOI] [PMC free article] [PubMed] [Google Scholar]
- (71).Casey JA; Kim BF; Larsen J; Price LB; Nachman KE Industrial Food Animal Production and Community Health. Curr Environ Health Rep 2015, 2 (3), 259–271. 10.1007/s40572-015-0061-0. [DOI] [PubMed] [Google Scholar]
- (72).Johnston JE; Lim E; Roh H Impact of Upstream Oil Extraction and Environmental Public Health: A Review of the Evidence. Sci Total Environ 2019, 657, 187–199. 10.1016/j.scitotenv.2018.11.483. [DOI] [PMC free article] [PubMed] [Google Scholar]
- (73).Kroepsch AC; Maniloff PT; Adgate JL; McKenzie LM; Dickinson KL Environmental Justice in Unconventional Oil and Natural Gas Drilling and Production: A Critical Review and Research Agenda. Environ Sci Technol 2019, 53 (12), 6601–6615. 10.1021/acs.est.9b00209. [DOI] [PubMed] [Google Scholar]
- (74).Wing S; Cole D; Grant G Environmental Injustice in North Carolina’s Hog Industry. Environ Health Perspect 2000, 108 (3), 225–231. [DOI] [PMC free article] [PubMed] [Google Scholar]
- (75).Martuzzi M; Mitis F; Forastiere F Inequalities, Inequities, Environmental Justice in Waste Management and Health. The European Journal of Public Health 2010, 20 (1), 21–26. 10.1093/eurpub/ckp216. [DOI] [PubMed] [Google Scholar]
- (76).Saha R; Mohai P Historical Context and Hazardous Waste Facility Siting: Understanding Temporal Patterns in Michigan. Social Problems 2005, 52 (4), 618–648. 10.1525/sp.2005.52.4.618. [DOI] [Google Scholar]
- (77).Ladd AE; Edward B Corporate Swine and Capitalist Pigs: A Decade of Environmental Injustice and Protest in North Carolina. Social Justice 2002, 29 (3 (89)), 26–46. [Google Scholar]
- (78).Wilson SM; Fraser-Rahim H; Williams E; Zhang H; Rice L; Svendsen E; Abara W Assessment of the Distribution of Toxic Release Inventory Facilities in Metropolitan Charleston: An Environmental Justice Case Study. Am J Public Health 2012, 102 (10), 1974–1980. 10.2105/AJPH.2012.300700. [DOI] [PMC free article] [PubMed] [Google Scholar]
- (79).Donham KJ; Wing S; Osterberg D; Flora JL; Hodne C; Thu KM; Thorne PS Community Health and Socioeconomic Issues Surrounding Concentrated Animal Feeding Operations. Environ Health Perspect 2007, 115 (2), 317–320. 10.1289/ehp.8836. [DOI] [PMC free article] [PubMed] [Google Scholar]
- (80).Mirabelli MC; Wing S; Marshall SW; Wilcosky TC Race, Poverty, and Potential Exposure of Middle-School Students to Air Emissions from Confined Swine Feeding Operations. Environ Health Perspect 2006, 114 (4), 591–596. 10.1289/ehp.8586. [DOI] [PMC free article] [PubMed] [Google Scholar]
- (81).Cumming DG Black Gold, White Power: Mapping Oil, Real Estate, and Racial Segregation in the Los Angeles Basin, 1900-1939. Engaging Science, Technology, and Society 2018, 4, 85. 10.17351/ests2018.212. [DOI] [Google Scholar]
- (82).Viehe FW Black Gold Suburbs: The Influence of the Extractive Industry on the Suburbanization of Los Angeles, 1890-1930. Journal of Urban History 1981, 8 (1), 3–26. 10.1177/009614428100800101. [DOI] [Google Scholar]
- (83).Srebotnjak Tanja; Rotkin-Ellman M Drilling in California: Who’s at Risk?; R:14-09-A; Natural Resources Defense Council, 2014; p 28. [Google Scholar]
- (84).Howarth RW; Ingraffea A; Engelder T Should Fracking Stop? Nature 2011, 477 (7364), 271–275. 10.1038/477271a. [DOI] [PubMed] [Google Scholar]
- (85).Elliott EG; Ettinger AS; Leaderer BP; Bracken MB; Deziel NC A Systematic Evaluation of Chemicals in Hydraulic-Fracturing Fluids and Wastewater for Reproductive and Developmental Toxicity. J Expos Sci Environ Epidemiol 2017, 27, 90–99. 10.1038/jes.2015.81. [DOI] [PubMed] [Google Scholar]
- (86).Ogneva-Himmelberger Y; Huang L Spatial Distribution of Unconventional Gas Wells and Human Populations in the Marcellus Shale in the United States: Vulnerability Analysis. Applied Geography 2015, 60, 165–174. 10.1016/j.apgeog.2015.03.011. [DOI] [Google Scholar]
- (87).Johnston JE; Werder E; Sebastian D Wastewater Disposal Wells, Fracking, and Environmental Injustice in Southern Texas. American Journal of Public Health 2016, 106 (3), 550–556. 10.2105/AJPH.2015.303000. [DOI] [PMC free article] [PubMed] [Google Scholar]
- (88).Johnston JE; Chau K; Franklin M; Cushing L Environmental Justice Dimensions of Oil and Gas Flaring in South Texas: Disproportionate Exposure among Hispanic Communities. Environ. Sci. Technol 2020, 54 (10), 6289–6298. 10.1021/acs.est.0c00410. [DOI] [PMC free article] [PubMed] [Google Scholar]
- (89).Kroepsch AC; Maniloff PT; Adgate JL; McKenzie LM; Dickinson KL Environmental Justice in Unconventional Oil and Natural Gas Drilling and Production: A Critical Review and Research Agenda. Environ. Sci. Technol 2019, 53 (12), 6601–6615. 10.1021/acs.est.9b00209. [DOI] [PubMed] [Google Scholar]
- (90).Malin SA; DeMaster KT A Devil’s Bargain: Rural Environmental Injustices and Hydraulic Fracturing on Pennsylvania’s Farms. Journal of Rural Studies 2016, 47, 278–290. 10.1016/j.jrurstud.2015.12.015. [DOI] [Google Scholar]
- (91).Fernandez-Bou AS; Ortiz-Partida JP; Dobbin KB; Flores-Landeros H; Bernacchi LA; Medellín-Azuara J Underrepresented, Understudied, Underserved: Gaps and Opportunities for Advancing Justice in Disadvantaged Communities. Environmental Science & Policy 2021, 122, 92–100. 10.1016/j.envsci.2021.04.014. [DOI] [Google Scholar]
- (92).Mohai P; Bryant B Environmental Injustice: Weighing Race and Class as Factors in the Distribution of Environmental Hazards. U. Colo. L. Rev 1992, 63, 921. [Google Scholar]
- (93).Schatzki T; Stavins RN Addressing Environmental Justice Concerns in the Design of California’s Climate Policy; Analysis Group, 2009; p 33. [Google Scholar]
- (94).Boyce JK; Pastor M Clearing the Air: Incorporating Air Quality and Environmental Justice into Climate Policy. Climatic Change 2013, 120 (4), 801–814. 10.1007/s10584-013-0832-2. [DOI] [Google Scholar]
- (95).Shonkoff S; Morello-Frosch R; Pastor M; Sadd J Environmental Health and Equity Implications of Climate Change and Mitigation Policies in California: A Review of the Literature. Climatic Change 2011, 109 (S1), S485–503. [Google Scholar]
- (96).Garcia C CA Assembly Bill 617. Nonvehicular Air Pollution: Criteria Air Pollutants and Toxic Air Contaminants; 2017. [Google Scholar]
- (97).Community Air Protection Blueprint | California Air Resources Board https://ww2.arb.ca.gov/capp-blueprint (accessed 2021 -06 -28).
Associated Data
This section collects any data citations, data availability statements, or supplementary materials included in this article.