Abstract
Many critically ill patients have increased extracellular fluid which might affect ceftazidime pharmacokinetics. We investigated the pharmacokinetics of ceftazidime in 15 adult intensive care patients receiving 2 g of ceftazidime intravenously three times a day. The ceftazidime mean (standard deviation) apparent volume of distribution and terminal-phase half-life were 56.91 (25.93) liters and 4.75 (1.85) h, respectively, significantly greater than values reported previously for healthy controls (P < 0.001). The mean ceftazidime clearance and area under the curve at steady state were not significantly different from those previously reported for controls. We conclude that ceftazidime pharmacokinetics in critically ill patients were altered by an increased volume of drug distribution and elevated elimination half-life.
Ceftazidime is a β-lactam antibiotic used in the treatment of serious gram-negative infections (20, 22, 26). It interferes with the transpeptidation enzymes that facilitate peptide cross-linking in peptidoglycan, thereby inhibiting cell wall synthesis (21, 24). The effect of ceftazidime is predominantly time dependent in that it requires continuous antibiotic presence above the MIC to achieve bacterial cell killing (9, 23). Its effect is independent of high peak levels (6), and there is no clinically significant postantibiotic effect (2, 7, 8, 13). In healthy individuals, ceftazidime is eliminated predominantly by glomerular filtration, with about 90% of the dose being excreted in the urine within 24 h of administration (14, 27). In patients with impaired renal function, the terminal-phase elimination half-life (t1/2β) increases significantly (18).
Some critically ill patients receiving ceftazidime show poor clinical responses despite the in vitro sensitivity of the organism. Critically ill patients, particularly those with severe sepsis, often have reduced effective circulating volume, in part due to generalized increased capillary permeability (4, 11). Administration of fluids necessary to replete the intravascular compartment leads inevitably to some fluid extravasation, manifested clinically as peripheral edema. Therefore, by the nature of their illness, edema is a common problem in patients with sepsis.
We postulated that the edema often seen in critical illness has an effect on ceftazidime pharmacokinetics. We therefore conducted a prospective observational study to determine the pharmacokinetics of ceftazidime in intensive care patients without clinically overt deterioration of renal function but with considerable increases in extracellular fluid. We aimed to study the relationship, if any, between raised extracellular fluid and ceftazidime pharmacokinetics.
The study was approved by the Riverside Research Ethics Committee and took place in the Intensive Care Unit at Charing Cross Hospital, London, United Kingdom. All patients or the nearest relative gave written consent or assent, respectively. Fifteen adults (Table 1) with normal concentrations of creatinine in plasma received 2 g of ceftazidime (GlaxoWellcome, Stockley Park West, Middlesex, United Kingdom) in 20 ml of distilled water over 2 min intravenously (i.v.) every 8 h as part of a clinically indicated antibacterial regimen. Exclusion criteria were age less than 18 years, pregnancy, or lactation. Severity of illness was assessed by the acute physiology and chronic health evaluation (APACHE II) score (17) on the day of ceftazidime sampling. Blood was taken for drug assay immediately before and 5 min, 30 min, and 1, 2, 4, 6, and 8 h after drug administration. Patient sampling was undertaken after at least 24 h of treatment, and the data corresponded to conditions at steady state, except the data for patient 4, who was administered a single dose. Blood was collected from indwelling arterial cannulae into plain tubes and allowed to clot for 20 min. All patients had urinary catheters; urine was collected during the entire 8-h dosing interval for determination of creatinine and ceftazidime concentrations. Blood and urine samples were centrifuged at 4,000 rpm for 10 min, and the supernatants were stored at −20°C.
TABLE 1.
Patient characteristics
| Patient | Age (yr) | Sexa | Diagnosis | APACHE II score | Tissue edema score | Concn of creatinine in plasma (μmol/liter) | CLCR (ml/min) |
|---|---|---|---|---|---|---|---|
| 1 | 64 | M | Esophagectomy | 6 | 4 | 97 | 109.6 |
| 2 | 29 | F | Necrotizing fascitis | 7 | 8 | 65 | 93.6 |
| 3 | 65 | M | Femoral popliteal bypass | 13 | 16 | 68 | 28.9 |
| 4 | 64 | F | Fecal peritonitis | 18 | 17 | 54 | 36.9 |
| 5 | 71 | F | Meningioma | 22 | 3 | 72 | 51.1 |
| 6 | 72 | M | Subarachnoid hemorrhage | 24 | 16 | 100 | 47.8 |
| 7 | 38 | M | Subarachnoid hemorrhage | 12 | 3 | 112 | 97.3 |
| 8 | 57 | M | Fecal peritonitis | 10 | 13 | 81 | 59.0 |
| 9 | 53 | M | Perioperative cardiac arrest | 23 | 6 | 81 | Not available |
| 10 | 82 | F | Sigmoid volvulus | 9 | 16 | 90 | 36.9 |
| 11 | 62 | F | Aspiration pneumonia | 8 | 18 | 85 | 65.3 |
| 12 | 66 | F | Abdominal sepsis | 12 | 18 | 44 | 54.7 |
| 13 | 76 | M | Subdural hemorrhage | 15 | 15 | 108 | 67.5 |
| 14 | 64 | F | Gastrointestinal hemorrhage | 15 | 18 | 52 | 35.7 |
| 15 | 46 | F | Pancreatitis | 9 | 18 | 58 | 70.2 |
| Mean | 59.3 | 77.8 | 61.1 | ||||
| SD | 14.6 | 21.1 | 24.9 | ||||
| Median | 12 | 16 |
M, male; F, female.
Ceftazidime concentration was measured by high-pressure liquid chromatography and UV spectrophotometry at 257 nm, as previously described (1). The assay was calibrated with standards between 10 and 200 μg/ml (correlation coefficient, 0.999). Results below the low standard were considered not detectable. When necessary, urine samples were diluted 1 in 10 in drug-free urine. The interday coefficients of variation for the 10-, 25-, and 50-μg/ml standards were 6.3, 5.0, and 9.2%, respectively. The intraday coefficients of variation for the same standards were 2.0, 2.6, and 6.1%, respectively. Levels of creatinine in plasma and urine were assayed by the Jaffe method (automated analyzer, BM/Hitachi 747; Boehringer Mannheim GmbH, Mannheim, Germany). For each patient the following pharmacokinetic parameters were computed by standard noncompartmental methods (10) with Win-NONLIN computer software (Scientific Consulting Inc.). The area under the curve at steady-state (AUCSS) was calculated by the trapezoidal rule up to 8 h postdose for the steady-state data and extrapolated to infinity for patient 4. The total clearance (CL) of ceftazidime was calculated as the ratio of the dose to the AUCSS. The elimination-phase rate constant (kel) was estimated by linear regression of concentrations in the terminal linear phase of the semilogarithmic plot of the concentration in serum versus time curve. The t1/2β was calculated as the ratio of the ln2 to the kel. The apparent volume of distribution (Vβ) was calculated as the ratio of the CL to the kel.
Tissue edema was assessed clinically by us (either C.M.H.G. or J.J.C.) at six anatomical sites (sacrum, upper back, left and right hands, and pretibial areas) and quantified by using a simple score: 0 to 3 at each site, giving a maximum score of 18. Creatinine clearance (CLCR) for the 8-h dosing interval was calculated by dividing the urinary creatinine excretion rate (urine flow times urine creatinine concentration) by the plasma creatinine concentration.
Descriptive statistics were used to summarize the values obtained (Excel 7.0; Microsoft). The mean pharmacokinetic parameters obtained in this study were compared with previously reported data (means ± standard deviations [SD]) from healthy volunteers (27) by the unpaired t test. The association between pharmacokinetic parameters and the pathophysiological descriptors (tissue edema, plasma creatinine, and CLCR) was investigated by simple- and multiple-regression analyses (Statview SE & Graphics 1.02; Abacus Concepts Inc. Berkeley, Calif.). P values less than 0.05 were considered statistically significant.
All patients (Table 1) received standard supportive treatment appropriate to their condition; this included mechanical ventilation, vasoactive agents, and nutritional supplementation. The mean (SD) concentration of creatinine in plasma was 77.8 ± 21.1 μmol/liter, and all patients had a concentration of creatinine in plasma within the normal range for our laboratory (60 to 120 μmol/liter). The mean 8-h CLCR was 61.0 ± 24.9 ml/min/1.73 m2.
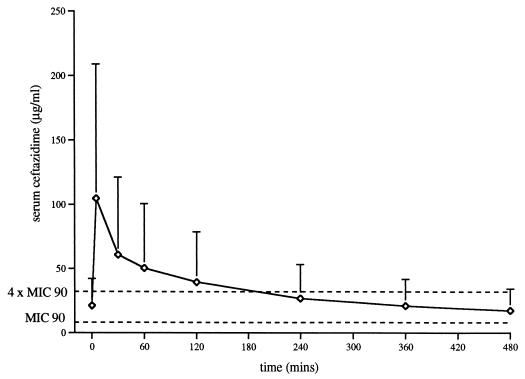
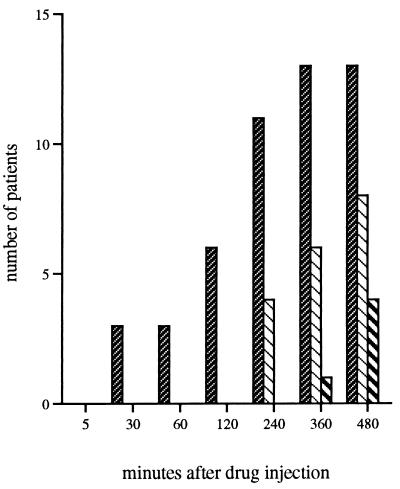
Figure 1 shows the mean (SD) concentrations of ceftazidime in serum at each sampling interval in relation to the MIC at which 90% of the isolates are inhibited (MIC90) and to four times the MIC90 for Pseudomonas aeruginosa. Table 2 shows the mean (SD) values for AUCSS, CL, Vβ, and t1/2β. In our patients ceftazidime mean Vβ and mean t1/2β were, respectively, 56.91 ± 25.93 liters and 4.75 ± 1.85 h, more than 4- and 2.5-fold greater than values for healthy controls (P < 0.001) (27). Mean values for ceftazidime CL and AUCSS did not differ significantly between the same groups. In the study patients, t1/2β did not correlate with Vβ, CL, or AUCSS. Figure 2 illustrates the numbers of patients at each time interval with serum ceftazidime concentrations below the MIC90s and four times the MIC90s for P. aeruginosa and other relatively common gram-negative rods.
FIG. 1.
Mean (SD) ceftazidime concentrations over an 8-h dosing interval (n = 15).
TABLE 2.
Pharmacokinetics of ceftazidime in critically ill patients and historical controls
| Subjects | Mean (SD)a
|
|||
|---|---|---|---|---|
| AUC (mg · h/liter) | CL (liter/h) | Vβ (liters) | t1/2β | |
| Study patients | 277.31 (138.98)b | 9.06 (4.79) | 56.91 (25.93)* | 4.75 (1.85)* |
| Historical controlsd | 153.5 (23.1)c | 6.64 (0.97) | 13.6 (1.9)* | 1.8 (0.14)* |
*, P < 0.001 by the unpaired t test.
AUCSS.
AUC from 0 h to infinity after a 1-g i.v. dose.
Data for controls are from reference 27.
FIG. 2.
Numbers of patients with serum ceftazidime
concentrations below target levels.
, ceftazidime concentration of
<32 μg/ml (which is four times the MIC90 for P.
aeruginosa); ▧, ceftazidime concentrations of <16 μg/ml
(which is four times the MIC90 for other gram-negative
rods, including E. cloacae);
 , ceftazidime
concentrations of <8 μg/ml (which is the MIC90 for
P. aeruginosa). All patients had concentrations in serum
greater than 4 μg/ml (MIC90 for E. cloacae).
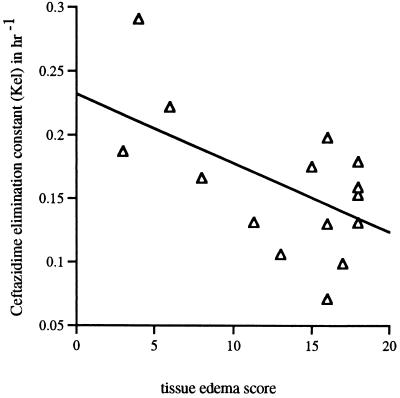
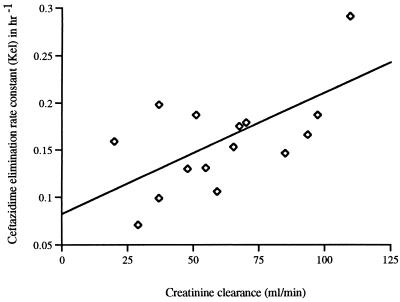
The median edema score was 16 (range, 0 to 18). Edema scores correlated negatively with the kel (r = 0.60, P = 0.02) (Fig. 3), as well as with the CLCR (r = 0.65, P = 0.01). There were no associations between tissue edema scores and any other pharmacokinetic parameters, including Vβs. Levels of creatinine, CLCRs, edema scores, and kels were compared by multivariate analysis, as independent predictor variables, with Vβs. None showed a statistically significant association with Vβs (all P values were >0.12). CLCRs correlated with kels (r = 0.67, P = 0.008) (Fig. 4).
FIG. 3.
Inverse correlation between the tissue edema scores and kels (r = 0.60, P = 0.02).
FIG. 4.
Ceftazidime kel versus CLCR (r = 0.67, P = 0.008).
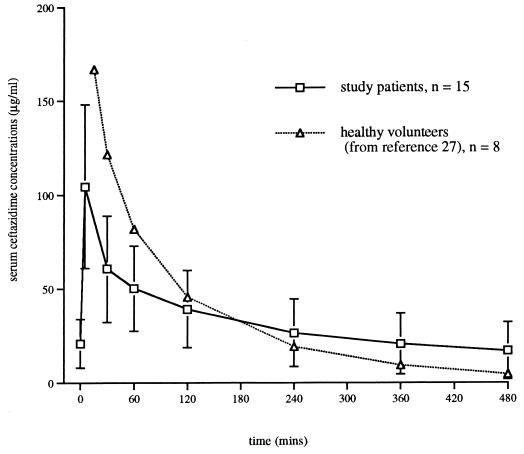
The main finding of our study is an important increase in the mean Vβ and mean t1/2β of ceftazidime relative to those for healthy volunteers (27). As ceftazidime CL was not significantly altered in our patients, the increased Vβ was the primary cause of the prolonged t1/2β. This elevated extracellular volume in our patient group, in effect a large drug reservoir, appeared to influence ceftazidime concentrations differently throughout the dosing interval. Initially, it contributed to lower concentrations of the drug in serum, but in the second half of the dosing interval, the delayed elimination, and thus the increased t1/2, increased drug concentrations relative to those in healthy volunteers (Fig. 5). This explains why the AUCSS in our study group was not significantly different from that of healthy volunteers (27). Our mean t1/2β was also increased relative to those reported from previous studies of critically ill patients (3, 28). There are no previous calculations of total Vβs (12) in the critically ill, and so we were unable to compare our results with those of others for this parameter.
FIG. 5.
Mean ceftazidime concentrations (after i.v. bolus) in study patients compared to those in healthy volunteers (27).
Values for CLCR from plasma varied markedly within this patient group. A level of creatinine in plasma within the normal laboratory range was a poor indicator of renal function, partly due to the dilutional effect of increased extracellular volume on plasma creatinine concentrations. In contrast to Young et al. (28), we found a correlation between CLCR and kel (Fig. 4) but not between the CLs of creatinine and ceftazidime.
The tissue edema score was designed to provide a simple bedside estimate of extracellular volume. Although we observed an inverse relationship between the edema score and kel (Fig. 3), it was not possible with this small number of patients to associate this arbitrary edema score with the raised Vβ for ceftazidime.
We also observed an inverse correlation between the edema score and CLCR, although not between the Vβ and CLCR. The greatly increased extracellular volume might have been caused by subtle and otherwise unimportant decreases in renal function, but specific abnormalities of critical illness—such as capillary leak—seem more plausible. In particular, both a deterioration in renal function and increased extracellular water may be related to severity of illness. Finally, it is also possible that the more ill patients, with concomitantly worse renal function, required more fluid to maintain circulatory stability.
The efficacy of ceftazidime is greatest when its concentration in serum is adequate throughout the dosing interval, best expressed as time above the MIC (5, 8, 16). The exact concentration in serum necessary for an effective bactericidal action varies with the individual pathogen strain, site of infection, and host response. Many organisms responsible for hospital-acquired infections display various susceptibilities to ceftazidime (15). This is reflected in a wide range and a scattered population distribution of MICs and in considerable differences between the MIC90s for different organisms as well as for different strains of the same organism. Indeed many species of P. aeruginosa, Enterobacter cloacae, and Klebsiella pneumoniae show MICs up to 128, 64, and 32 μg/ml, respectively (25). Furthermore, maximal killing, especially for multiresistant bacteria, is highest at about four to five times the MIC (6, 19), an arbitrary point which is considered to separate susceptible from resistant bacteria (1a, 19). For these reasons we report our results relative to usual MIC90s and to four times the MIC90s (Fig. 1 and 2).
In summary, this study is the first to show that the pharmacokinetics of ceftazidime in critically ill edematous patients may be altered, specifically by an increased Vβ.
Acknowledgments
This work was supported by GlaxoWellcome Pharmaceuticals, Stockley Park, United Kingdom.
We thank Neil McLachlan-Troup, Department of Toxicology, Charing Cross Hospital, London, United Kingdom, for performing the high-pressure liquid chromatography ceftazidime analysis. We are grateful also to Constantin Ephthymiopoulos, Glaxo Wellcome Research and Development, Greenford, United Kingdom, for performing the pharmacokinetic analysis.
REFERENCES
- 1.Ayrton J. Assay of ceftazidime in biological fluids using high pressure liquid chromatography. J Antimicrob Chemother. 1981;8(Suppl. B):227–231. doi: 10.1093/jac/8.suppl_b.227. [DOI] [PubMed] [Google Scholar]
- 1a.Archer G L, Polk R E. Treatment and prophylaxis of bacterial infections. In: Isselbacher K J, Braunwald E, Wilson J D, Martin J B, Fauci A S, Kasper D L, editors. Harrison’s principles of internal medicine. New York, N.Y: McGraw Hill Inc; 1994. [Google Scholar]
- 2.Bakker Woudenberg I A, Roosendaal R. Impact of dosage schedule of antibiotics on the treatment of serious infections. Intensive Care Med. 1990;16:S229–S234. doi: 10.1007/BF01709706. [DOI] [PubMed] [Google Scholar]
- 3.Benko A S, Cappelletty D M, Kruse J A, Rybak M J. Continuous infusion versus intermittent administration of ceftazidime in critically ill patients with suspected gram-negative infections. Antimicrob Agents Chemother. 1996;40:691–695. doi: 10.1128/aac.40.3.691. [DOI] [PMC free article] [PubMed] [Google Scholar]
- 4.Bone R C. The pathogenesis of sepsis. Ann Intern Med. 1991;115:457–469. doi: 10.7326/0003-4819-115-6-457. [DOI] [PubMed] [Google Scholar]
- 5.Craig W A. Pharmacokinetic/pharmacodynamic parameters: rationale for antibacterial dosing of mice and men. Clin Infect Dis. 1998;26:1–12. doi: 10.1086/516284. [DOI] [PubMed] [Google Scholar]
- 6.Craig W A, Ebert S C. Continuous infusion of beta-lactam antibiotics. Antimicrob Agents Chemother. 1992;36:2577–2583. doi: 10.1128/aac.36.12.2577. [DOI] [PMC free article] [PubMed] [Google Scholar]
- 7.Craig W A, Gudmundsson S. Postantibiotic effect. In: Lorian V, editor. Antibiotics in laboratory medicine. 4th ed. Baltimore, Md: Williams & Wilkins Co.; 1996. pp. 314–316. [Google Scholar]
- 8.Drusano G L. Role of pharmacokinetics in the outcome of infections. Antimicrob Agents Chemother. 1988;32:289–297. doi: 10.1128/aac.32.3.289. [DOI] [PMC free article] [PubMed] [Google Scholar]
- 9.Fantin B, Farinotti R, Thabaut A, Carbon C. Conditions for the emergence of resistance to cefpirome and ceftazidime in experimental endocarditis due to Pseudomonas aeruginosa. J Antimicrob Chemother. 1994;33:563–569. doi: 10.1093/jac/33.3.563. [DOI] [PubMed] [Google Scholar]
- 10.Gibaldi M, Perrier D. Pharmacokinetics. New York, N.Y: Marcel Dekker; 1989. [Google Scholar]
- 11.Glauser M P, Zanetti G, Baumgartner J D, Cohen J. Septic shock: pathogenesis. Lancet. 1991;338:732–735. doi: 10.1016/0140-6736(91)91452-z. [DOI] [PubMed] [Google Scholar]
- 12.Greenblatt D J, Koch-Weser J. Clinical pharmacokinetics. N Engl J Med. 1975;293:702–705. doi: 10.1056/NEJM197510022931406. [DOI] [PubMed] [Google Scholar]
- 13.Hanberger H, Nilsson L E, Nilsson M, Maller R. Post-antibiotic effect (PAE) of beta-lactam antibiotics on gram-negative bacteria in relation to morphology, initial killing and MIC. Eur J Clin Microbiol Infect Dis. 1991;10:927–934. doi: 10.1007/BF02005446. [DOI] [PubMed] [Google Scholar]
- 14.Harding S M, Ayrton J, Thornton J E, Munroe A J, Hogg M I J. Pharmacokinetics of ceftazidime in normal subjects. J Antimicrob Chemother. 1981;8(Suppl. B):261–262. doi: 10.1093/jac/8.suppl_b.261. [DOI] [PubMed] [Google Scholar]
- 15.Harding S M, Harper P B. The pharmacokinetic behaviour of ceftazidime in man and the relationship between serum levels and the in vitro susceptibility of clinical isolates. Infection. 1983;11:S49–S53. doi: 10.1007/BF01641107. [DOI] [PubMed] [Google Scholar]
- 16.Hatano K, Wakai Y, Watanabe Y, Mine Y. Simulation of human plasma levels of beta-lactams in mice by multiple dosing and the relationship between the therapeutic efficacy and pharmacodynamic parameters. Chemotherapy. 1994;40:1–7. doi: 10.1159/000239162. [DOI] [PubMed] [Google Scholar]
- 17.Knaus W A, Draper E A, Wagner D P, Zimmerman J E. APACHE II: a severity of disease classification system. Crit Care Med. 1985;13:818–829. [PubMed] [Google Scholar]
- 18.Leroy A, Leguy F, Borsa F, Spencer G R, Fillastre J P, Humbert G. Pharmacokinetics of ceftazidime in normal and uremic subjects. Antimicrob Agents Chemother. 1984;25:638–642. doi: 10.1128/aac.25.5.638. [DOI] [PMC free article] [PubMed] [Google Scholar]
- 19.Mouton J W, den Hollander J G. Killing of Pseudomonas aeruginosaduring continuous and intermittent infusion of ceftazidime in an in vitro pharmacokinetic model. Antimicrob Agents Chemother. 1994;38:931–936. doi: 10.1128/aac.38.5.931. [DOI] [PMC free article] [PubMed] [Google Scholar]
- 20.O’Callaghan C H, Acred P, Harper P B, Ryan D M, Kirby S M, Harding S M. GR 20263, a new broad-spectrum cephalosporin with anti-pseudomonal activity. Antimicrob Agents Chemother. 1980;17:876–883. doi: 10.1128/aac.17.5.876. [DOI] [PMC free article] [PubMed] [Google Scholar]
- 21.Tipper D J, Strominger J L. Mechanism of action of penicillin: a proposal based on their structural similarity to acyl-d-alanyl-d-alanine. Proc Natl Acad Sci USA. 1965;54:1133–1141. doi: 10.1073/pnas.54.4.1133. [DOI] [PMC free article] [PubMed] [Google Scholar]
- 22.Verbist L, Verhaegen J. GR-20263: a new aminothiazolyl cephalosporin with high activity against Pseudomonas and Enterobacteriaceae. Antimicrob Agents Chemother. 1980;17:807–812. doi: 10.1128/aac.17.5.807. [DOI] [PMC free article] [PubMed] [Google Scholar]
- 23.Vogelman B, Gudmundsson S, Leggett J, Turnidge J, Ebert S, Craig W A. Correlation of antimicrobial pharmacokinetic parameters with therapeutic efficacy in an animal model. J Infect Dis. 1988;158:831–847. doi: 10.1093/infdis/158.4.831. [DOI] [PubMed] [Google Scholar]
- 24.Waxman D J, Strominger J L. Penicillin-binding proteins and the mechanism of action of beta-lactam antibiotics. Annu Rev Biochem. 1983;52:825–869. doi: 10.1146/annurev.bi.52.070183.004141. [DOI] [PubMed] [Google Scholar]
- 25.Wiedemann B, Grimm H. Susceptibility to antibiotics: species incidence and trends. In: Lorian V, editor. Antibiotics in laboratory medicine. Baltimore, Md: Williams & Wilkins; 1996. [Google Scholar]
- 26.Wise R, Andrews J M, Bedford K A. Comparison of in vitro activity of GR 20263, a novel cephalosporin derivative, with activities of other beta-lactam compounds. Antimicrob Agents Chemother. 1980;17:884–889. doi: 10.1128/aac.17.5.884. [DOI] [PMC free article] [PubMed] [Google Scholar]
- 27.Wise R, Armstrong G C, Brown R M, Andrews J M. The pharmacokinetics and tissue penetration of ceftazidime and cefmandole in healthy volunteers. J Antimicrob Chemother. 1981;8(Suppl. B):277–282. doi: 10.1093/jac/8.suppl_b.277. [DOI] [PubMed] [Google Scholar]
- 28.Young R J, Lipman J, Gin T, Gomersall C D, Joynt G M, Oh T E. Intermittent bolus dosing of ceftazidime in critically ill patients. J Antimicrob Chemother. 1997;40:269–273. doi: 10.1093/jac/40.2.269. [DOI] [PubMed] [Google Scholar]


