

Summary
The mucosal antiviral role of type I and III interferon in influenza virus infection is well established. However, much less is known about the antiviral mechanism of type II interferon (interferon-gamma). Here, we revealed an antiviral mechanism of interferon-gamma by inhibiting influenza A virus (IAV) attachment. By direct stochastic optical reconstruction microscopy, confocal microscopy, and flow cytometry, we have shown that interferon-gamma reduced the size of α-2,3 and α-2,6-linked sialic acid clusters, without changing the sialic acid or epidermal growth factor receptor expression levels, or the sialic acid density within cluster on the cell surface of A549 cells. Reversing the effect of interferon-gamma on sialic acid clustering by jasplakinolide reverted the cluster size, improved IAV attachment and replication. Our findings showed the importance of sialic acid clustering in IAV attachment and infection. We also demonstrated the interference of sialic acid clustering as an anti-IAV mechanism of IFN-gamma for IAV infection.
Subject areas: Biological sciences, Immunology, Microbiology
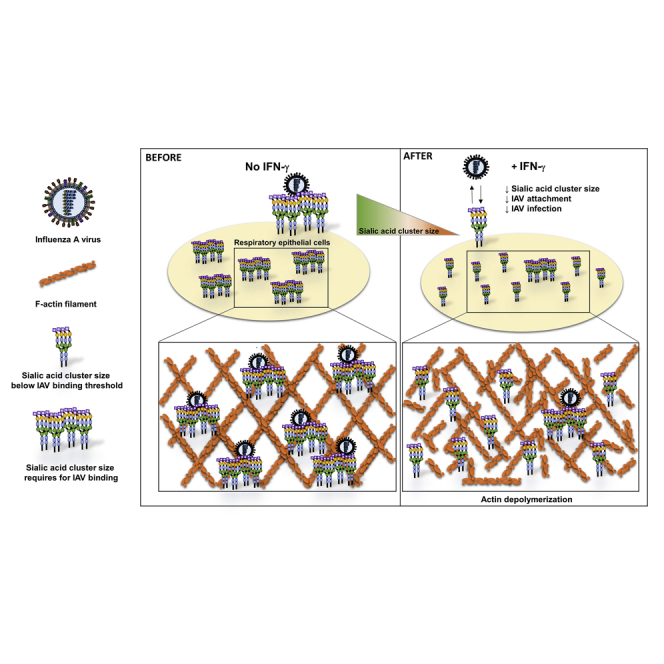
Graphical abstract
Highlights
-
•
IFN-γ inhibits IAV replication
-
•
IFN-γ reduces IAV attachment and infection by reducing sialic acid cluster size
-
•
Reduction of sialic acid cluster size partially depends on F-actin depolymerization
-
•
Higher sialic acid expression level does not correlate with increase IAV attachment
Biological sciences; Immunology; Microbiology
Introduction
Influenza virus causes seasonal epidemics and pandemics which are associated with significant morbidity and mortality (Cheng et al., 2012; To et al., 2013). Pneumonia is the major complication of influenza virus infection, although extra-pulmonary complications can also occur (To et al., 2019). Both innate and adaptive immunity are crucial in limiting disease severity (Doherty et al., 2006). Genome-wide association study showed that several host genetic polymorphisms are associated with severe influenza (To et al., 2014, 2015).
The respiratory epithelium serves as the initial site of influenza A virus (IAV) replication, thereby its defense mechanisms mediated by the innate immune system provide the first line of host defense (Sanders et al., 2011). Once IAV enters into the respiratory epithelial cells, the viral RNA is recognized as foreign by pathogen recognition receptors, initiating a cascade of inflammatory immune responses (Iwasaki and Pillai, 2014; Iwasaki et al., 2017). Type I and III interferons (IFNs) are the key antiviral cytokines that are produced immediately after viral infection (Chen et al., 2018; Busnadiego et al., 2020; Vanderheiden et al., 2020). Types I/III IFNs signal through their host receptors, leading to the activation of janus kinase 1 and tyrosine protein kinase 2. The phosphorylation of signal transducer and activator of transcription 1 (STAT1) and STAT2, and their binding to interferon regulatory factor, form the interferon-stimulated gene factor 3 (ISGF3). ISGF3 then bind to interferon-stimulated response elements, leading to the activation of IFN-stimulated genes (ISGs) that limit viral replication through diverse mechanisms and create an antiviral state (Schoggins, 2019).
Unlike type I and III IFNs, IFN-γ is not secreted by respiratory epithelial cells but from immune cells, such as natural killer cells (Ge et al., 2012), natural killer T cells (Ishikawa et al., 2010), gamma-delta (γδ) T cells (Dong et al., 2018), innate lymphoid cells 1 (ILC1) (Weizman et al., 2017), and CD8+ T cells (Koutsakos et al., 2019). IFN-γ activates a different signaling pathway that involves a STAT1 homodimer as the downstream transcription regulator, which drives transcription of ISGs with a gamma-activated site promoter (Fensterl et al., 2015). IFN-γ can induce the ISG IFN-induced transmembrane protein 3 (IFITM3) to inhibit IAV entry by hindering the fusion of the viral envelope with the endosomal membrane, and subsequently inhibit the release of viral ribonucleoproteins (vRNP) from endosome (Brass et al., 2009; Desai et al., 2014; Feeley et al., 2011; Li et al., 2013).
Compared to the well-recognized protective roles of type I and III IFN during IAV infection, much less is known about IFN-γ and IAV infection. In patients, IFN-γ can be detected in the blood during the first 24 h of IAV infection (Bian et al., 2014; Pommerenke et al., 2012; Weizman et al., 2017). In mouse models, IFN-γ can be detected in the lung, especially from the lung resident ILC1 at 24 h.p.i (hour post infection), and ILC1 was shown to confer host protection at the initial sites of viral infection (Weizman et al., 2017; Pommerenke et al., 2012). Several groups have demonstrated that IFN-γ can protect mice during influenza virus infection (Berri et al., 2014; Weiss et al., 2010; Bot et al., 1998). Collectively, these studies have shed light on a host protective role of IFN-γ in the lung during the early stage of influenza virus infection.
In our previous study, we have shown that IFN-γ induces human tryptophanyl-tRNA synthetase to facilitate the entry of enterovirus A71 (EV-A71) (Yeung et al., 2018). Conversely, IFN-γ has also been shown to reduce human immunodeficiency virus (HIV) type 1 and hepatitis C virus infection by down-regulating the viral receptors CD4 and claudin-1 expression (Dhawan et al., 1995; Wei et al., 2009). However, the role of IFN-γ in receptor binding of IAV is not known. In current study, we investigated the role of IFN-γ during the entry phase of IAV infection in respiratory epithelial cells. We showed IFN-γ inhibited influenza A virus infection by decreasing α-2,3, α-2,6-linked sialic acid cluster size without changing the sialic acid expression levels, reduced virus attachment and replication. Further studies showed IFN-γ altered the morphology of the F-actin cytoskeleton. Inducing actin polymerization by jasplakinolide reverted the reduced α-2,6-linked cluster size, improved viral binding and replication. Our finding demonstrated the importance of sialic acid cluster size during IAV infection in lived cells, and revealed an anti-IAV mechanism of IFN-γ during the viral binding step on respiratory epithelium.
Results
IFN-γ inhibits influenza virus replication in respiratory epithelial cells
First, we evaluated the cellular toxicity of IFN-γ. We did not observe any toxicity for IFN-γ in A549 cells (up to 4,000 IU/mL) and Calu3 (up to 1,000 IU/mL) (Figure S1).
Next, we evaluated the effect of IFN-γ on IAV infection in the respiratory epithelial cell line, A549. When A549 cells were pre-treated with IFN-γ for 1 h or 24 h before infection, a significant reduction of IAV replication was observed as shown in Figure 1A. To confirm this finding, we performed an immunofluorescense assay for viral protein expression (To et al., 2016). In line with the multicycle growth assay, a dose-dependent inhibition of influenza nucleoprotein expression was observed from IFN-γ pre-treated cells when compared with the un-treated cells (Figure 1B), confirming the anti-IAV effect of IFN-γ in A549 cells.
Figure 1.

IFN-γ inhibits influenza virus replication in respiratory epithelial cells
(A) A549 with or without IFN-γ pre-treatment at 1 h or 24 h were infected with A/Hong Kong/415742/2009(H1N1) virus at an MOI of 0.01. Culture supernatant was collected 24 h post infection for plaque assay with MDCK cells. The average of three independent experiments performed with three biological replicates is shown. Data are represented as mean +/− standard error of mean (SEM). Multiple t test was used to test statistical significance. ∗∗∗∗p ≤ 0.0001. Error bar indicates SEM.
(B) A549 with or without 24 h IFN-γ pre-treatment wereinfected with A/Hong Kong/415742/2009(H1N1) at an MOI of 1. Infected cells were stained using the D3 Ultra 8 DFA respiratory virus screening and identification kit and viewed under epifluorescent illumination of Eurostar III plus fluorescence microscope. Magnification ×100. Representative images are from three independent experiments with three biological replicates of each condition.
(C) A549 cells were pre-treated with 0 or 25 IU/mL IFN-γ at 1 h or 24 h before infection, or cells were added together with the virus at 0 h, or 1 h post viral inoculation with A/Hong Kong/415742/2009(H1N1) at an MOI of 0.01. Culture supernatant was collected 24 h post infection and tested with plaque assay in MDCK cells. The average of three independent experiments performed with three biological replicates is shown. Data are represented as mean ± SEM. Multiple t test was used to test statistical significance. ns – not significant, ∗∗p ≤ 0.01, ∗∗∗p ≤ 0.001. Error bar indicates SEM.
(D) A549 cells with or without 24 h IFN-γ pre-treatment were inoculated with A/Hong Kong/415742/2009(H1N1) at an MOI of 0.1. Cell lysates were collected at 24 h.p.i for RT-qPCR to measure the expression levels of cytokines (IFNB1, IFNL1, IFNL2/3, IL-6, TNF, and IL-10) and chemokines (CXCL10, CCL2). The average of three independent experiments was performed, with two biological replicates from one experiment and three biological replicates from two experiments is shown. Data are represented as mean ± SEM Multiple t test was used to test statistical significance. ∗∗p ≤ 0.01, ∗∗∗p ≤ 0.001, ∗∗∗∗p ≤ 0.0001. Error bar indicates SEM.
Next, we performed a time-of-addition experiment to identify the stage of viral replication that is inhibited by IFN-γ. When IFN-γ was added to the cells at 24 h and 1 h before IAV infection, IAV replication was reduced by approximately 80% and 40% (Figure 1C). The addition of IFN-γ and IAV to the cells at the same time could also reduce viral replication by 40%. However, IFN-γ did not significantly inhibit IAV replication if added 1 h.p.i. In addition to being the primary target of IAV, respiratory epithelial cells are also involved in initiating the first wave of cytokine and chemokine production to amplify the inflammatory cascades for viral clearance (Vareille et al., 2011; Denney and Ho, 2018). We thus measured the expression levels of various cytokines and chemokines by RT-qPCR. In line with the lower IAV replication, the mRNA expression levels of IAV mediated cytokines and chemokines; interferon-beta (IFNB1), interferon lambda 1 (IFNL1), interferon lambda 2/3 (IFNL2/3), interleukin-6 (IL-6), tumor necrosis factor-alpha (TNF), C-X-C motif chemokine ligand 10 (CXCL10), C-C motif chemokine ligand 2 (CCL2), and interlekin-10 (IL-10) expression were also lower in IFN-γ pre-treated cells than those of un-treated cells (Figure 1D). Collectively, these results suggest the antiviral effect was mediated before the virus enters into A549 cells.
Cells pre-exposed to IFN-γ are protected from infectious progeny
In order to mimic the IAV spreading in vivo, we set up a co-culture system by mixing IAV infected and un-infected A549 cells at a ratio of 1:5. During incubation, the virus progeny from infected A549 cells will spread to non-infected A549 cells. To ensure there are enough infectious progeny secreted from the infected cells, we first assessed the virus titer required to infect over 90% of cells after 24 h in our system. At 1 multiplicity of infection (MOI), >90% of the cell population was infected (Figure 2A). Therefore, 1 MOI was selected for the viral transmission co-culture experiment.
Figure 2.

Cells pre-exposed to IFN-γ are protected from infectious progeny
(A) 1 × 10⁴ A549 cells were inoculated with A/Hong Kong/415742/2009(H1N1) at an MOI of 0.1 or 1. F-actin was stained with Alexa Fluor™ 488 phalloidin (green) and IAV was stained with mouse anti-nucleoprotein IgG2a, or mouse IgG2a isotype control, and goat anti-mouse IgG AF633 (Red). All samples were mounted with Prolong™ Diamond Antifade with DAPI (Blue). Confocal images were taken with Carl Zeiss LSM880 and analyzed with software Zen 2.3 Blue Edition. Scale bar 50 μm.
(B) 1 × 10⁴ A549 cells were infected with A/Hong Kong/415742/2009(H1N1) at an MOI of 1. Infected cells were co-cultured with 5 × 10⁴ of 24 h IFN-γ pre-treated, un-infected A549 cells. A total of 3 indepedent experiments were performed with image of n = 6 from each experiment.Representative confocal images are shown. F-actin was stained with Alexa Fluor™ 488 phalloidin (green) and IAV was stained with mouse anti-nucleoprotein IgG2a, or mouse IgG2a isotype control, and goat anti-mouse IgG AF633 (Red). All samples were mounted with Prolong™ Diamond Antifade with DAPI (Blue). Confocal images were taken with Carl Zeiss LSM880 and analyzed with software Zen 2.3 Blue Edition. Scale bar 50 μm.
For the co-culture experiment, non-infected IFN-treated A549 cells were much less susceptible to IAV infection when compared with mock-treated A549 cells (Figure 2B). This result suggests that pre-exposure of IFN-γ can protect cells from IAV infection.
IFN-γ reduces IAV attachment on the cell surface
Next, we investigated if the antiviral effect of IFN-γ is related to virus attachment. We first evaluated our attachment assay system by staining the virus and F-actin cytoskeleton on A549 cells. Confocal imaging analysis showed the X-Y single-axial section through the middle of cells, with the viruses remained on the cell surface without entering the cells (Figure 3A). By using the attachment assay system, we studied the effect of IFN-γ on IAV attachment by confocal imaging. We found a reduction of virus attachment on A549 cells pre-treated with IFN-γ than the un-treated cells (Figure 3B). To confirm this finding, we applied flow cytometry analysis as a quantitative approach. Consistent with the confocal analysis, a lower level of virus attachment was detected on cells pre-treated with IFN-γ when compared to the un-treated cells (Figure 3C). Taken together, we demonstrated that cells pre-exposed to IFN-γ have lowered IAV attachment on the cell surface.
Figure 3.

IFN-γ reduces IAV attachment on the cell surface
(A and B) A549 cells were inoculated with A/Hong Kong/415742/2009(H1N1) at an MOI of 50 on ice. IAV was stained with mouse anti-nucleoprotein IgG2a or mouse IgG2a isotype control, and goat anti-mouse IgG AF633 (Red). F-actin was stained with Alexa Fluor™ 488 Phalloidin (Cyan) as indicated. All samples were mounted with Prolong™ Diamond Antifade with DAPI (Blue). Confocal images were taken with Carl Zeiss LSM710 and analyzed with software Zen 2.3 Blue Edition.
(A) X-Y single-axial sections are shown to locate where the virus locates in the cell; F-actins (Cyan), nucleoprotein (Red). Scale bar 20 μm.
(B) Virus attachment is shown by nucleoprotein (Red) and DAPI (Blue). A representative of confocal images is shown from 2 independent experiments of image (n = 6). Scale bar 10 μm.
(C) A549 cells with or without 24 h IFN-γ pre-treatment were inoculated with A/Hong Kong/415742/2009(H1N1) at an MOI of 5 on ice. IAV was stained with rabbit anti-hemagglutinin IgG, or rabbit IgG isotype control, and donkey anti-rabbit IgG PE. Dead cells were excluded with the staining of zombie violet dye. The average of three independent experiments performed with two biological replicates is shown. Data are represented as mean ± SEM. Multiple t test was used to test statistical significance. ns - not significant, ∗p ≤ 0.05. Error bar indicates SEM.
IFN-γ changes the morphology of α-2, 3, α-2, 6-linked sialic acids, but not their expression levels on the cell surface
We postulated the lower IAV attachment mediated by IFN-γ is related to the expression levels of IAV attachment factor and/or receptor. Flow cytometry analysis showed IFN-γ did not affect the expression levels of α-2, 3-linked sialic acids, α-2, 6-linked sialic acids, or epidermal growth factor receptor (EGFR) (Figure 4A). We then tested the effect of IFN-γ on α-2, 6 and α-2, 3-linked sialic acid morphorolgy by confocal imaging analysis. From IFN-γ un-treated cells, α-2, 3-linked and α-2, 6-linked sialic acids distributed evenly in regular dimensions of a typical polygonal shape of epithelial-like cells. After IFN-γ pre-treatment, the distribution of α-2, 3 and α-2, 6-linked sialic acid on the cell boundary become twisted and the epithelial-like polygonal shape disappeared (Figures 4B and 4C).
Figure 4.

IFN-γ changes the morphology of α-2, 3-linked, α-2, 6-linked sialic acids, but not their expression levels
(A) A549 cells with or without 24 h IFN-γ pre-treatment were stained with biotin-conjugated MAA for α-2, 3-linked sialic acids or biotin-conjugated SNA I for α-2,6-linked sialic acid and strep-APC or Alexa Fluor 488 mouse anti-human-EGFR IgG1. Strep-APC only and Alexa Fluor 488 anti-mouse IgG1 were used as control for sialic acids and EGFR staining. Dead cells were excluded with propidium iodide and their expression levels were analyzed with flow cytometry. Representative data are shown from three independent experiments of three biological replicates.
(B and C) A549 cells with or without 24h IFN-γ pre-treatment were stained with biotin-conjugated MAA forα-2, 3-linked sialic acids or biotin-conjugated SNA I for α-2, 6-linked sialic acids together with strep-APC (Magenta). F-actin was stained with Alexa Fluor™ 488 Phalloidin (Green). All samples were mounted with Prolong™ Diamond Antifade with DAPI (Blue). Confocal images were taken with Carl Zeiss LSM 710 and analyzed with software Zen 2.3 Blue Edition. Representative images are shown from 3 independent experiments of images (n = 6). Scale bar 10 μm.
One possible factor that affects the pattern of sialic acid is a change in the actin cytoskeleton. Therefore, we studied the effect of IFN-γ on F-actin filament. Similar to the sialic acid, F-actin filaments are organized in regular dimensions with defined linear filaments, creating a polygonal shape of epithelial-like cell structure. With IFN-γ pre-treatment, the linear filaments of F-actin disappeared and the linear cell boundaries became poorly defined (Figures 4B and 4C).
IFN-γ reduces α-2,6-linked sialic acid cluster size
The affinity of single glycan–HA is relatively weak with dissociation constant (Kd) in millimolar range (Sauter et al., 1989, 1992; Sieben et al., 2012). The weak binding force suggests stable binding between sialic acids and HA is avidity driven. Thus, sialic acid cluster size could be a criterion for stable IAV binding. We hypothesize that the reduced virus attachment correlates with the receptor cluster size for stable viral binding. By direct stochastic optical reconstruction microscopy (dSTORM) analysis, we found that α-2,6-linked sialic acid forms heterogenous clusters with different cluster sizes on the cell surface (Figure 5A).
Figure 5.

IFN-γ reduces α-2,6-linked sialic acid cluster size
(A–C) A549 cells with or without 24 h IFN-γ pre-treatment were stained with biotin-conjugated SNA I, strep-AF647 and α-2,6-linked sialic acid cluster sizes were measured by dSTORM imaging. Alpha-2,6-linked sialic acid cluster with different sizes was identified by image-based analysis from the built in function of Particle Analysis in Image J, Fiji, with a fixed threshold setting of 32/255. Four independent experiments with an average of n = 6 cells were performed.
(A) Identification of α-2,6-linked sialic acid cluster with different size; area (nm2). Scale bar 1 μm.
(B) The top 1000 with the largest cluster sizes were categorized into 9 groups; 1) ≥200,000 nm2 2) 150,000–199,999 nm2 3) 100,000–149,999 nm2 4) 50,000–99,999 nm2 5) 10,000–49,999 nm2 6) 5,000–9,999 nm2 7) 1,000–4,999 nm2 8) 500–999 nm2 9) 100–499 nm2. The number of event in percentage is presented as pie chart and the statistical significance of 4 independent experiments (an average of n = 6 cells) is shown as bar chart. Data are represented as mean ± SEM. Multiple t test was used to test statistical significance. ns - not significant, ∗∗p ≤ 0.001, ∗∗∗p ≤ 0.001. Error bar indicates SEM.
(C) Representative images of - α2,6-linked sialic acid clusters on un-treated and 24 h IFN-γ-treated A549 cells are shown. Scale bar 1 μm.
Next, we assessed the cluster size of cell surface α-2,6-linked sialic acid using the particle analysis function of software Image J (Fiji) (Schindelin et al., 2012; Henriques et al., 2010). The particle analysis function is an image-based method to identify qualified clusters after fixed threshold setting. An example of identified cluster with different size is shown in Figure 5A. From the identified clusters, we selected the 1000 largest clusters for data analysis. Among the 9 cluster groups analyzed, the clusters with size between 50,000 and 99,999 nm2 (control: 1.45%; IFN-γ pre-treated cells: 0.71%), 10,000–49,999 nm2 (control 9.6%; IFN-γ pre-treated cells 4.98%), and 5,000–9,999 nm2 (control 10.13%; IFN-γ pre-treated cells 5.68%), were significantly reduced by IFN-γ (Figures 5B and 5C).
The anti-influenza A virus effect of IFN-γ is partially dependent on actin depolymerization
It was reported that IFN-γ shortens actin filament by guanylate-binding protein 1 (GBP-1) induction (Ostler et al., 2014). We thus tested if jasplakinolide, an actin polymerization inducer (Bubb et al., 1994, 2000), could reverse the anti-IAV effect of IFN-γ. Jasplakinolide reversed the antiviral effect of IFN-γ at doses of 125 nM and 250 nM (Figure 6A). Furthermore, we found that 250 nM of jasplakinolide also increased IAV replication in cells without IFN-γ pre-treatment. As such, to avoid the background effect caused by jasplikinolide, we selected 125-nM jasplikinolide treatment for subsequent experiments.
Figure 6.

The anti-influenza A virus effect of IFN-γ is partially dependent on actin depolymerization
(A)A549 cells with or without 24 h IFN-γ pre-treatment were treated with 62.5, 125, and 250 nM of jasplakinoline or the equivalent dilution of DMSO at 37°C. Cells were inoculated with A/Hong Kong/415742/2009(H1N1) at an MOI of 0.01. Cell culture supernatant was collected at 24 h post infection for virus purification; M gene was quantified by RT-qPCR. The average of two independent experiments performed with three biological replicates is shown. Data are represented as mean ± SEM. Multiple t test was used to test statistical significance. ns - not significant, ∗∗p ≤ 0.001, ∗∗∗p ≤ 0.001, ∗∗∗∗p ≤ 0.0001. Error bar indicates SEM.
(B) A549 cells with or without 24 h IFN-γ pre-treatment were treated with 125 nM of jasplakinolide or the equivalent dilution of DMSO at 37°C. F-actin was stained with Alexa Fluor™ 488 Phalloidin (Green). All samples were mounted with Prolong™ diamond Antifade with DAPI (Blue). Confocal images were taken with Carl Zeiss LSM880 and analyzed with software Zen 2.3 Blue Edition. Representative images are shown from two independent experiments of images (average of n = 6). Scale bar = 10 μm.
(C) A549 cells with or without 24 h IFN-γ pre-treatment were treated with 125 nM jasplakinolide or DMSO at 37°C and inoculated with A/Hong Kong/415742/2009(H1N1) at an MOI of 5 at 4°C. IAV were stained with rabbit anti-hemagglutinin IgG or rabbit IgG isotype control, and donkey anti-rabbit IgG PE. Dead cells were excluded with the staining of zombie violet dye. The average of two independent experiments performed with three biological replicates is shown. Data are represented as mean ± SEM. Multiple t test was used to test statistical significance. ns - not significant, ∗∗p ≤ 0.001, ∗∗∗p ≤ 0.001, ∗∗∗∗p ≤ 0.0001. Error bar indicates SEM.
(D) A549 cells pre-treated with 24 h IFN-γ were treated with 125 nM of jasplakinolide or DMSO at 37°C. Alpha-2,6-linked sialic acid was stained with biotin-conjugated SNA I and strep-AF647 and α-2,6-linked sialic acid cluster size was analyzed by dSTORM imaging. The top 1000 clusters with the largest size were selected and divided into 3 groups; 10,000->200,000 nm2, 5,000–9,999 nm2, and 100–4,999 nm2. The number of event in percentage is presented as pie chart and the statistical significance of the average of two independent experiment of (n = an average of 6 cells) is shown as bar chart. Data are represented as mean ± SEM. Multiple t test was used to test statistical significance. ns - not significant, ∗p ≤ 0.05, ∗∗p ≤ 0.001, ∗∗∗∗p ≤ 0.0001. Error bar indicates SEM.
(E) dSTORM analysis of clusters size of 5,000-200,000 nm2 are highlighted in yellow. A fixed area of 4 μm2 (2 × 2 μm) are shown as squares. The number of cluster within the area of 4 μm2 is counted. Two independent experiment of an average of 6 cells was performed and the representative images are shown. Scale bar = 2 μm.
Next, we checked the morphology of F-actin filament by confocal imaging. From IFN-γ pre-treated cells, we found jasplakinolide treatment restored the linear filament morphology as observed in IFN-γ un-treated cells. Furthermore, we also found a higher number of linear F-actin filaments from the jasplakinolide-treated cells (Figure 6B).
To evaluate if inducing actin polymerization can reverse the inhibitory effect of IFN-γ on IAV attachment, cells were treated with 125 nM jasplakinolide or DMSO and IAV attachment was measured by flow cytometer. FACS analysis showed neither DMSO nor jasplakinolide has any effect on IAV attachment from IFN-γ un-treated cells. Jasplakinolide reduced the inhibitory effect of IFN-γ by 50% (Figure 6C).
We next studied the impact of jasplakinolide on the effect of IFN-γ on α-2,6-linked sialic acid cluster size. IFN-γ reduced the event numbers of cluster 10,000–200,000 nm2 and 5,000–9,999 nm2 by approximately two folds (Figure 6D). Jasplakinolide treatment completely reverted the cluster size of α-2,6-linked sialic acid from IFN-γ pre-treated cells by increasing the event numbers of cluster 10,000–200,000 nm2 and 5,000–9,999nm2 by approximately three to four folds (Figure 6D). The increase of cluster number is also accompanied with higher cluster density throughout the cell membrane (Figure 6E). Taken together, we showed that jasplakinolide restored the effect of IFN-γ on F-actin filament morphology, α-2,6-linked sialic acid cluster size, and improved IAV attachment and replication.
IFN-γ and jasplakinolide have no effect on the density of α-2,6-linked sialic acid clusters
We next analyzed the density of α-2,6-linked sialic acid per cluster. The density is defined as the number of sialic acid particles per cluster. Images were analyzed with Fiji with workflow as follow. Localizations from dSTORM were plotted into particle distribution histogram with QuickPALM plugin (Henriques et al., 2010). Clusters are defined when there are at least 2 localizations in a 100 nm2 space. Alpha-2,6-linked sialic acid densities were then calculated from number of localizations observed within an area described by convex hull of the cluster. Clusters were classified according to their area and sialic acid densities (Figure 7A). Our results show there were no significant differences in the density of α-2,6-linked sialic acid per cluster between IFN-γ un-treated cells and IFN-γ pre-treated cells with or without jasplakinolide, indicating the density of sialic acid per cluster has no impact on IAV infection (Figure 7B).
Figure 7.

IFN-γ and jasplakinolide have no effect on the density of α-2,6-linked sialic acid clusters
(A) The longest diagonal of the convex hull polygons around the clusters was identified by Image J, Fiji. Clusters with size 30,000–39,000 nm2 are highlighted in yellow. The α-2,6-linked sialic acid densities were calculated from the number of α-2,6-linked sialic acid particle localizations observed within an area described by convex hull of the cluster. Scale bar = 1 μm.
(B) The number of α-2,6-linked sialic acid particle within 10,000–200,000 nm2 and 5,000–9,999 nm2 clusters are shown. The percentages of 1–2.99, 3–4.99, and 5–10 α-2,6-linked sialic acid particles/nm2 are shown in pie chart. Statistical significance of the average from two independent experiments with an average of n = 6 cells is shown as bar chart. Results were obtained from the same experiment of Figure 6D with further analysis. Data are represented as mean ± SEM. Multiple t test was used to test statistical significance. ns - not significant. Error bar indicates SEM.
IFN-γ reduces H3N2 and H5N1 replication, attachment, and 2,3-linked sialic acid cluster size in A549 cells
To extend our study to other influenza strains, we repeated the experiments with H3N2 and H5N1 in A549 cells. As observed with H1N1, the viral replication (Figure 8A) and attachment (Figure 8B) were also reduced with H3N2 and H5N1 in IFN-γ pre-treated cells. Furthermore, dSTORM analysis showed IFN-γ pretreatment reduced α-2,3-linked sialic acid cluster size in A549 cells (Figure 8C). Taken together, these studies showed the antiviral effects of IFN-γ that observed with H1N1 is also applied to other IAV subtypes.
Figure 8.

IFN-γ reduces H3N2 and H5N1 replication, attachment, and 2,3-linked sialic acid cluster size in A549 cells
(A) A549 cells were pre-treated with 0 or 400 IU/mL IFN-γ for 24 h before inoculation with A/Hong Kong/417610/2018 (H3N2) or A/Vietnam/1194/2004 (H5N1) at an MOI of 0.1. Culture supernatant was collected 24 h post infection and tested with plaque assay in MDCK cells. The average of two independent experiments performed with two biological replicates is shown. Data are represented as mean ± SEM. Unpaired t test was used to test statistical significance. ∗∗∗p ≤ 0.001, ∗∗∗∗p ≤ 0.0001. Error bar indicates SEM.
(B) A549 cells with or without 24 h IFN-γ pre-treatment were inoculated with A/Hong Kong/417610/2018 (H3N2) at an MOI of 5 or A/Vietnam/1194/2004 (H5N1) at an MOI of 1. For H3N2, IAV was stained with influenza A H3N2 HA antibody, rabbit monoclonal antibody or isotype control rabbit IgG, and donkey anti-rabbit IgG PE. Dead cells were excluded with the staining of zombie violet dye. For H5N1, cells were washed three times with PBS and lysed with RLT buffer. Cell lysates were collected to measure M gene by RT-qPCR. The average of two independent experiments performed with three biological replicates is shown. Data are represented as mean ± SEM. Unpaired t test was used to test statistical significance. ∗p ≤ 0.05. Error bar indicates SEM.
(C) dA549 cells with or without 24 h IFN-γ pre-treatment were stained with biotin-conjugated MAA and strep-AF647. Alpha-2,3-linked sialic acid cluster sizes were measured by dSTORM imaging and analyzed by image-based analysis from the built in function of Particle Analysis in Image J, Fiji, with a fixed threshold setting of 85/255. The cluster sizes were categorized into 6 groups; 1) ≥15,000 nm2 2) 10,000–14,999 nm2 3) 5,000–9,999 nm2 4) 1,000–4,999 nm2 5) 500–999 nm2 6) 100–499 nm2. The number of event in percentage is presented as pie and bar chart. The statistical significance of the average of 2 independent experiments with an average of n = 8 cells is shown. Data are represented as mean ± SEM. Multiple t test was used to test statistical significance. ns - not significant, ∗p ≤ 0.05, ∗∗p ≤ 0.01, ∗∗∗p ≤ 0.001, ∗∗∗∗p ≤ 0.0001. Error bar indicates SEM. Representative images of α-2,3-linked sialic acid clusters on un-treated and IFN-γ--treated A549 cells are are shown. Scale bar 1 μm.
IFN-γ reduces IAV replication, attachment, and sialic acid cluster size, but increases the sialic acid expression level in Calu3 cells
We next extend our studies with another respiratory epithelial cell, Calu3. Consistent with A549 cells, H1N1, H3N2, and H5N1 replication (Figure 9A), attachment (Figure 9B), together with α-2,6 and α-2,3-linked sialic acid cluster size (Figures 9D and 9E) were all reduced in IFN-γ pre-treated Calu3 when compared to the untreated cells. Interestingly, we found the α-2,6-linked sialic acid expression level is higher in Calu3 cells with IFN-γ pretreatment when compared to the control cells (Figure 9C). This is in line with A549, in which we found no difference in the sialic acid expression level between A549 cells with or without IFN-γ pretreatment (Figure 4C), but the attachment of H1N1, H3N2, and H5N1 was reduced (Figures 3B, 3C, and 8B). Taken together, these data suggested that higher sialic acid expression level is not sufficient to influence IAV binding.
Figure 9.

IFN-γ reduces IAV replication, attachment and sialic acid cluster size, but increases sialic acid expression level in Calu3 cells
(A) Calu3 cells were pre-treated with 0 or 400 IU/mL IFN-γ for 24 h before inoculation with A/Hong Kong/415742/2009 (H1N1) or A/Hong Kong/417610/2018 (H3N2) or A/Vietnam/1194/2004 (H5N1) at an MOI of of 0.1. Culture supernatant was collected 24 h post infection and tested with plaque assay in MDCK cells. The average of two independent experiments performed with three biological replicates is shown. Data are represented as mean ± SEM. Unpaired t test was used to test statistical significance. ∗p ≤ 0.05, ∗∗∗p ≤ 0.001, ∗∗∗∗p ≤ 0.0001. Error bar indicates SEM.
(B) Calu3 cells with or without 24 h IFN-γ pre-treatment were inoculated with A/Hong Kong/415742/2009 (H1N1), or A/Hong Kong/417610/2018 (H3N2) at an MOI of 5 or A/Vietnam/1194/2004 (H5N1) at an MOI of 1 at 4°C. For H1N1 and H3N2, IAV was stained with anti-hemagglutinin rabbit monoclonal antibody or isotype control rabbit IgG and donkey anti-rabbit IgG PE. Dead cells were excluded with the staining of zombie violet dye. For H5N1, cells were washed three times with PBS and lysed with RLT buffer. Cell lysates were collected to measure M gene by RT-qPCR. The average of two independent experiments performed with three biological replicates is shown. Data are represented as mean ± SEM. Unpaired t test was used to test statistical significance. ∗p ≤ 0.05, ∗∗∗p ≤ 0.001. Error bar indicates SEM.
(C) Calu3 cells with or without 24 h IFN-γ pre-treatmentwere stained with biotin-conjugated MAA for α-2, 3-linked sialic acids or biotin-conjugated SNA I for α-2,6-linked sialic acid together with strep-APC. Dead cells were excluded with zombie violet dye and their expression levels were analyzed with flow cytometry. The average of two independent experiments with three biological replicates is shown. Data are represented as mean ± SEM. Unpaired t test was used to test statistical significance. ns - not significant, ∗∗∗p ≤ 0.001. Error bar indicates SEM.
(D and E) Calu3 cells with or without 24 h IFN-γ pre-treatment were stained with biotin-conjugated MAA or biotin-conjugated SNA I and strep-AF647. Alpha-2,3- and α-2,6-linked sialic acid cluster sizes were measured by dSTORM imaging and analyzed by image based analysis from the built in function of Particle Analysis in Image J, Fiji, with a fixed threshold setting of 85/255. The cluster sizes were categorized into 6 groups; 1) ≥15,000 nm2 2) 10,000–14,999 nm2 3) 5,000–9,999 nm2 4) 1,000–4,999 nm2 5) 500–999 nm2 6) 100–499 nm2. The average of two independent experiments with an average of n = 8 cells is shown as bar and pie charts. Multiple t test was used to test statistical significance. ns - not significant, ∗p ≤ 0.05, ∗∗p ≤ 0.001, ∗∗∗p ≤ 0.001, ∗∗∗∗p ≤ 0.0001. Error bar indicates SEM. Representative images of α-2,3- and α-2,6-linked sialic acid clusters on un-treated and IFN-γ-treated Calu3 cells are shown. Scale bar 1 μm.
Discussion
IFNs are well recognized for their anti-IAV activities. Much effort has been focused on type I and III IFNs due to their rapid anti-IAV protective effects on respiratory epithelial cells, while the implication of type II IFN, IFN-γ, remain poorly understood. Previous studies showed that IFN-γ can mediate cell-directed antiviral effects by regulating the expression levels of cell surface receptors or inducing IFITM3 to inhibit viral and endosomal membrane fusion (Dhawan et al., 1995; Wei et al., 2009; Brass et al., 2009). In the current study, we demonstrated that instead of affecting the expression of IAV receptors, IFN-γ reduced the cluster size of sialic acid on the host cells, which impairs IAV binding onto host cells and infection. Mechanistically, we showed the inhibitory effect of IFN-γ on sialic acid clustering depends on actin depolymerization. Together, we have discovered an anti-IAV mechanism of IFN-γ by reducing IAV binding onto respiratory epithelial cells through interfering sialic acid clustering.
Viral binding has a crucial impact for viral entry and replication. Several receptors/attachment/entry factors have been reported, such as sialyated glycoprotein (Nicholls et al., 2007), nucleolin (Chan et al., 2016), EGFR (Eierhoff et al., 2010), dendritic cell-specific intercellular adhesion molecule-3-grabbing nonintegrin (Gillespie et al., 2016), and macrophage mannose receptor (Reading et al., 2000). The sialyated glycoprotein is the most important receptor for IAV. Different sialic acid and particular structural sialic acid conformation have been reported as the determinants for IAV binding and infection (Chandrasekaran et al., 2008; Suzuki et al., 2000). In the current study, we have shown that cluster size is an important determinant for IAV binding. dSTORM and FACS analysis have shown that the antiviral effect of IFN-γ reduces viral attachment and sialic acid cluster size, whereas the sialic acid density within cluster or sialic acid expression level has no implication. Our result is in line with the idea on multivalent bindings proposed (Sauter et al., 1989, 1992). Further evidence was obtained from a virus-binding simulation study, showing a positive correlation between sialic acid clustering and IAV mobility (Sieben et al., 2020). Our current study advances previous understanding on virus-glycan interaction by demonstrating the importance of sialic acid cluster size, but not sialic acid density within cluster or sialic acid expression level could influence IAV binding on respiratory epithelial cells. Therefore, the determining factor for influenza virus-receptor binding depends on the sialic acid species, structural conformation, and sialic acid cluster size.
We have shown IFN-γ pre-treatment could change the F-actin cytoskeleton (Figure 6B), which concurs with the findings of other studies (Paul et al., 2012). It has been shown that IFN-γ can shorten actin filament by GTPase guanylate-binding protein 1 (GBP-1) induction (Ostler et al., 2014). Inducing actin polymerization by jasplakinolide not only restores the morphology of linear F-actin filament but also the sialic acid cluster size (Figures 6B and 6D). Therefore, our results suggest that the inhibitory effect of IFN-γ on sialic acid clustering is mediated by actin depolymerization.
Although jasplakinolide treatment completely reverted the inhibitory effect of IFN-γ on α-2,6-linked siliac acid cluster size, IAV attachment and replication were not completely recovered (Figures 6C and 6A). There are several possibilities. First, IAV infection involves sialic acid for binding and EGFR activation for entry (Eierhoff et al., 2010). It has been shown that IFN-γ inhibited EGFR tyrosine phosphorylation (Paul et al., 2012), which could inhibit IAV entry and infection (Eierhoff et al., 2010). Second, different types of actin filament assembly can affect the cytoskeleton structure (Suarez and Kovar, 2016). For example, human actin-related protein 2/3 (Arp2/3) protein complex induces the branching of F-actin network. This protein complex is composed of seven subunits, ARP2, ARP3, ARPC1, ARPC2, ARPC3, ARPC4, and ARPC5 (Goley and Welch, 2006). It has been shown that IFN-γ pre-treated A549 cells have lower ARPC2 and ARPC1A mRNA expression levels when compared to the untreated cells (Sanda et al., 2006). Our confocal microscopy analysis suggests that although jasplakinolide restores the linear filaments of actin, the morphology of the actin cytoskeleton was still different from the IFN-γ untreated cells (Figure 6B). Therefore, inducing actin polymerization by jasplakinoline may not be sufficient to reconstruct the complex organization of actin cytoskeleton back to its native form and affect IAV binding in current study. Third, IFN-γ can also affect other components that are related to the structure of cell membrane, including cholesterol homeostasis (Zhou et al., 2020) and transmembrane proteins such as occludin, JAM-A, and claudin-1 (Utech et al., 2005). Depleting cholesterol with methyl-β-cyclodextrin (MCD) reduces influenza infection (Eierhoff et al., 2010). As jasplakinolide has no effect on cholesterol, disorganized membrane cholesterol may have contributed to the partial reversal of IAV binding and infection.
Our study reveals a mechanism of IFN-associated antiviral activity. The increasing knowledge on the IFN family has now demonstrated a wide range of overlapping, or complementary antiviral mechanisms from different IFNs to combat virus evasion (Hale et al., 2010; Garcia-Sastre, 2017). Further understanding of HA-glycan interactions and how the immune system (e.g. IFN-γ) regulates their interactions will advance the design of IAV binding/entry inhibitor.
Limitations of the study
There are limitations in this study. First, in addition to actin, IFN-γ may cause reprogramming of cholesterol (Zhou et al., 2020), which may influence sialic acid cluster size and arrangement. Second, in addition to sialic acid, EGFR signaling also play a role in IAV entry (Eierhoff et al., 2010); therefore, the correlation of sialic acid cluster size, EGFR distribution, and its signaling on IAV binding requires further investigation.
STAR★Methods
Key resources table
| REAGENT or RESOURCE | SOURCE | IDENTIFIER |
|---|---|---|
| Antibodies | ||
| Anti-influenza A antibody, nucleoprotein, clone A1 | Millipore, Darmstadt, Germany | CAT#MAB8257; RRID: AB_95231 |
| Influenza A H1N1 (Swine Flu 2009) Hemagglutinin/ HA antibody, rabbit Mab | Sino Biological, Wayne, USA | Cat#11055; RRID:AB_1960261 |
| Goat anti-mouse IgG (H+L) Alexa Fluor 633 | Thermofisher Scientific, MA, United States | Cat#A21050; RRID:AB_2535718 |
| PE Goat Donkey anti-rabbit IgG, clone Poly4064 | Biolegend, San Diego USA | Cat#406421; RRID:AB_2563484 |
| Alexa Fluor 488 mouse IgG1, clone MOPC-21 | Biolegend, San Diego USA | Cat#400129; RRID:AB_400129 |
| Alexa Fluor(R) 488 anti-human EGFR antibody | Biolegend, San Diego USA | Cat# 352908; RRID:AB_11126165 |
| Influenza A H3N2 (A/Brisbane/10/2007) Hemagglutinin / HA Antibody, Rabbit MAb | Sino Biological, Wayne, USA | Cat# 11056-R006; RRID: AB_2860296 |
| Rabbit IgG Isotype Control antibody | Thermofisher Scientific, MA, United States | Cat# 31235;RRID:AB_243593 |
| Mouse IgG2a kappa Isotype Control (eBM2a) | Thermofisher Scientific, MA, USA | Cat# 14-4724-82; RRID: AB_470114 |
| Bacterial and virus strains | ||
| A/Hong Kong/415742/2009(H1)pdm09 | In house | N/A |
| A/Hong Kong/417610/2018 (H3N2) | In house | N/A |
| A/Vietnam/1194/2004 (H5N1) | In house | N/A |
| Chemicals, peptides, and recombinant proteins | ||
| Trypsin from bovine pancreas, TPCK Treated | Merck, Darmstadt, Germany | Cat# T1426 |
| UltraPure™ Low Melting Point Agarose | Thermofisher Scientific, MA, USA | Cat# 16520050 |
| Recombinant human interferon gamma 1-b (IMMUKIN) | Boehringer Ingelheim, Berkshire, UK | N/A |
| Biotin Conjugated Maackia amurensis Lectin -MAA | EY Lab, San Mateo, USA | Cat# BA-7801-5 |
| Biotin Conjugated Sambucus nigra (Elderberry Bark) -SNA-I | EY Lab, San Mateo, USA | Cat# BA-6802-1 |
| Dulbecco’s modified eagle’s medium nutrient mix F-12 (DMEM F-12) | Thermofisher Scientific, MA, USA | Cat# 11320082 |
| Eagle’s Minimum Essential Medium (MEM) | Thermofisher Scientific, MA, USA | Cat#11095080 |
| Penicillin-Streptomycin (10,000 U/mL) | Thermofisher Scientific, MA, USA | Cat#15140122 |
| HEPES | Thermofisher Scientific, MA, USA | Cat#15630080 |
| PBS | Thermofisher Scientific, MA, USA | Cat#15630080 |
| MEM (Temin's modification) (2X), no phenol red | Thermofisher Scientific, MA, USA | Cat#11935046 |
| TritonTM X-100 | Thermofisher Scientific, MA, USA | Cat#11332481001 |
| ProlongTM Diamond Antifade with DAPI | Thermofisher Scientific, MA, USA | Cat#P36962 |
| UltraPure™ 0.5 M EDTA, pH 8.0 | Thermofisher Scientific, MA, USA | Cat#15575020 |
| Zombie VioletTM Fixable Viability Kit | Biolegend, San Diego, United States | Cat#423114 |
| Alexa FluorTM 488 Phalloidin | Thermofisher Scientific, MA, USA | Cat#A12379 |
| Propidium Iodide | Thermofisher Scientific, MA, USA | Cat#P3566 |
| 0.05% Trypsin EDTA | Thermofisher Scientific, MA, USA | Cat#25300-054 |
| APC Streptavidin | Biolegend, San Diego USA | Cat# 405207 |
| Streptavidin, Alexa Fluor™ 647 conjugate | Thermofisher Scientific, MA, USA | Cat# S32357 |
| Jasplakinolide | Thermofisher Scientific, MA, USA | Cat#J7473 |
| DMSO | Sigma | Cat#D2650 |
| SYBR Premix Ex Taq (Tli RNaseH Plus) | Takara | CAT# RR420A |
| Crystal Violet | Sigma | CAT#C0775 |
| Fetal bovine serum | ThermoFisher Scientific | Cat# 16140071 |
| Bovine serum albumin Fraction V | Roche | Cat# 03116964001 |
| Pierce™ 16% Formaldehyde (w/v), methanol free | ThermoFisher Scientific | Cat# 28908 |
| Glucose | Sigma | G8270 |
| Tris-HCL | Sigma | T3038 |
| NaCl | Sigma | S9888 |
| Cyclooctatetrane | Sigma | 138924 |
| beta-mercaptoethanol | Sigma | M6250 |
| Glucose oxidase | Sigma | G0543 |
| Catalase from Aspergillus niger | Sigma | C3515 |
| Critical commercial assays | ||
| QIAamp Viral RNA Mini Kit | Qiagen | CAT#52906 |
| RNeasy Mini Kit | Qiagen | CAT#74106 |
| D3 Ultra 8 DFA respiratory virus screening and identification kit | Quidel | N/A |
| CyQUANT™ MTT Cell Viability Assay | Thermofisher Scientific, MA, USA | Cat#V13154 |
| AgPath-ID one-step RT-PCR | Life Technologies Limited | CAT#4387424 |
| Experimental models: Cell lines | ||
| A549 | CCL-185 | N/A |
| Calu3 | HTB-55 | N/A |
| MDCK | CCL-34 | N/A |
| Oligonucleotides | ||
| TNF Forward 5' CAAGGACAGCAGAG GACCAG 3' |
Integrated DNA Technologies | N/A |
| TNF Reverse 5'TGGCGTCTGAGGG TTGTTTT3' |
Integrated DNA Technologies | N/A |
| CXCL10 Forward 5'AGCAGAGGAA CCTCCAGTCT 3' |
Integrated DNA Technologies | N/A |
| CXCL10 Reverse 5'ATGCAGGTACAG CGTACAGT 3' |
Integrated DNA Technologies | N/A |
| IL-10 Forward 5' AACTGAGACATCA GGGTGGC3' |
Integrated DNA Technologies | N/A |
| IL-10 Reverse 5'AAGGTTTCTCAAGG GGCTGG 3' |
Integrated DNA Technologies | N/A |
| IL-6 Forward 5' GGCTGCAGGACA TGACAACT 3' |
Integrated DNA Technologies | N/A |
| IL-6 Reverse 5' ATCTGAGGTGCC CATGCTAC 3' |
Integrated DNA Technologies | N/A |
| GAPDH Forward 5' ATTCCACCCATGGCA AATTC 3' |
Integrated DNA Technologies | N/A |
| GAPDH Reverse 5'CGCTCCTGGAAGAT GGTGAT3' |
Integrated DNA Technologies | N/A |
| CCL2 Forward 5' GCTCATAGCAGCCAC CTTCATTC3' |
Integrated DNA Technologies | N/A |
| CCL2 Reverse 5'GGACACTTGCTGCTG GTGATTC 3' |
Integrated DNA Technologies | N/A |
| IFNB1 Forward 5'GCCGCATTGACCATCT 3' | Integrated DNA Technologies | N/A |
| IFNB1 Reverse 5' CACAGTGACTGTACT CCT 3' |
Integrated DNA Technologies | N/A |
| IFNL1 Forward 5' CGCCTTGGAAGAGTC ACTCA 3' |
Integrated DNA Technologies | N/A |
| IFNL1 Reverse 5' GAAGCCTCAGGTCC CAATTC 3' |
Integrated DNA Technologies | N/A |
| IFNL2/3 Forward 5'AGTTCCGGGCCTG TATCCAG3' |
Integrated DNA Technologies | N/A |
| IFNL2/3 5'GAGCCGGTACAGCCAATGGT3' | Integrated DNA Technologies | N/A |
| InfA-Forward 5’- GACCRATCCTGTCAC CTCTGAC -3’ |
Integrated DNA Technologies | N/A |
| InfA-Reverse 5’- AGGGCATTYTGGACAAA KCGTCTA -3 |
Integrated DNA Technologies | N/A |
| InfA Probe5’ FAM- TGCAGTCCTCGCTC ACTGGGCACG -BHQ1 3’ |
Integrated DNA Technologies | N/A |
| Software and algorithms | ||
| Zen digital imaging for light microscopy | Zeiss | http://www.zeiss.com/microscopy/en_us/products/microscope-software/zen.html#introduction, RRID:SCR_013672 |
| Fiji | ImageJ | http://fiji.sc, SCR_002285 |
| FlowJo_V10 | BD | https://www.flowjo.com/solutions/flowjo, SCR_008520 |
| GrapgPad Prism 9 | GraphPad | http://www.graphpad.com/, SCR_00279 |
| Other | ||
| 2-2.4 μm polystyrene beads | Spherotech, Lake Forest, USA | CAT# PP-20-10 |
| circle coverslip, 13 mm diameter | Thermofisher Scientific, MA, United States | CAT# CBAD00130RA1 |
| Coverslip 18 mm, 0.13mm | Marienfeld Superior, Lauda-Königshofen, Germany | CAT# 111580 |
Resource availability
Lead contact
Further information and requests for resources and reagents should be directed to and will be fulfilled by the lead contact, Kelvin Kai-Wang To (kelvinto@hku.hk).
Materials availability
This study did not generate new unique reagents.
Experimental model and subject details
All cells were obtained from American Type Culture Collection (ATCC, Rockville, MD) and tissue culture reagents were obtained from Gibco (Gibco, Grand Island, NY, United States). A549 cells, CCL-185 and Calu3, HTB-55 were maintained in completed Dulbecco’s modified eagle’s medium nutrient mix F-12 (DMEM F-12). MDCK cells, CCL-34 were maintained in completed Eagle’s Minimum Essential Medium (MEM). All completed mediums were supplimented with 10% fetal bovine serum (FBS), penicillin (100 U/mL), streptomycin (100 μg/mL) and 25 μM 4-(2-hydroxyethyl)-1-piperazineethanesulfonic acid (HEPES). All cell lines were cultured at 37°C, 5% carbon dioxide (CO2). Calu3 and A549 cells have been authenticated by short tandem repeat (STR) profiling (Pangenia Lifesciences Limited). All cell lines were tested negative for mycoplasma contamination (The Centre for PanorOmic Sciences of the LKS Faculty of Medicine, the University of Hong Kong).
Method details
3-(4,5-Dimethylthiazol-2-yl)-2,5-Diphenyltetrazolium bromide (MTT) assay
3 × 10⁴ cells pre-treated with IFN-γ at indicated concentration at 37°C, 5% CO2. After 24 h, cells were washed twice with phosphate buffered saline (PBS) and resuspend cells in 90 μL of completed DMEM-F12. 10 μL of 12 mM MTT solution (Thermofisher Scientific, MA, USA) was added to each well. Incubate cells at 37°C, 5% CO2 for 4 h and added 100 μL of of SDS-HCL solution. Incubate cells for 18 h and read absorbance at OD570 nm.
IFN-γ, jasplakinolide treatment
For 24 h IFN-γ pre-treatment, 1 × 10⁵ A549 or Calu3 cells were seeded in 24 well plates in completed DMEM F-12 (Day 1) and cultured at 37°C, 5% CO2. After 24 h, completed DMEM F-12 medium was removed and cells were washed once with 1 mL PBS and replaced with serum free DMEM F-12 medium with or without Immukin, recombinant human interferon-gamma 1-b (IFN-γ1-b) (Boehringer Ingelheim, Berkshire, UK) at indicated concentrations (Day 2) to culture at 37°C, 5% CO2. After 24 h, cells were ready for experiment (Day 3). Immukin (IFN-γ1-b) used is referred as IFN-γ. For experiment with jasplakinolide treatment, IFN-γ was removed and washed twice with PBS. Jasplakinolide at indicated concentrations were added in 300 μL in plain DMEM-F12. Cells were incubated for 30 min (mins) at 37°C, 5% CO2 and followed by two washes with PBS.
Viruses propagation and cell infection
The IAV strains used in current study included A/Hong Kong/415742/2009(H1N1) (Yuan et al., 2019), A/Hong Kong/417610/2018 (H3N2) (Chen et al., 2019), A/Vietnam/1194/2004 (H5N1) (Zhao et al., 2018). IAV were propagated in MDCK cells in serum free MEM containing penicillin (100 U/mL), streptomycin (100 μg/mL) and 25 μM HEPES. For H1N1 and H3N2, culture medium was supplemented with 1 μg/mL trypsin from bovine pancreas, TPCK treated (Merck, Darmstadt, Germany). Infectious culture supernatant was collected after 24–36 h and titer was determined by plaque assay. For cell infection, cells were infected at indicated MOI in 200 μL of of virus. Cells were incubated at 37°C, 5% CO2 for 1 h. After the inoculum was removed, the cells were washed with 1 mL PBS once and replaced in serum free culture medium. Culture supernatant was collected after 24 h.
Plaque assay
Plaque assays were performed to determine titers of the virus stocks and infectious culture supernatant samples (Zhou et al., 2018; Chu et al., 2021). 1 × 10⁵ MDCK cells were seeded in 24-well plates. Confluent monolayers were inoculated with 175 μL of 10-fold serial dilutions of virus samples and incubated for 1 h at 37°C, 5% CO2. After the inoculum was removed, the cells were washed with PBS three times and overlaid with 1% ultraPure™ Low Melting Point Agarose (Thermofisher Scientific, MA, USA) in MEM, penicillin (100 U/mL), streptomycin (100 μg/mL). For H1N1 and H3N2, medium was supplemented with MEM and 1 μg/mL TPCK-treated trypsin (Merck, Darmstadt, Germany) and further incubated at 37°C, 5% CO2 for 72 h. The monolayers were fixed with 10% formaldehyde overnight at room temperature (RT). All fixed samples were then stained with 0.5% crystal violet in 25% ethanol/distilled water for 10 min for plaque visualization. Virus titers were calculated as plaque-forming units (PFU) per mL.
Time of addition study
A549 cells were infected with A/Hong Kong/415742/2009(H1N1) at MOI of 0.01 under three IFN-γ conditions: (i) Pre-exposure to cells; A549 cells were pre-treated with 0, 25 international unit (IU)/mL IFN-γ for 1 or 24 h (ii) Virus adsorption; 0, 25 IU/mL of IFN-γ were added to A549 cells at 0 h together with the viruses. For conditions (i) and (ii), cells were infected and incubated at 37°C, 5% CO2. After 1 h of infection, viruses were removed, cells were washed once with serum free DMEM F-12 and 0.5 mL of serum free DMEM F-12, 0.25 μg/mL TPCK-treated trypsin were added. (iii) Virus replication; cells were infected with viruses at 37°C, 5% CO2. After 1 h, viruses were removed, cells were washed once with serum free DMEM F-12 and 0.5 mL of serum free DMEM F-12 medium, 0.25 μg/mL TPCK-treated trypsin with or without 25 IU/mL of IFN-γ were added. For all three conditions, culture supernatant was collected at 24 h.p.i, and the antiviral activity was determined by plaque assay.
Cell-cell viral transmission assay
1 × 10⁴ A549 cells were first infected with A/Hong Kong/415742/2009(H1N1) at indicated MOI for 1 h at 37°C, 5% CO2. After 1 h, infected cells were washed with 1 mL PBS twice and 0, 100, 400 IU/mL IFN-γ pre-treated, un-infected A549 (5 × 10⁴) were added. Cells were co-cultured at 37°C, 5% CO2. After 24 h, cells were washed with 1 mL PBS for three times and fixed with 200 μL of 2% formaldehyde (Thermofisher Scientific, MA, United States) at RT for 1 h with orbital shaking. Cells were then permeabilized with 200 μL 0.1% Triton™ X-100 (Merck, Darmstadt, Germany). After 15 min of incubation at RT with orbital shaking, cells were blocked with 5% bovine serum albumin (BSA) in PBS for 1 h at RT. After blocking, cells were stained with 200 μL of 5 μg/mL anti-influenza A antibody, nucleoprotein, clone A1 or mouse IgG2a isotype control (Thermofisher Scientific, MA, United States) in 1% BSA in PBS for 1 h, with orbital shaking. Cells were then washed three times with 1 mL PBS. After wash, 200 μL of 4 μg/mL of goat anti-mouse IgG-AF633 and 0.3 μM Alexa Fluor™ 488 Phalloidin in 1% BSA in PBS were added to the cells for 45 min incubation at RT, with orbital shaking. Cells were washed three times with 1 mL PBS and mounted with Prolong™ Diamond Antifade with DAPI (Thermofisher Scientific, MA, United States). Samples were incubated in the dark at RT for 24 h before confocal analysis with Carl Zeiss LSM 880 (Zeiss, Jena, Germany). Confocal images were analysed with ZEISS ZEN Microscope software, Blue Edition (Zeiss, Jena, Germany).
Immunofluorescence assay
Immunofluorescence assay for viral protein expression was performed as instructed by the manufacturer. A549 cells were transferred into Teflon printed diagnostic slide and air-dried. Cells were then fixed in chilled acetone at −20°C for 10 min and stained with influenza A DFA Reagent, D3® Ultra 8TM DFA Respiratory Virus Screening and Identification Kit (Diagnostic Hybrids, Inc. Quidel, United States) following the manufacturer’s instructions and examined under epifluorescent illumination of an Eurostar III plus fluorescence microscope (EUROIMMUN AG, Lübeck, Germany).
Receptor analysis by fluorescene-activated ell sorting (FACS)
Unless stated, otherwise all reagents used were ice cold and samples were kept on ice at all time. 1 × 10⁶ A549 or Calu3 cells were blocked with 5% BSA, PBS on ice. After 30 min, cells were stained with either 50 μg/mL biotin conjugated Sambucus nigra (Elderberry Bark) -SNA-I (EY Lab, San Mateo, USA), or 50 μg/mL biotin conjugated Maackia amurensis Lectin –MAA (EY Lab, San Mateo, USA) or 0.25 μg of Alexa Fluor 488 mouse anti-human EGFR antibody, clone AY13 (Biolegend, San Diego United States), or 0.25 μg Alexa Fluor 488 mouse Ig gamma −1 (IgG1), clone MOPC-21 (Biolegend, San Diego United States) in 50 μL ice cold 1% BSA in PBS. Cells were incubated on ice for 1 h and washed three times with 2% BSA in PBS. After washing, 4 μg/mL allophycocyanin (APC) streptavidin (Biolegend, San Diego United States) were added to sample stained with biotin-MAA and biotin-SNA I. After 30 min of staining, cells were washed twice with 2% BSA in PBS and resuspended in 400 μL of 2% BSA in PBS containing 0.3 μg/mL propidium iodide (PI) for flow cytometry analysis. All samples were analysed with BD LSRFortessaTM Flow Cytometer (Becton, Dickinson and Company, Frankin Lakes, United States). All data were analzed with Flowjo software, version 10 (Becton, Dickinson and Company, Frankin Lakes, United States).
Sialic acids and F-actin analysis confocal imaging
5 × 10⁴ A549 cells were seeded on 13 mm diameter sterilized circle coverslip (Thermofisher Scientific, MA, United States) and placed in 24 well plate with completed DMEM F-12. After 24 h of IFN-γ pre-treatment at 37°C, 5% CO2, the cells were washed with 1 mL ice cold PBS and blocked with 0.5 mL of 5% BSA in PBS on ice with orbital shaking. After 1 h, A549 cells were stained with 50 μg/mL biotin conjugated SNA I, or biotin conjugated MAA in 200 μL of ice cold 1% BSA in PBS on ice with orbital shaking. After 1 h, cells were washed three times with 1 mL of 1% BSA in PBS and stained with 200 μL of 4 μg/mL APC Streptavidin (Biolegend, San Diego United States) on ice with orbital shaking. After 30 min, cells were washed three times with 1 mL PBS and fixed with 200 μL of 2% formaldehyde (Thermofisher Scientific, MA, United States) at RT. After 1 h, cells were permeabilized with 200 μL of 0.1% Triton™ X-100 (Merck, Darmstadt, Germany) for 15 min at RT. Cells were washed once with 1 mL PBS and blocked with 200 μL of 5% BSA in PBS at RT with orbital shaking. After 1 h, cells were stained with 200 μL of 0.3 μM Alexa Fluor™ 488 Phalloidin (Thermofisher, Scientific, MA, United States) in 1% BSA in PBS at RT with orbital shaking. After 60 min, cells were washed three times with 1 mL PBS and mounted with Prolong™ Diamond Antifade with DAPI. Samples were incubated in the dark at RT for 24 h prior confocal analysis with Carl Zeiss LSM 710. Confocal images were analysed with ZEISS ZEN Microscope software, Blue Edition.
Virus attachment assay (FACS)
Unless stated, otherwise all reagents were ice cold and samples were kept on ice at all time. 2 × 10⁵ cells were washed with 1 mL of PBS once and pre-chilled on ice for 15 min. After chilling, cells were inoculated with H1N1, H3N2, H5N1 (MOI = 5) in plain DMEM F-12 and incubated on ice. After 1 h, cells infected with H5N1 were washed three times with PBS and lysed with RLT buffer for RT-qPCR for M gene detection. With cells infected with H1N1 and H3N2, cells were washed three times with 1 mL 2% BSA and blocked with 2% BSA in PBS on ice for 1 h. Cells were then stained with 1 μL of Zombie Violet (Biolegend, San Diego, United States) in 50 μL of 1% BSA in PBS. After 30 min of incubation on ice, cells were washed with 1 mL 2% BSA in PBS three times and stained with 1 μg of Influenza A H1N1 (Swine Flu, 2009) HA antibody, rabbit monoclonal antibody (SinoBiological, Wayne, United States), or 0.5 μg Influenza A H3N2 (A/Brisbane/10/2007) Hemagglutinin/HA Antibody, rabbit monoclonal antibody or rabbit IgG isotype control in 50 μL of 2% BSA, PBS and incubated on ice for 1 h. Cells were washed with 2% BSA in PBS three times and stained with 50 μL of 0.2 μg/mL goat anti-rabbit IgG-PE, clone Poly4064 (Biolegend, San Diego United States) in 2% BSA in PBS. Cells were incubated on ice for 1 h and followed by three washings with 1 mL PBS. Cells were fixed with 200 μL of 2% formaldehyde, PBS and incubated at RT. After 1 h of fixing, cells were washed once with 2% BSA in PBS, resuspended in 2% BSA in PBS and is ready for FACS analysis with BD LSRFortessa™ Flow Cytometer. Data were analysed with Flowjo software, version 10.
Virus attachment assay (confocal imaging)
5 × 10⁴ A549 cells were seeded on steriled 13 mm diameter circle coverslip (Thermofisher Scientific, MA, United States), and placed in 24 well plate with completed DMEM F-12, incubated at 37°C, 5% CO2. After 24 h of IFN-γ pre-treatment, cells were washed once with 1 mL of ice cold PBS and pre-chilled on ice for 15 min. After cell chilling, cells were inoculated with A/Hong Kong/415742/2009(H1N1) (MOI 50) in 200 μL ice cold plain DMEM F-12 and kept on ice with gentle orbital shaking. After 1 h of virus inoculation, cells were washed with 1 mL PBS three times and fixed with 200 μL of 2% formaldehyde for 1 h at RT, with orbital shaking. Cells were then permeabilized with 200 μL 0.1% Triton™ X-100 at RT for 15 min, with orbital shaking. Cells were washed once with 1 mL PBS and blocked with 300 μL 2% BSA in PBS for 60 min at RT, with orbital shaking. Cells were stained with 200 μL 5 μg/mL anti-influenza A antibody, nucleoprotein, clone A1 or mouse IgG2a isotype control (Thermofisher Scientific, MA, United States) in 1% BSA in PBS. After 1 h of incubation with orbital shaking, cells were washed three times with 1 mL PBS and stained with 200 μL of 4 μg/mL of goat anti-mouse IgG AF633 in 1% BSA in PBS. Cells were incubated for 45 min at RT, with orbital shaking. After washings three times with 1 mL PBS, cells were stained with 200 μL of 0.3 μM Alexa Fluor™ 488 Phalloidin in 1% BSA in PBS for 60 min at RT, with orbital shaking. Cells were then washed three times with 1 mL of PBS and mounted with Prolong™ Diamond Antifade with DAPI. Samples were incubated in the dark at RT for 24 h and samples were ready for confocal analysis with Carl Zeiss LSM 710. Confocal images were analysed with ZEISS ZEN Microscope software, Blue Edition.
dSTORM; pre-coating coverslide with polystyrene beads for drift control
Coverslip with thickness of 0.13 mm, circular diameter of 18 mm (Marienfeld Superior, Lauda-Königshofen, Germany) were cleaned with 70% ethanol and then placed on Cimarec + ™ Hotplate (Thermofisher Scientific, MA, United States) pre-set at 120°C. 100 μL of 2.0–2.4 μm polystyrene beads (Spherotech, Lake Forest, United States) in 50% ethanol were loaded onto each coverslip. Coverslips were heated at 120°C for 10 min and transferred to a storage dishes for experiment.
dSTORM; cell sample preparation
Coverslips pre-coated with polystyrene beads were sterilzed by exposing under UV light for 30 min in a biosafety cabinet. After UV sterilization, coverslips were placed in 12 well and 5 × 10⁴ cells were cultured on the coverslip in completed DMEM/F12.
dSTORM; sample staining
Cells were washed once with 2 mL 1% BSA in PBS and fixed with 300 μL of 4% formaldehyde at RT for 40 min (Chen et al., 2015). After fixing, cells were washed once with 1 mL, 1% BSA in PBS and then blocked with 5% BSA in PBS for 60 min. Cells were washed once with 1 mL, 1% BSA in PBS and stained with 300 μL of 50 μg/mL biotin conjugated SNA I or biotin conjugated MAA in 1% BSA in PBS, followed by incubation at RT with orbital shaking. After 1 h, cells were washed three times with 2 mL of 1% BSA in PBS and stained with 300 μL of 4 μg/mL Streptavidin, Alexa Fluor™ 647 conjugate (Thermofisher Scientific, MA, United States) with orbital shaking. After 30 min, cells were washed three times with 2 mL PBS and fixed with 300 μL of 2% formaldehyde for 20 min.
dSTORM imaging
dSTORM imaging was performed on Nikon inverted Eclipse Ti-E with a 100 × 1.49 N.A TIRF lens (Nikon, Tokyo, Japan), an objective TIRF illumination. The samples were imaged in freshly prepared buffer containing 10% glucose (Sigma, St. Louis, United States), 50 mM Tris-HCL pH8.0 (Sigma, St. Louis, United States), 10 mM NaCl (Sigma, St. Louis, United States), 2 mM cyclooctatetraene (Sigma, St. Louis, United States), 143 mM beta-mercaptoethanol (Sigma, St. Louis, United States), 0.65 mg/mL glucose oxidase (Sigma, St. Louis, United States) and 0.04 mg/mL catalase from Aspergillus niger (Sigma, St. Louis, United States). The coverslip that containing the seeded cells was sealed onto a microscopic depression slide (Sail Brand, China) using nail polish. The images were captured with excitation of a 640 nm laser with using an excitation filter (ZET532/647x, Chroma), a dichroic mirror (T760LPXR-UF2, Chroma) and an emission filter set (FF01-692/40–25, 25 mm, Semrock, NY, United States). Camera model, iXon Ultra 897 EMCCD (Andor Technology, Belfast, UK). A time series of 10,000 or 20,000 frames per cell was recorded for α-2,3-linked sialic acid and α-2,6-linked sialic acid. During the acquisition time, focus lock for x-y drift was applied with polystyrene beads pre-coated on the coverslip.
RNA isolation and reverse transcription quantitative polymerase chain reaction (RT-qPCR)
Total RNA was extracted from cells using Qiagen RNeasy Mini Kit according to manufacturer's instructions (Qiagen, Hilden, Germany). 200 ng of total RNA was reversed transcribed using PrimeScript RT Master Mix (Perfect Real Time) (Takara, Mountain View, United States). Quantitative PCR analysis was performed using Sybr®Premix Ex Taq (Takara, Mountain View, United States) with equal amount of cDNA and 0.3 μM each of forward and reverse primers. Primer sequences are listed in STAR Methods and cycling profiles are as follow. Cycling condition for glyceraldehyde-3-phosphate dehydrogenase (GAPDH), CXCL10, CCL2; pre-incubation: 95°C 30 s, amplification: 95°C 5 s, 60°C 30 s (45 cycles), melting: 95°C 5 s, 60°C 60 s, 95°C 1 s, cooling: 50°C 30 s. For TNF, IL-6, IFNB1, IFNL1, IFNL2/3; pre-incubation: 95°C 30 s, amplification: 95°C 5 s, 60°C 30 s, 82°C 2 s (40 cycles), melting: 95°C 5 s, 60°C 60 s, 95°C 1 s, cooling: 50°C 30 s. Samples were analysed with LightCycler®96 system (Roche, Basel, Switzerland). The present of the correct amplicons was verified by melt curve analysis. The cycle threshold were determined, normalized to levels of a constitutive housekeeping gene; GAPDH and used to obtain the relative levels of genes of interest using the 2-ΔCt method.
Viral RNA isolation and qRT-PCR for M gene
140 μL of culture supernatant was collected and viral RNA was extracted using QIAamp Viral RNA Mini Kit (Qiagen, Hilden, Germany) according to the manufacturer's instructions. RT-qPCR was performed with AgPath-ID one-step RT-PCR (Thermofisher Scientific, MA, United States) according to the manufacturer's instructions with the InfA primers designed for M gene. Cycling profile is as follow; 50°C for 30 min, 1 cycle; 95°C for 2 min; 95°C for 15 s and 55°C for 30 s, 50 cycles. Samples were analysed with LightCycler®96 system (Roche). Absolute copy number was calculated from standard curves.
Quantification and statistical analysis
All data are representative or mean of 2-4 independent experiments. Statistical significance was determined using unpaired T tests or multiple T tests in GraphPad Prism 9 software. ns – not significant, ∗p ≤ 0.05, ∗∗p ≤ 0.01, ∗∗∗p ≤ 0.001, ∗∗∗∗p ≤ 0.0001. p < 0.05 was considered statistically significant. Data are represented as mean ± SEM Error bar indicates SEM.
Acknowledgments
We acknowledge the Center for PanorOmic Sciences (CPOS) of the LKS Faculty of Medicine, the University of Hong Kong, for providing confocal imaging and direct stochastic optical reconstruction microscopy support. We also acknowledge Ms. Queenie Fok for her technical assistance. This work was supported the donations of Richard Yu and Carol Yu, May Tam Mak Mei Yin, the Shaw Foundation Hong Kong, Michael Seak-Kan Tong, Respiratory Viral Research Foundation Limited, Hong Kong, Hui Ming, Hui Hoy and Chow Sin Lan Charity Fund Limited, Hong Kong, Chan Yin Chuen Memorial Charitable Foundation, Hong Kong, Marina Man-Wai Lee, the Jessie & George Ho Charitable Foundation, Hong Kong, Kai Chong Tong, and Tse Kam Ming Laurence.
Author contributions
Conceptualization, C.H.Y.F. and K.K.W.T.; Methodology, C.H.Y.F. and K.K.W.T.; Validation, C.H.Y.F., L.L,. and L.L.C.; Formal Analysis, C.H.Y.F., K.K.W.T., L.L., and L.L.C.; Investigation, C.H.Y.F., L.L., and L.L.C.; Resources, K.K.W.T. and K.Y.Y.; Writing – Original Draft, C.H.Y.F. and K.K.W.T., Writing – Review & Editing, C.H.Y.F., K.K.W.T., K.Y.Y., M.L.Y., A.J.Z., H.Z., L.L., and L.L.C.; Visualization, C.H.Y.F. and K.K.W.T.; Supervision, C.H.Y.F. and K.K.W.T.; Project Administration, C.H.Y.F. and K.K.W.T.; Funding Acquisition, K.K.W.T. and K.Y.Y.
Declaration of interests
All authors declare no conflict of interest.
Published: April 15, 2022
Footnotes
Supplemental information can be found online at https://doi.org/10.1016/j.isci.2022.104037.
Contributor Information
Carol Ho-Yan Fong, Email: chyfong@hku.hk.
Kelvin Kai-Wang To, Email: kelvinto@hku.hk.
Supplemental information
Data and code availability
All data reported in this paper will be shared by the lead contact upon request.
This paper does not report original code
Any additional information required to reanalyze the data reported in this paper is available from the lead contact upon request.
References
- Berri F., Haffar G., Le V.B., Sadewasser A., Paki K., Lina B., Wolff T., Riteau B. Annexin V incorporated into influenza virus particles inhibits gamma interferon signaling and promotes viral replication. J. Virol. 2014;88:11215–11228. doi: 10.1128/JVI.01405-14. [DOI] [PMC free article] [PubMed] [Google Scholar]
- Bian J.R., Nie W., Zang Y.S., Fang Z., Xiu Q.Y., Xu X.X. Clinical aspects and cytokine response in adults with seasonal influenza infection. Int. J. Clin. Exp. Med. 2014;7:5593–5602. [PMC free article] [PubMed] [Google Scholar]
- Bot A., Bot S., Bona C.A. Protective role of gamma interferon during the recall response to influenza virus. J. Virol. 1998;72:6637–6645. doi: 10.1128/jvi.72.8.6637-6645.1998. [DOI] [PMC free article] [PubMed] [Google Scholar]
- Brass A.L., Huang I.C., Benita Y., John S.P., Krishnan M.N., Feeley E.M., Ryan B.J., Weyer J.L., Van Der Weyden L., Fikrig E., et al. The IFITM proteins mediate cellular resistance to influenza A H1N1 virus, West Nile virus, and dengue virus. Cell. 2009;139:1243–1254. doi: 10.1016/j.cell.2009.12.017. [DOI] [PMC free article] [PubMed] [Google Scholar]
- Bubb M.R., Senderowicz A.M., Sausville E.A., Duncan K.L., Korn E.D. Jasplakinolide, a cytotoxic natural product, induces actin polymerization and competitively inhibits the binding of phalloidin to F-actin. J. Biol. Chem. 1994;269:14869–14871. [PubMed] [Google Scholar]
- Bubb M.R., Spector I., Beyer B.B., Fosen K.M. Effects of jasplakinolide on the kinetics of actin polymerization. An explanation for certain in vivo observations. J. Biol. Chem. 2000;275:5163–5170. doi: 10.1074/jbc.275.7.5163. [DOI] [PubMed] [Google Scholar]
- Busnadiego I., Fernbach S., Pohl M.O., Karakus U., Huber M., Trkola A., Stertz S., Hale B.G. Antiviral activity of type I, II, and III interferons counterbalances ACE2 inducibility and restricts SARS-CoV-2. mBio. 2020;11 doi: 10.1128/mBio.01928-20. e01928–20. [DOI] [PMC free article] [PubMed] [Google Scholar]
- Chan C.M., Chu H., Zhang A.J., Leung L.H., Sze K.H., Kao R.Y., Chik K.K., To K.K., Chan J.F., Chen H., et al. Hemagglutinin of influenza A virus binds specifically to cell surface nucleolin and plays a role in virus internalization. Virology. 2016;494:78–88. doi: 10.1016/j.virol.2016.04.008. [DOI] [PubMed] [Google Scholar]
- Chandrasekaran A., Srinivasan A., Raman R., Viswanathan K., Raguram S., Tumpey T.M., Sasisekharan V., Sasisekharan R. Glycan topology determines human adaptation of avian H5N1 virus hemagglutinin. Nat. Biotechnol. 2008;26:107–113. doi: 10.1038/nbt1375. [DOI] [PubMed] [Google Scholar]
- Chen J., Gao J., Wu J., Zhang M., Cai M., Xu H., Jiang J., Tian Z., Wang H. Revealing the carbohydrate pattern on a cell surface by super-resolution imaging. Nanoscale. 2015;7:3373–3380. doi: 10.1039/c4nr05970k. [DOI] [PubMed] [Google Scholar]
- Chen X., Liu S., Goraya M.U., Maarouf M., Huang S., Chen J.L. Host immune response to influenza A virus infection. Front. Immunol. 2018;9:320. doi: 10.3389/fimmu.2018.00320. [DOI] [PMC free article] [PubMed] [Google Scholar]
- Chen L.L., Wu W.L., Chan W.M., Fong C.H.Y., Ng A.C.K., Ip J.D., Lu L., Dissanayake T.K., Ding X., Cai J.P., et al. Assessment of population susceptibility to upcoming seasonal influenza epidemic strain using interepidemic emerging influenza virus strains. Epidemiol. Infect. 2019;147:e279. doi: 10.1017/S0950268819001717. [DOI] [PMC free article] [PubMed] [Google Scholar]
- Cheng V.C., To K.K., Tse H., Hung I.F., Yuen K.Y. Two years after pandemic influenza A/2009/H1N1: what have we learned? Clin. Microbiol. Rev. 2012;25:223–263. doi: 10.1128/CMR.05012-11. [DOI] [PMC free article] [PubMed] [Google Scholar]
- Chu H., Hu B., Huang X., Chai Y., Zhou D., Wang Y., Shuai H., Yang D., Hou Y., Zhang X., et al. Host and viral determinants for efficient SARS-CoV-2 infection of the human lung. Nat. Commun. 2021;12:134. doi: 10.1038/s41467-020-20457-w. [DOI] [PMC free article] [PubMed] [Google Scholar]
- Denney L., Ho L.P. The role of respiratory epithelium in host defence against influenza virus infection. Biomed. J. 2018;41:218–233. doi: 10.1016/j.bj.2018.08.004. [DOI] [PMC free article] [PubMed] [Google Scholar]
- Desai T.M., Marin M., Chin C.R., Savidis G., Brass A.L., Melikyan G.B. IFITM3 restricts influenza A virus entry by blocking the formation of fusion pores following virus-endosome hemifusion. PLoS Pathog. 2014;10:e1004048. doi: 10.1371/journal.ppat.1004048. [DOI] [PMC free article] [PubMed] [Google Scholar]
- Dhawan S., Heredia A., Wahl L.M., Epstein J.S., Meltzer M.S., Hewlett I.K. Interferon-gamma-induced downregulation of CD4 inhibits the entry of human immunodeficiency virus type-1 in primary monocytes. Pathobiology. 1995;63:93–99. doi: 10.1159/000163939. [DOI] [PubMed] [Google Scholar]
- Doherty P.C., Turner S.J., Webby R.G., Thomas P.G. Influenza and the challenge for immunology. Nat. Immunol. 2006;7:449–455. doi: 10.1038/ni1343. [DOI] [PubMed] [Google Scholar]
- Dong P., Yan Y., Zhang S., Cai M., Wang H., Chen H., Hu Y., Cui L., Zhang J., He W. γδ T Cells Provide Protective Function in Highly Pathogenic Avian H5N1 Influenza A Virus Infection. Front Immunol. 2018;4:2812. doi: 10.3389/fimmu.2018.02812. [DOI] [PMC free article] [PubMed] [Google Scholar]
- Eierhoff T., Hrincius E.R., Rescher U., Ludwig S., Ehrhardt C. The epidermal growth factor receptor (EGFR) promotes uptake of influenza A viruses (IAV) into host cells. PLoS Pathog. 2010;6:e1001099. doi: 10.1371/journal.ppat.1001099. [DOI] [PMC free article] [PubMed] [Google Scholar]
- Feeley E.M., John S.P., Chin C.R., Pertel T., Chen L.M., Gaiha G.D., Ryan B.J., Donis R.O., Elledge S.J., Brass A.L. IFITM3 inhibits influenza A virus infection by preventing cytosolic entry. PLoS Pathog. 2011;7:e1002337. doi: 10.1371/journal.ppat.1002337. [DOI] [PMC free article] [PubMed] [Google Scholar]
- Fensterl V., Chattopadhyay S., Sen G.C. No Love Lost Between Viruses and Interferons. Annu Rev Virol. 2015;2:549–572. doi: 10.1146/annurev-virology-100114-055249. [DOI] [PMC free article] [PubMed] [Google Scholar]
- Garcia-Sastre A. Ten strategies of interferon evasion by viruses. Cell Host Microbe. 2017;22:176–184. doi: 10.1016/j.chom.2017.07.012. [DOI] [PMC free article] [PubMed] [Google Scholar]
- Ge M.Q., Ho A.W.S., Tang Y., Wong K.H.S., Chua B.Y.L., Gasser S., Kemeny D.M. NK cells regulate CD8+ T cell priming and dendritic cell migration during influenza A infection by IFN-γ and perforin-dependent mechanisms. J Immunol. 2012;189(5):2099–2109. doi: 10.4049/jimmunol.1103474. [DOI] [PubMed] [Google Scholar]
- Gillespie L., Roosendahl P., Ng W.C., Brooks A.G., Reading P.C., Londrigan S.L. Endocytic function is critical for influenza A virus infection via DC-SIGN and L-SIGN. Sci. Rep. 2016;6:19428. doi: 10.1038/srep19428. [DOI] [PMC free article] [PubMed] [Google Scholar]
- Goley E.D., Welch M.D. The ARP2/3 complex: an actin nucleator comes of age. Nat. Rev. Mol. Cell Biol. 2006;7:713–726. doi: 10.1038/nrm2026. [DOI] [PubMed] [Google Scholar]
- Hale B.G., Albrecht R.A., García-Sastre A. Innate immune evasion strategies of influenza viruses. Future Microbiol. 2010;5:23–41. doi: 10.2217/fmb.09.108. [DOI] [PMC free article] [PubMed] [Google Scholar]
- Henriques R., Lelek M., Fornasiero E.F., Valtorta F., Zimmer C., Mhlanga M.M. QuickPALM: 3D real-time photoactivation nanoscopy image processing in ImageJ. Nat. Methods. 2010;7:339–340. doi: 10.1038/nmeth0510-339. [DOI] [PubMed] [Google Scholar]
- Iwasaki A., Pillai P.S. Innate immunity to influenza virus infection. Nat. Rev. Immunol. 2014;14:315–328. doi: 10.1038/nri3665. [DOI] [PMC free article] [PubMed] [Google Scholar]
- Ishikawa H., Tanaka K., Kutsukake E., Fukui T., Sasaki H., Hata A., Noda S., Matsumoto T. IFN-γ production downstream of NKT cell activation in mice infected with influenza virus enhances the cytolytic activities of both NK cells and viral antigen-specific CD8+ T cells. Virology. 2010;407:325–332. doi: 10.1016/j.virol.2010.08.030. [DOI] [PubMed] [Google Scholar]
- Iwasaki A., Foxman E.F., Molony R.D. Early local immune defences in the respiratory tract. Nat. Rev. Immunol. 2017;17:7–20. doi: 10.1038/nri.2016.117. [DOI] [PMC free article] [PubMed] [Google Scholar]
- Koutsakos M., Illing P.T., Nguyen T.H.O., Mifsud N.A., Crawford J.C., Rizzetto S., Eltahla A.A., Clemens E.B., Sant S., Chua B.Y., et al. Human CD8+ T cell cross-reactivity across influenza A, B and C viruses. Nat Immunol. 2019;20:613–625. doi: 10.1038/s41590-019-0320-6. [DOI] [PubMed] [Google Scholar]
- Li K., Markosyan R.M., Zheng Y.M., Golfetto O., Bungart B., Li M., Ding S., He Y., Liang C., Lee J.C., Cohen F.S., Liu S.L. IFITM proteins restrict viral membrane hemifusion. PLoS Pathog. 2013;9:e1003124. doi: 10.1371/journal.ppat.1003124. [DOI] [PMC free article] [PubMed] [Google Scholar]
- Nicholls J.M., Bourne A.J., Chen H., Guan Y., Peiris J.S. Sialic acid receptor detection in the human respiratory tract: evidence for widespread distribution of potential binding sites for human and avian influenza viruses. Respir. Res. 2007;8:73. doi: 10.1186/1465-9921-8-73. [DOI] [PMC free article] [PubMed] [Google Scholar]
- Ostler N., Britzen-Laurent N., Liebl A., Naschberger E., Lochnit G., Ostler M., Forster F., Kunzelmann P., Ince S., Supper V., et al. Gamma interferon-induced guanylate binding protein 1 is a novel actin cytoskeleton remodeling factor. Mol. Cell. Biol. 2014;34:196–209. doi: 10.1128/MCB.00664-13. [DOI] [PMC free article] [PubMed] [Google Scholar]
- Paul G., Marchelletta R.R., Mccole D.F., Barrett K.E. Interferon-gamma alters downstream signaling originating from epidermal growth factor receptor in intestinal epithelial cells: functional consequences for ion transport. J. Biol. Chem. 2012;287:2144–2155. doi: 10.1074/jbc.M111.318139. [DOI] [PMC free article] [PubMed] [Google Scholar]
- Pommerenke C., Wilk E., Srivastava B., Schulze A., Novoselova N., Geffers R., Schughart K. Global transcriptome analysis in influenza-infected mouse lungs reveals the kinetics of innate and adaptive host immune responses. PLoS One. 2012;7:e41169. doi: 10.1371/journal.pone.0041169. [DOI] [PMC free article] [PubMed] [Google Scholar]
- Reading P.C., Miller J.L., Anders E.M. Involvement of the mannose receptor in infection of macrophages by influenza virus. J. Virol. 2000;74:5190–5197. doi: 10.1128/jvi.74.11.5190-5197.2000. [DOI] [PMC free article] [PubMed] [Google Scholar]
- Sanda C., Weitzel P., Tsukahara T., Schaley J., Edenberg H.J., Stephens M.A., Mcclintick J.N., Blatt L.M., Li L., Brodsky L., Taylor M.W. Differential gene induction by type I and type II interferons and their combination. J. Interferon Cytokine Res. 2006;26:462–472. doi: 10.1089/jir.2006.26.462. [DOI] [PubMed] [Google Scholar]
- Sanders C.J., Doherty P.C., Thomas P.G. Respiratory epithelial cells in innate immunity to influenza virus infection. Cell Tissue Res. 2011;343:13–21. doi: 10.1007/s00441-010-1043-z. [DOI] [PubMed] [Google Scholar]
- Sauter N.K., Bednarski M.D., Wurzburg B.A., Hanson J.E., Whitesides G.M., Skehel J.J., Wiley D.C. Hemagglutinins from two influenza virus variants bind to sialic acid derivatives with millimolar dissociation constants: a 500-MHz proton nuclear magnetic resonance study. Biochemistry. 1989;28:8388–8396. doi: 10.1021/bi00447a018. [DOI] [PubMed] [Google Scholar]
- Sauter N.K., Hanson J.E., Glick G.D., Brown J.H., Crowther R.L., Park S.J., Skehel J.J., Wiley D.C. Binding of influenza virus hemagglutinin to analogs of its cell-surface receptor, sialic acid: analysis by proton nuclear magnetic resonance spectroscopy and X-ray crystallography. Biochemistry. 1992;31:9609–9621. doi: 10.1021/bi00155a013. [DOI] [PubMed] [Google Scholar]
- Schindelin J., Arganda-Carreras I., Frise E., Kaynig V., Longair M., Pietzsch T., Preibisch S., Rueden C., Saalfeld S., Schmid B., et al. Fiji: an open-source platform for biological-image analysis. Nat. Methods. 2012;9:676–682. doi: 10.1038/nmeth.2019. [DOI] [PMC free article] [PubMed] [Google Scholar]
- Schoggins J.W. Interferon-stimulated genes: what do they all do? Annu. Rev. Virol. 2019;6:567–584. doi: 10.1146/annurev-virology-092818-015756. [DOI] [PubMed] [Google Scholar]
- Sieben C., Kappel C., Zhu R., Wozniak A., Rankl C., Hinterdorfer P., Grubmuller H., Herrmann A. Influenza virus binds its host cell using multiple dynamic interactions. Proc. Natl. Acad. Sci. U S A. 2012;109:13626–13631. doi: 10.1073/pnas.1120265109. [DOI] [PMC free article] [PubMed] [Google Scholar]
- Sieben C., Sezgin E., Eggeling C., Manley S. Influenza A viruses use multivalent sialic acid clusters for cell binding and receptor activation. PLoS Pathog. 2020;16:e1008656. doi: 10.1371/journal.ppat.1008656. [DOI] [PMC free article] [PubMed] [Google Scholar]
- Suarez C., Kovar D.R. Internetwork competition for monomers governs actin cytoskeleton organization. Nat. Rev. Mol. Cell Biol. 2016;17:799–810. doi: 10.1038/nrm.2016.106. [DOI] [PMC free article] [PubMed] [Google Scholar]
- Suzuki Y., Ito T., Suzuki T., Holland R.E., Jr., Chambers T.M., Kiso M., Ishida H., Kawaoka Y. Sialic acid species as a determinant of the host range of influenza A viruses. J. Virol. 2000;74:11825–11831. doi: 10.1128/jvi.74.24.11825-11831.2000. [DOI] [PMC free article] [PubMed] [Google Scholar]
- To K.K., Chan J.F., Chen H., Li L., Yuen K.Y. The emergence of influenza A H7N9 in human beings 16 years after influenza A H5N1: a tale of two cities. Lancet Infect. Dis. 2013;13:809–821. doi: 10.1016/S1473-3099(13)70167-1. [DOI] [PMC free article] [PubMed] [Google Scholar]
- To K.K.W., Zhou J., Song Y.Q., Hung I.F.N., Ip W.C.T., Cheng Z.S., Chan A.S.F., Kao R.Y.T., Wu A.K.L., Chau S., et al. Surfactant protein B gene polymorphism is associated with severe influenza. Chest. 2014;145:1237–1243. doi: 10.1378/chest.13-1651. [DOI] [PubMed] [Google Scholar]
- To K.K., Zhou J., Chan J.F., Yuen K.Y. Host genes and influenza pathogenesis in humans: an emerging paradigm. Curr. Opin. Virol. 2015;14:7–15. doi: 10.1016/j.coviro.2015.04.010. [DOI] [PMC free article] [PubMed] [Google Scholar]
- To K.K.W., Mok K.Y., Chan A.S.F., Cheung N.N., Wang P., Lui Y.M., Chan J.F.W., Chen H., Chan K.H., Kao R.Y.T., Yuen K.Y. Mycophenolic acid, an immunomodulator, has potent and broad-spectrum in vitro antiviral activity against pandemic, seasonal and avian influenza viruses affecting humans. J. Gen. Virol. 2016;97:1807–1817. doi: 10.1099/jgv.0.000512. [DOI] [PubMed] [Google Scholar]
- To K.K.W., Chan K.H., Ho J., Pang P.K.P., Ho D.T.Y., Chang A.C.H., Seng C.W., Yip C.C.Y., Cheng V.C.C., Hung I.F.N., Yuen K.Y. Respiratory virus infection among hospitalized adult patients with or without clinically apparent respiratory infection: a prospective cohort study. Clin. Microbiol. Infect. 2019;25:1539–1545. doi: 10.1016/j.cmi.2019.04.012. [DOI] [PMC free article] [PubMed] [Google Scholar]
- Utech M., Ivanov A.I., Samarin S.N., Bruewer M., Turner J.R., Mrsny R.J., Parkos C.A., Nusrat A. Mechanism of IFN-gamma-induced endocytosis of tight junction proteins: myosin II-dependent vacuolarization of the apical plasma membrane. Mol. Biol. Cell. 2005;16:5040–5052. doi: 10.1091/mbc.E05-03-0193. [DOI] [PMC free article] [PubMed] [Google Scholar]
- Vanderheiden A., Ralfs P., Chirkova T., Upadhyay A.A., Zimmerman M.G., Bedoya S., Aoued H., Tharp G.M., Pellegrini K.L., Manfredi C., et al. Type I and type III interferons restrict SARS-CoV-2 infection of human airway epithelial cultures. J. Virol. 2020;94 doi: 10.1128/JVI.00985-20. e00985–20. [DOI] [PMC free article] [PubMed] [Google Scholar]
- Vareille M., Kieninger E., Edwards M.R., Regamey N. The airway epithelium: soldier in the fight against respiratory viruses. Clin. Microbiol. Rev. 2011;24:210–229. doi: 10.1128/CMR.00014-10. [DOI] [PMC free article] [PubMed] [Google Scholar]
- Wei X., Jia Z.S., Lian J.Q., Zhang Y., Li J., Ma L., Ye L., Wang J.P., Pan L., Wang P.Z., Bai X.F. Inhibition of hepatitis C virus infection by interferon-gamma through downregulating claudin-1. J. Interferon Cytokine Res. 2009;29:171–178. doi: 10.1089/jir.2008.0040. [DOI] [PubMed] [Google Scholar]
- Weiss I.D., Wald O., Wald H., Beider K., Abraham M., Galun E., Nagler A., Peled A. IFN-gamma treatment at early stages of influenza virus infection protects mice from death in a NK cell-dependent manner. J. Interferon Cytokine Res. 2010;30:439–449. doi: 10.1089/jir.2009.0084. [DOI] [PubMed] [Google Scholar]
- Weizman O.E., Adams N.M., Schuster I.S., Krishna C., Pritykin Y., Lau C., Degli-Esposti M.A., Leslie C.S., Sun J.C., O'sullivan T.E. ILC1 confer early host protection at initial sites of viral infection. Cell. 2017;171:795–808.e12. doi: 10.1016/j.cell.2017.09.052. [DOI] [PMC free article] [PubMed] [Google Scholar]
- Yeung M.L., Jia L., Yip C.C.Y., Chan J.F.W., Teng J.L.L., Chan K.H., Cai J.P., Zhang C., Zhang A.J., Wong W.M., et al. Human tryptophanyl-tRNA synthetase is an IFN-gamma-inducible entry factor for Enterovirus. J. Clin. Invest. 2018;128:5163–5177. doi: 10.1172/JCI99411. [DOI] [PMC free article] [PubMed] [Google Scholar]
- Yuan S., Chu H., Chan J.F., Ye Z.W., Wen L., Yan B., Lai P.M., Tee K.M., Huang J., Chen D., et al. SREBP-dependent lipidomic reprogramming as a broad-spectrum antiviral target. Nat. Commun. 2019;10:120. doi: 10.1038/s41467-018-08015-x. [DOI] [PMC free article] [PubMed] [Google Scholar]
- Zhao H., To K.K.W., Chu H., Ding Q., Zhao X., Li C., Shuai H., Yuan S., Zhou J., Kok K.H., et al. Dual-functional peptide with defective interfering genes effectively protects mice against avian and seasonal influenza. Nat. Commun. 2018;9:2358. doi: 10.1038/s41467-018-04792-7. [DOI] [PMC free article] [PubMed] [Google Scholar]
- Zhou J., Li C., Sachs N., Chiu M.C., Wong B.H., Chu H., Poon V.K., Wang D., Zhao X., Wen L., et al. Differentiated human airway organoids to assess infectivity of emerging influenza virus. Proc. Natl. Acad. Sci. U S A. 2018;115:6822–6827. doi: 10.1073/pnas.1806308115. [DOI] [PMC free article] [PubMed] [Google Scholar]
- Zhou Q.D., Chi X., Lee M.S., Hsieh W.Y., Mkrtchyan J.J., Feng A.C., He C., York A.G., Bui V.L., Kronenberger E.B., et al. Interferon-mediated reprogramming of membrane cholesterol to evade bacterial toxins. Nat. Immunol. 2020;21:746–755. doi: 10.1038/s41590-020-0695-4. [DOI] [PMC free article] [PubMed] [Google Scholar]
Associated Data
This section collects any data citations, data availability statements, or supplementary materials included in this article.
Supplementary Materials
Data Availability Statement
All data reported in this paper will be shared by the lead contact upon request.
This paper does not report original code
Any additional information required to reanalyze the data reported in this paper is available from the lead contact upon request.