

Abstract
Background and Aim
Several inflammation‐based scores have prognostic value for patients diagnosed with various cancers. However, using only a single inflammation‐based prognostic score may be unreliable, as the cut‐off values and relative usefulness among various inflammation‐based prognostic scores vary. We established a new combined index of four inflammation‐based prognostic scores, namely the neutrophil/lymphocyte ratio, platelet/lymphocyte ratio, prognostic index, and prognostic nutritional index, and assessed its usefulness to predict the prognosis of gastric cancer.
Methods and Results
We reviewed the data of 635 patients who underwent surgical resection for gastric cancer. We calculated the combined index as the total value of each of the four included inflammation‐based prognostic scores and analyzed the relationship between the combined index and postoperative prognosis of gastric cancer. The new combined index was represented as a value between 0 and 6 in each patient. The Kaplan–Meier survival curves showed that patients whose combined index was 0 had good long‐term outcomes, while the prognosis of patients whose combined index ranged from 4 to 6 was poor.
Conclusion
This new combined index was strongly associated with poor prognosis in patients who underwent surgery for gastric cancer. It is inferred that it can predict patient prognosis after surgical resection for gastric cancer with a stronger correlation and clearer stratification than a single inflammation‐based prognostic score.
Keywords: gastric cancer, inflammation‐based prognostic score, lymphocytes, nutrition assessment, prognosis
We reviewed 635 patients who underwent surgical resection for gastric cancer. We constructed the novel combined index of four inflammation‐based prognostic scores (IBPS) including neutrophil‐lymphocyte ratio (NLR), platelet‐lymphocyte ratio (PLR), prognostic index (PI), and prognostic nutritional index (PNI). The Combined index can predict prognosis after surgical resection for gastric cancer with strongly correlation and clear stratification.
Introduction
Gastric cancer is the fifth most common malignant disease and the third leading cause of cancer‐related deaths worldwide. 1 An estimated 12.7 million new cancer cases and 7.6 million deaths due to gastric cancer occur yearly. 2 The treatment choice for gastric cancer depends on the degree of tumor progression and the patient's general condition. The tumor–node–metastasis (TNM) classification evaluates the clinical prognosis in gastric cancers by assessing the tumor depth, extent of lymph node metastasis, and distant metastasis. 3 However, the actual prognosis of patients with the same TNM stage differs, suggesting the influence of other factors. Factors such as malnutrition, skeletal muscle loss, and systemic inflammatory response have been associated with poor outcomes in patients with various cancers. 4 , 5 , 6 , 7 , 8 , 9
Inflammatory cytokines and tumor‐associated inflammatory cells contribute to tumor angiogenesis, invasion, and metastasis, which worsen patient prognosis. 10 , 11 The blockade of inflammatory cytokines and chemokines inhibits the progression of various tumors, further proving the importance of these mediators in cancer. 12 Based on this relationship between cancer progression and inflammation, inflammation‐based prognostic scores (IBPSs), including neutrophil/lymphocyte ratio (NLR), platelet/lymphocyte ratio (PLR), prognostic index (PI), and prognostic nutritional index (PNI), have been reported to have a prognostic value in malignant solid tumors. 8 , 9 , 13 , 14 , 15 , 16 , 17 , 18 These scores use biomarkers that can be easily evaluated from peripheral venous blood. However, their cut‐off values vary among reports. Several studies have compared the validity of multiple IBPSs to predict the prognosis of gastrointestinal malignancies. 19 , 20 , 21 , 22 Toyokawa et al. 19 evaluated the prognostic value of six IBPSs in patients with Stage II gastric cancer, suggesting that the C‐reactive protein (CRP)/albumin ratio and the PNI score were independent prognostic factors that are superior to other biomarkers. Another study compared five IBPSs in patients with esophageal and gastric carcinomas and concluded that PLR and PNI scores were significant predictors of patient survival. 20 An additional study showed that the Glasgow Prognostic Score (GPS) is a robust predictor of gastric cancer survival in patients who underwent tumor resection. 21 We previously compared seven IBPSs and found GPS, PI score, and PNI score were independent prognostic factors in patients with upper gastric cancer. 22 Many reports support PNI as a more useful marker than other IBPSs. However, this remains controversial.
Therefore, using only one IBPS may be unreliable because its cut‐off value and relative importance of usefulness among various IBPSs are not fixed. We hypothesized that patients with a majority of poor IBPSs tended to have worse prognoses than those with only one or two poor IBPSs. In this study, we created a new index that combines the values of multiple IBPSs, and verified its effectiveness by analyzing data from patients who underwent surgical resection for gastric cancer.
Methods
Patients
In this retrospective cohort study, we reviewed data from 801 patients diagnosed with gastric cancer who underwent surgical resection at the Department of Gastroenterological Surgery, National Kyushu Medical Center, from January 2010 to March 2019. All patients were diagnosed with adenocarcinoma. We excluded patients who underwent palliative or non‐curative surgery (n = 48) and whose clinical data comprised incomplete factors required for the calculation of IBPSs and information related to prognosis (n = 118). Ultimately, 635 patients who underwent curative surgery for gastric cancer and whose IBPSs such as NLR, PLR, PI, and PNI could be calculated accurately were eligible for analysis.
This study was approved by the Institutional Review Board of the National Kyushu Medical Center (19C066). All patients provided informed written consent prior to inclusion.
Inflammation‐based prognostic scores
The NLR, PLR, PI, and PNI values were calculated. Patient baseline laboratory data were obtained by sampling peripheral venous blood within 1 week before surgery. NLR and PLR were defined as absolute neutrophil and platelet counts, respectively, divided by the absolute lymphocyte count. 15 , 17 PI score calculation was based on the CRP level and white blood cell count. The upper limits of reference ranges for CRP level (0.1 mg/dL) and white blood cell count (11 000/mm3) were used as cut‐off values. 13 , 22 PI was 0 if both values were below the cut‐offs, 1 if either value was elevated, and 2 if both were above the cut‐offs. PNI was calculated using the following formula: 10 × serum albumin (g/dL) + 0.005 × total lymphocyte count (per mm3). 16
Combined index
The NLR, PLR, PI, and PNI values were used for calculating the new combined index. Each factor was scored according to the cut‐off values. Receiver operating characteristic (ROC) curve analysis was used to identify the optimal cut‐off values of NLR and PLR. The PI value was obtained from the original score. Based on previous reports, the tendency of a cut‐off value of the PNI was investigated. Although the cut‐off values differed from one study to another, to the best of our knowledge, 40 and 45 were generally used as the cut‐off values of PNI. 16 , 22 , 23 , 24 We classified a score in each IBPS based on the hazard ratio calculated in multivariate analyses.
Statistical analyses
Differences in characteristics between groups were evaluated using Fisher's exact test or an unpaired t‐test. Kaplan–Meier survival curves were plotted, and differences were analyzed using the log‐rank test. Univariate and multivariate analyses were performed using a Cox proportional hazard model to identify independent prognostic factors. All P‐values were two‐sided, and P < 0.05 was considered to be statistically significant. ROC curve analysis was used to determine the predictive value of the NLR and PLR. All analyses were performed using JMP PRO 11 (SAS Institute Inc., Cary, NC, USA).
Results
Patient characteristics
The clinicopathological characteristics of the 635 patients (417 [65.7%] men and 218 [34.3%] women) are summarized in Table 1. The mean patient age was 68.5 (range 30–97) years. Regarding TNM classification, 401 (63.2%), 112 (17.6%), and 122 (19.2%) patients had Stage I, II, and III disease, respectively. Distal, total, and proximal gastrectomy (PG) were performed in 410 (64.6%), 182 (28.7%), and 43 (6.8%) patients, respectively. Pathological features such as tumor location, tumor macroscopic features, and histological type are also summarized in Table 1. The overall survival (OS) rate in all patients was 70.4%, and the recurrence rate was 13.9%. NLR, PLR, PI, and PNI scores were calculated based on laboratory data, which were obtained by sampling peripheral venous blood. ROC curve analysis was performed to identify the optimal cut‐off values of the NLR and PLR related to OS. The optimal cut‐off values of the NLR and PLR were identified as 2.75 and 178. The area under the curve (AUC) was 0.60166 and 0.60570, respectively (Fig. S1, Supporting information). The number of patients according to the cut‐off values of the NLR, PLR, PI, and PNI is shown in Table 1.
Table 1.
Characteristics of patients with gastric cancer
| No. of patients | |
|---|---|
| Characteristic | n (%) |
| Sex | |
| Male | 417 (65.7) |
| Female | 218 (34.3) |
| Age | 68.5 (30‐97) |
| Tumor location | |
| EGJ | 13 (2.0) |
| U | 124 (19.5) |
| M | 241 (38.0) |
| L | 257 (40.5) |
| Macroscopic type | |
| 0‐I | 16 (2.5) |
| 0‐IIa | 69 (10.9) |
| 0‐IIb | 6 (0.9) |
| 0‐IIc | 293 (46.1) |
| 0‐III | 2 (0.3) |
| 1 | 9 (1.4) |
| 2 | 102 (16.1) |
| 3 | 88 (13.9) |
| 4 | 17 (2.7) |
| 5 | 33 (5.2) |
| Dissection of lymph nodes | |
| D1 | 95 (15.1) |
| D1+ | 288 (45.6) |
| D2 | 248 (39.3) |
| Pathological feature | |
| tub1 | 159 (25.0) |
| tub2 | 167 (26.3) |
| por1 | 73 (11.5) |
| por2 | 160 (25.2) |
| sig | 51 (8.0) |
| muc | 15 (2.4) |
| pap | 7 (1.1) |
| others | 3 (0.5) |
| Stage | |
| I | 401 (63.2) |
| II | 112 (17.6) |
| III | 122 (19.2) |
| Surgical procedure | |
| DG | 410 (64.6) |
| TG | 182 (28.7) |
| PG | 43 (6.8) |
| Surgical approach | |
| Open | 254 (40.0) |
| Laparoscopic | 381 (60.0) |
| Adjuvant chemotherapy | |
| No | 475 (74.8) |
| Yes | 160 (25.2) |
| NLR | |
| <2.75 | 431 (67.9) |
| ≥2.75 | 204 (32.1) |
| PLR | |
| <178 | 413 (65.0) |
| ≥178 | 222 (35.0) |
| PI | |
| 0 | 579 (91.2) |
| 1 | 52 (8.2) |
| 2 | 4 (0.6) |
| PNI | |
| ≥45 | 469 (73.9) |
| 40 ≤ PNI < 45 | 100 (15.7) |
| <40 | 66 (10.4) |
| Recurrence | |
| No | 547 (86.1) |
| Yes | 88 (13.9) |
| Prognosis | |
| Survival | 447 (70.4) |
| Death | 188 (29.6) |
Data are presented as n (%) with the exception of age, which is presented as mean (range).
DG, distal gastrectomy; EGJ, esophagogastric junction; NLR, neutrophil/lymphocyte ratio; PG, proximal gastrectomy; PI, prognostic index; PLR, platelet/lymphocyte ratio; PNI, prognostic nutritional index; TG, total gastrectomy.
Prognostic factors for OS
To evaluate the relationship between gastric cancer prognosis and each variable, univariate and multivariate analyses with a Cox proportional hazard model were performed. Univariate analyses revealed sex, age, surgical procedure (total gastrectomy [TG] vs distal gastrectomy [DG] or proximal gastrectomy [PG]), surgical approach (open vs laparoscopic), TNM stage (Stage II–III vs Stage I), and individual NLR, PLR, PI, and PNI scores that were associated with poor OS in patients with gastric cancer (Table 2). Multivariate analyses revealed that male sex (P = 0.0026), age ≥65 years (P < 0.0001), Stage II–III (P < 0.0001), and PNI score <40 (P = 0.0021) were independent poor prognostic factors of OS in patients with gastric cancer (Table 2).
Table 2.
Univariate and multivariate analyses for overall survival
| Univariate analysis | Multivariate analyses | |||
|---|---|---|---|---|
| Factor | HR (95% CI) | P value | HR (95% CI) | P value |
| Male (vs female) | 1.683 (1.223‐2.355) | 0.0012 | 1.648 (1.187‐2.327) | 0.0026 |
| Age ≥65 years (vs <65 years) | 2.593 (1.834‐3.761) | <0.0001 | 2.214 (1.544‐3.248) | <0.0001 |
| TG (vs DG or PG) | 1.785 (1.329‐2.387) | 0.0001 | 1.218 (0.892‐1.655) | 0.2132 |
| Open (vs laparoscopic) | 1.737 (1.291‐2.352) | 0.0003 | 1.168 (0.846‐1.619) | 0.3465 |
| Stage II‐III (vs Stage I) | 3.493 (2.601‐4.724) | <0.0001 | 2.549 (1.854‐3.525) | <0.0001 |
| NLR ≥ 2.75 (vs <2.75) | 2.359 (1.763‐3.151) | <0.0001 | 1.271 (0.875‐1.838) | 0.2070 |
| PLR ≥ 178 (vs <178) | 1.795 (1.342‐2.395) | <0.0001 | 1.054 (0.743‐1.489) | 0.7669 |
| PI (ref: 0) | ||||
| 1 | 2.240 (1.446‐3.331) | 0.0006 | 1.208 (0.749‐1.885) | 0.4285 |
| 2 | 10.27 (2.524‐27.31) | 0.0036 | 1.953 (0.456‐5.745) | 0.3229 |
| PNI (ref: ≥45) | ||||
| 40 ≤ PNI < 45 | 1.933 (1.324‐2.766) | 0.0009 | 1.236 (0.823‐1.823) | 0.3008 |
| <40 | 4.619 (3.179‐6.585) | <0.0001 | 2.079 (1.312‐3.243) | 0.0021 |
CI, confidence interval; DG, distal gastrectomy; HR, hazard ratio; NLR, neutrophil‐lymphocyte ratio; PG, proximal gastrectomy; PI, prognostic index; PLR, platelet‐lymphocyte ratio; PNI, prognostic nutritional index; ref, reference; TG, total gastrectomy.
Postoperative prognosis based on the combined index
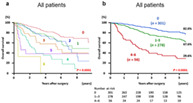
In defining the combined index, correlation coefficients in each pair of NLR, PLR, PI, and PNI were estimated (Fig. S2, Supporting information). Based on the hazard ratio calculated in multivariate analyses, a score in each IBPS was assigned as shown in Table 3. Finally, the combined index was calculated for each patient as the sum of all IBPSs, ranging from 0 to 6. Kaplan–Meier curves were plotted for each score of the combined index (Fig. 1a) and showed three tendencies. Patients whose combined index was 0 had good long‐term outcomes, while those with a combined index between 4 and 6 had poor prognosis. The prognosis of patients whose combined index ranged from 1 to 3 was better than that of patients with a higher combined index, but the long‐term OS rates were poor, especially over 5 years (Fig. 1a). Patients were subsequently categorized into the following three groups according to the combined index: low OS, score 0; medium OS, score 1–3; high OS, score 4–6. Kaplan–Meier survival curves for the OS between the three groups are shown in Figure 1b. Five‐year OS rates in the low, medium, and high groups were 82.0, 67.6, and 29.6%, respectively (P < 0.0001).
Table 3.
Calculation of the combined index
| Factor | Score |
| NLR | |
| <2.75 | 0 |
| ≥2.75 | 1 |
| PLR | |
| <178 | 0 |
| ≥178 | 1 |
| PI | |
| CRP ≤1.0 mg/dL and WBC ≤11 000/mm3 | 0 |
| CRP >1.0 mg/dL or WBC >11 000/mm3 | 1 |
| CRP >1.0 mg/dL and WBC >11 000/mm3 | 2 |
| PNI | |
| ≥45 | 0 |
| 40 ≤ PNI < 45 | 1 |
| <40 | 2 |
| Combined index | |
| =total value of each score of five IBPSs | 0–6 |
CRP, C‐reactive protein; IBPS, inflammation‐based prognostic score; NLR, neutrophil/lymphocyte ratio; PI, prognostic index; PLR, platelet/lymphocyte ratio; PNI, prognostic nutritional index; WBC, white blood cell count; .
Figure 1.

(a) Kaplan–Meier survival curves for overall survival (OS) in patients with gastric cancer based on each score of the combined index of inflammation‐based prognostic scores. (b) Kaplan–Meier survival curves for OS by dividing patients into three groups according to the value of combined index: Low (score 0), medium (score 1–3), and high (score 4–6).
Subgroup analyses, classifying the disease into early stage (Stage I) and advanced stage (Stage II and III), were also performed. Kaplan–Meier survival curves for OS according to the combined index in patients with early or advanced stages are shown in Figure 2. Five‐year OS rates of patients with early‐stage disease in the low, medium, and high groups were 90.2, 80.9, and 39.3% (P < 0.0001) and those of patients with advanced‐stage disease were 57.4, 52.2, and 25.5%, all in respective order (P < 0.0001). The five‐year OS rate of patients with Stage I disease in the medium group was relatively good. However, the 8‐year OS was poorer than that of the low group (50.5 vs 78.7%, P = 0.0017) (Fig. S3, Supporting information).
Figure 2.
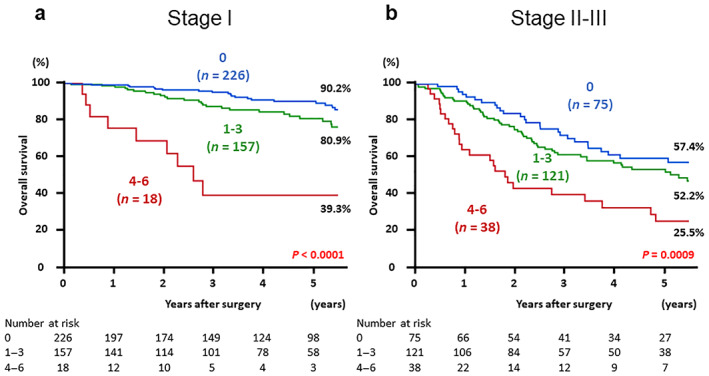
Postoperative overall survival in patients with gastric cancer based on the three groups according to the value of combined index: low (score 0), medium (score 1–3), and high (score 4–6). The Kaplan–Meier method was performed separately by the tumor‐node‐metastasis stage. (a) Patients diagnosed with Stage I, and (b) patients diagnosed with Stages II and III.
Postoperative survival based on the combined index after categorization by surgical procedure was also analyzed. Patients were categorized into two groups: those who underwent DG or PG, and those who underwent TG. Kaplan–Meier survival curves showed 5‐year OS rates of patients who underwent DG or PG in the low, medium, and high groups to be 85.5, 74.6, and 27.2% (P < 0.0001) and those of patients who underwent TG to be 73.0, 52.9, and 32.3%, respectively (P = 0.0001) (Fig. 3).
Figure 3.
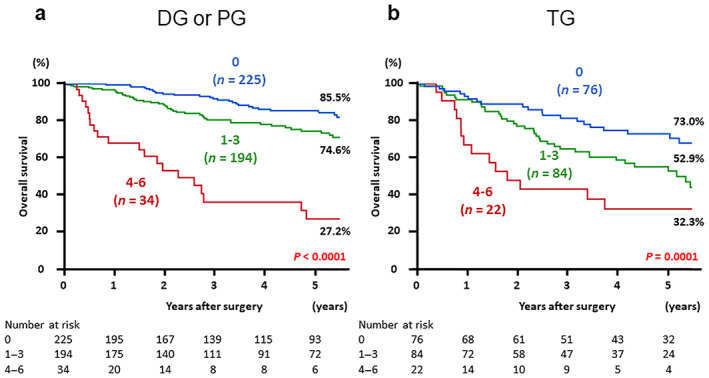
Postoperative overall survival in patients with gastric cancer based on the three groups according to the value of combined index: low (score 0), medium (score 1–3), and high (score 4–6). The Kaplan–Meier method was performed separately by surgical procedure. (a) Patients who underwent distal gastrectomy or proximal gastrectomy, and (b) patients who underwent total gastrectomy. DG, distal gastrectomy; PG, proximal gastrectomy; TG, total gastrectomy.
Discussion
We created a new index combining four IBPSs (i.e. NLR, PLR, PI, and PNI) and verified its effectiveness by analyzing data from patients who underwent surgical resection for gastric cancer. A higher value of the combined index was strongly associated with poor prognosis in patients with gastric cancer, so this combined index can predict long‐term outcomes of gastric cancer after surgery.
Factors included in this combined index are neutrophil count, lymphocyte count, platelet count, CRP level, and serum albumin level. Neutrophil count and CRP level usually increase during systemic inflammation, which may occur as a result of tumor progression. Serum albumin level is an indicator of nutritional status. Hypoalbuminemia may occur because of the systemic inflammatory response and reflects malnutrition or cachexia due to tumor progression. 20 The significance of lymphocytes in antitumor immunity is evident from lymphopenia, a state of immunosuppression, promoting cancer progression. 25 , 26 Platelets contribute to tumor growth, angiogenesis, and tumoral neovascularization by secreting platelet‐derived growth factor, vascular endothelial growth factor, and transforming growth factor‐beta in the tumor microenvironment. 27 , 28 These mechanisms explain why these biomarkers can be indicators of cancer prognosis. The combined index covers more indicators than a single IBPS.
Previous reports and our study indicate that even a single IBPS can be correlated with the prognosis of various solid tumors, including gastric cancer. However, setting a cut‐off value for each IBPS can lead to the contradiction of the prognostic value of one IBPS being poor but that of another IBPS being good in some patients. The cut‐off values of IBPSs also differ among studies. To reduce these discrepancies, we created a more reliable stratification by combining scores of four IBPSs. We categorized patients into three groups according to the combined index value: low (score 0), medium (score 1–3), and high (score 4–6). Kaplan–Meier survival curves for OS showed that the prognosis of patients in the low‐score group was good, while that of patients in the high‐score group was remarkably poor. Regarding patients in the medium‐score group, the 5‐year OS rates were better than those of patients in the high‐score group, especially for Stage I disease, but poorer than those of patients in the low‐score group according to the follow‐up survey. These results suggest that the combined index may be correlated with long‐term survival, even when gastric cancer is cured. Also, these patients' classification according to the combined index may be useful in considering the indications for surgery and predicting the postoperative prognosis of patients with gastric cancer. In particular, patients in the medium‐score group should undergo radical surgery for gastric cancer because they can be expected to have long‐term survival beyond 5 years. However, indications for surgery in patients in the low‐score group may be considered more carefully because the 5‐year OS rates were very poor even though curative surgery was accomplished.
Subgroup analyses based on surgical procedures showed a higher combined index, which was significantly correlated with poor prognosis in the DG or PG group. Generally, TG is a more invasive surgery than DG or PG. It is unclear why the prognosis of patients with high combined index values was poor, especially in the DG or PG group. However, we speculate that some patients who need TG as standard surgery might undergo DG or PG because of their poor general condition.
A few studies have investigated the prognostic significance of the combination of multiple IBPSs or other biomarkers. Guo et al. showed that the combination of CRP and NLR could function as an independent prognostic factor in gastric cancer and provide a more accurate prediction than NLR or CRP alone. 29 Sun et al. reported that preoperative NLR and PLR could predict survival in patients with Stage I–II gastric cancer. 30 However, to the best of our knowledge and as evidenced by literature review, no reports discussing a combination of four IBPSs to predict gastric cancer prognosis exist. Our combined index may be useful because it can categorize patients into good and poor prognosis groups based on one cut‐off value and it can be stratified by a score from 0 to 6.
This study has some limitations. First, it is limited in that it was a retrospective, single‐institution study. However, the accumulation of findings from retrospective studies could be valuable. Moreover, this study may play an important role in proposing a new combined index and presenting its effectiveness. Second, our combined index includes NLR, PLR, and PNI scores, which have common components such as lymphocytes. Thus, we calculated correlation coefficients in each pair of NLR, PLR, PI, and PNI. As a result, all four IBPSs were not correlated with each other (Fig. S2). Based on these analyses, we included four IBPSs in the combined index. Our new combined index, through its clear stratification, can express the degree of poor prognosis more reliably than a single IBPS. There may still be room for improvement in the reliability of this combined index, but we sought both the strength of correlation with prognosis and simplicity of calculation, and as a result, established such an index.
The new combined index was strongly associated with poor prognosis in patients who underwent surgery for gastric cancer. It is inferred that it can predict prognosis after surgical resection for gastric cancer with a strong correlation and clearer stratification than a single IBPS.
Supporting information
Figure S1. Comparison of the predictive ability of the NLR and PLR by receiver operating characteristic (ROC) curve analyses. AUC, area under the curve; NLR, neutrophil/lymphocyte ratio; PLR, platelet/lymphocyte ratio.
Figure S2. Analyses of correlation coefficients in each pair of NLR, PLR, PI, and PNI. NLR, neutrophil/lymphocyte ratio; PLR, platelet/lymphocyte ratio; PI, prognostic index; PNI, prognostic nutritional index.
Figure S3. Postoperative overall survival in patients who were diagnosed with Stage I gastric cancer based on the three groups according to the value of combined index: low (score 0) and medium (score 1–3). This figure is related to Figure 2 but specifically indicates long‐term survival curves of 5 years or longer. OS, overall survival.
Acknowledgments
We thank the Kaibara Morikazu Medical Science Promotion Foundation, the Uehara Memorial Foundation, the Clinical Research Promotion Foundation, and Fukuoka Public Health Promotion Organization Cancer Research Fund for financial support. We thank Editage Group (https://www.editage.jp/) for editing the draft of this manuscript.
Declaration of conflict of interest: Dr. Kensuke Kudou was supported by grants from the Kaibara Morikazu Medical Science Promotion Foundation in 2019, the Uehara Memorial Foundation in 2020, Grant of The Clinical Research Promotion Foundation in 2020, and Fukuoka Public Health Promotion Organization Cancer Research Fund in 2021. The other authors have no conflicts of interest or financial ties to disclose.
Financial support: This study was supported by grants from the Kaibara Morikazu Medical Science Promotion Foundation in 2019, the Uehara Memorial Foundation in 2020, Grant of The Clinical Research Promotion Foundation in 2020, and Fukuoka Public Health Promotion Organization Cancer Research Fund in 2021.
References
- 1. Torre LA, Bray F, Siegel RL, Ferlay J, Lortet‐Tieulent J, Jemal A. Global cancer statistics, 2012. CA Cancer J. Clin. 2015; 65: 87–108. [DOI] [PubMed] [Google Scholar]
- 2. Ferlay J, Shin HR, Bray F, Forman D, Mathers C, Parkin DM. Estimates of worldwide burden of cancer in 2008: GLOBOCAN 2008. Int. J. Cancer. 2010; 127: 2893–917. [DOI] [PubMed] [Google Scholar]
- 3. Lu J, Zheng CH, Cao LL et al. The effectiveness of the 8th American Joint Committee on Cancer TNM classification in the prognosis evaluation of gastric cancer patients: a comparative study between the 7th and 8th editions. Eur. J. Surg. Oncol. 2017; 43: 2349–56. [DOI] [PubMed] [Google Scholar]
- 4. Park JH, Watt DG, Roxburgh CS, Horgan PG, McMillan DC. Colorectal cancer, systemic inflammation, and outcome: staging the tumor and staging the host. Ann. Surg. 2016; 263: 326–36. [DOI] [PubMed] [Google Scholar]
- 5. Kudou K, Saeki H, Nakashima Y et al. Postoperative development of sarcopenia is a strong predictor of a poor prognosis in patients with adenocarcinoma of the esophagogastric junction and upper gastric cancer. Am. J. Surg. 2019; 217: 757–63. [DOI] [PubMed] [Google Scholar]
- 6. Tamandl D, Paireder M, Asari R, Baltzer PA, Schoppmann SF, Ba‐Ssalamah A. Markers of sarcopenia quantified by computed tomography predict adverse long‐term outcome in patients with resected oesophageal or gastro‐oesophageal junction cancer. Eur. Radiol. 2016; 26: 1359–67. [DOI] [PubMed] [Google Scholar]
- 7. Miyamoto Y, Baba Y, Sakamoto Y et al. Sarcopenia is a negative prognostic factor after curative resection of colorectal cancer. Ann. Surg. Oncol. 2015; 22: 2663–8. [DOI] [PubMed] [Google Scholar]
- 8. Jomrich G, Hollenstein M, John M et al. The modified Glasgow Prognostic Score is an independent prognostic indicator in neoadjuvantly treated adenocarcinoma of the esophagogastric junction. Oncotarget. 2018; 9: 6968–76. [DOI] [PMC free article] [PubMed] [Google Scholar]
- 9. Kudou K, Saeki H, Nakashima Y et al. Prognostic significance of sarcopenia in patients with esophagogastric junction cancer or upper gastric cancer. Ann. Surg. Oncol. 2017; 24: 1804–10. [DOI] [PubMed] [Google Scholar]
- 10. Philip M, Rowley DA, Schreiber H. Inflammation as a tumor promoter in cancer induction. Semin. Cancer Biol. 2004; 14: 433–9. [DOI] [PubMed] [Google Scholar]
- 11. Kusumanto YH, Dam WA, Hospers GA, Meijer C, Mulder NH. Platelets and granulocytes, in particular the neutrophils, from important compartments for circulating vascular endothelial growth factor. Angiogenesis. 2003; 6: 283–7. [DOI] [PubMed] [Google Scholar]
- 12. Balkwill F, Mantovani A. Inflammation, and cancer: back to Virchow? Lancet. 2001; 357: 539–45. [DOI] [PubMed] [Google Scholar]
- 13. Kinoshita A, Onoda H, Imai N et al. Comparison of the prognostic value of inflammation‐based prognostic scores in patients with hepatocellular carcinoma. Br. J. Cancer. 2012; 107: 988–93. [DOI] [PMC free article] [PubMed] [Google Scholar]
- 14. Yu X, Wen Y, Lin Y et al. The value of preoperative Glasgow Prognostic Score and the C‐reactive protein to albumin ratio as prognostic factors for long‐term survival in pathological T1N0 esophageal squamous cell carcinoma. J. Cancer. 2018; 9: 807–15. [DOI] [PMC free article] [PubMed] [Google Scholar]
- 15. Yamanaka T, Matsumoto S, Teramukai S, Ishiwata R, Nagai Y, Fukushima M. The baseline ratio of neutrophils to lymphocytes is associated with patient prognosis in advanced gastric cancer. Oncology. 2007; 73: 215–20. [DOI] [PubMed] [Google Scholar]
- 16. Hirahara N, Tajima Y, Fujii Y et al. Prognostic nutritional index as a predictor of survival in resectable gastric cancer patients with normal preoperative serum carcinoembryonic antigen levels: a propensity score matching analysis. BMC Cancer. 2018; 18: 285. [DOI] [PMC free article] [PubMed] [Google Scholar]
- 17. Lu C, Gao P, Yang Y et al. Prognostic evaluation of platelet to lymphocyte ratio in patients with colorectal cancer. Oncotarget. 2017; 8: 86287–95. [DOI] [PMC free article] [PubMed] [Google Scholar]
- 18. Kudou K, Saeki H, Nakashima Y et al. C‐reactive protein/albumin ratio is a poor prognostic factor of esophagogastric junction and upper gastric cancer. J. Gastroenterol. Hepatol. 2019; 34: 355–63. [DOI] [PubMed] [Google Scholar]
- 19. Toyokawa T, Muguruma K, Tamura T et al. Comparison of the prognostic impact and combination of preoperative inflammation‐based and/or nutritional markers in patients with stage II gastric cancer. Oncotarget. 2018; 9: 29351–64. [DOI] [PMC free article] [PubMed] [Google Scholar]
- 20. Wen J, Bedford M, Begum R et al. The value of inflammation based prognostic scores in patients undergoing surgical resection for oesophageal and gastric carcinoma. J. Surg. Oncol. 2018; 117: 1697–707. [DOI] [PubMed] [Google Scholar]
- 21. Pan QX, Su ZJ, Zhang JH, Wang C‐R, Ke S‐Y. A comparison of the prognostic value of preoperative inflammation‐based scores and TNM stage in patients with gastric cancer. Onco. Targets. Ther. 2015; 8: 1375–85. [DOI] [PMC free article] [PubMed] [Google Scholar]
- 22. Kudou K, Nakashima Y, Haruta Y et al. Comparison of inflammation‐based prognostic scores associated with the prognostic impact of adenocarcinoma of esophagogastric junction and upper gastric cancer. Ann. Surg. Oncol. 2021; 28: 2059–67. [DOI] [PubMed] [Google Scholar]
- 23. Mirili C, Yılmaz A, Demirkan S, Bilici M, Tekin SB. Clinical significance of prognostic nutritional index (PNI) in malignant melanoma. Int. J. Clin. Oncol. 2019; 24: 1301–10. [DOI] [PubMed] [Google Scholar]
- 24. Xishan Z, Ye Z, Feiyan M, Liang X, Shikai W. The role of prognostic nutritional index for clinical outcomes of gastric cancer after total gastrectomy. Sci. Rep. 2020; 10: 17373. [DOI] [PMC free article] [PubMed] [Google Scholar]
- 25. Kobayashi N, Usui S, Kikuchi S et al. Preoperative lymphocyte count is an independent prognostic factor in node‐negative non‐small cell lung cancer. Lung Cancer. 2012; 75: 223–7. [DOI] [PubMed] [Google Scholar]
- 26. Feng JF, Liu JS, Huang Y. Lymphopenia predicts poor prognosis in patients with esophageal squamous cell carcinoma. Medicine. 2014; 93: e257. [DOI] [PMC free article] [PubMed] [Google Scholar]
- 27. Toyokawa T, Muguruma K, Yoshii M et al. Clinical significance of prognostic inflammation‐based and/or nutritional markers in patients with stage III gastric cancer. BMC Cancer. 2020; 20: 517. [DOI] [PMC free article] [PubMed] [Google Scholar]
- 28. Palacios‐Acedo AL, Mege D, Crescence L, Dignat‐George F, Dubois C, Panicot‐Dubois L. Platelets, thrombo‐inflammation, and Cancer: collaborating with the enemy. Front. Immunol. 2019; 10: 1805. [DOI] [PMC free article] [PubMed] [Google Scholar]
- 29. Guo J, Chen S, Chen Y, Li S, Xu D. Combination of CRP and NLR: a better predictor of postoperative survival in patients with gastric cancer. Cancer Manag Res. 2018; 10: 315–21. [DOI] [PMC free article] [PubMed] [Google Scholar]
- 30. Sun X, Liu X, Liu J et al. Preoperative neutrophil‐to‐lymphocyte ratio plus platelet‐to‐lymphocyte ratio in predicting survival for patients with stage I‐II gastric cancer. Chin. J. Cancer. 2016; 35: 57. [DOI] [PMC free article] [PubMed] [Google Scholar]
Associated Data
This section collects any data citations, data availability statements, or supplementary materials included in this article.
Supplementary Materials
Figure S1. Comparison of the predictive ability of the NLR and PLR by receiver operating characteristic (ROC) curve analyses. AUC, area under the curve; NLR, neutrophil/lymphocyte ratio; PLR, platelet/lymphocyte ratio.
Figure S2. Analyses of correlation coefficients in each pair of NLR, PLR, PI, and PNI. NLR, neutrophil/lymphocyte ratio; PLR, platelet/lymphocyte ratio; PI, prognostic index; PNI, prognostic nutritional index.
Figure S3. Postoperative overall survival in patients who were diagnosed with Stage I gastric cancer based on the three groups according to the value of combined index: low (score 0) and medium (score 1–3). This figure is related to Figure 2 but specifically indicates long‐term survival curves of 5 years or longer. OS, overall survival.