Abstract
The automatic recognition of COVID-19 diseases is critical in the present pandemic since it relieves healthcare staff of the burden of screening for infection with COVID-19. Previous studies have proven that deep learning algorithms can be utilized to aid in the diagnosis of patients with potential COVID-19 infection. However, the accuracy of current COVID-19 recognition models is relatively low. Motivated by this fact, we propose three deep learning architectures, F-EDNC, FC-EDNC, and O-EDNC, to quickly and accurately detect COVID-19 infections from chest computed tomography (CT) images. Sixteen deep learning neural networks have been modified and trained to recognize COVID-19 patients using transfer learning and 2458 CT chest images. The proposed EDNC has then been developed using three of sixteen modified pre-trained models to improve the performance of COVID-19 recognition. The results suggested that the F-EDNC method significantly enhanced the recognition of COVID-19 infections with 97.75% accuracy, followed by FC-EDNC and O-EDNC (97.55% and 96.12%, respectively), which is superior to most of the current COVID-19 recognition models. Furthermore, a localhost web application has been built that enables users to easily upload their chest CT scans and obtain their COVID-19 results automatically. This accurate, fast, and automatic COVID-19 recognition system will relieve the stress of medical professionals for screening COVID-19 infections.
Keywords: COVID-19, CT scans, deep learning, transfer learning, ensemble, automatic recognition
1. Introduction
According to the most recent World Health Organization (WHO) data on 9 December 2021, the cumulative number of confirmed cases of COVID-19 disease globally reached 267,184,623. The number of deaths reached 5,277,327 cases [1].
WHO chief scientist Soumya Swaminathan suggested humans were about 60 percent of the way to fight the Coronavirus [2]. However, unexpected obstacles can still arise, such as the sudden emergence of new variants [3]. Since the outbreak of the Coronavirus pandemic, many variants of the virus have emerged. Compared to the original virus, the Delta variant has a 108% higher chance of being admitted to the hospital, a 235% increased risk of intensive care units (ICU) admission, and a 133% increased risk of death [4]. However, partial and complete vaccination can reduce the risk of severe illness and death for all variants of concerns [5]. The number of hospitalizations, ICU admissions, and deaths decreased throughout the study as vaccinations increased [4]. However, Swaminathan stressed that some regions of the world have very high vaccination rates of 70 to 80 percent [2].
In contrast, less than 4 percent of the population is vaccinated in other regions, such as Africa [6]. The more this situation is tolerated, the more likely new variants will emerge. Swaminathan called on certain countries not to promote vaccines among those who have already been vaccinated but to focus on immunizing the unvaccinated and ensuring that everyone has equitable access to the vaccine [2,7].
It is paramount for those areas that do not have access to vaccination to diagnose coronavirus patients quickly. Both quantitative reverse transcription-polymerase chain reaction (RT-qPCR) testing and CT imaging diagnosis play an essential role in screening COVID-19, with the latter serving as an important complement to the former [8,9,10]. The extent of the lesion detected on CT scans of the patient’s lungs is closely related to the severity of the COVID-19 disease [11]. CT is a method of scanning a particular part of the body one section after another, employing collimated X-ray beams, gamma rays, ultrasound, other radiation, and a pretty sensitive detector [12]. The data can then be combined with a computer to create cross-sectional images of the body, which can be further reconstructed into detailed 3D images or slices of different thicknesses as required [13]. Doctors may need a lot of time and effort to diagnose lung conditions from CT images. Fortunately, deep learning technology can help quickly diagnose the COVID-19 condition with CT scans.
Deep learning is currently a popular study tool for medical image analysis. It has the potential to minimize doctors’ diagnostic workload while also improving the speed at which they make decisions [14]. Deep learning may replace doctors’ long-term experience and thorough review in diagnosing a patient’s disease. Patients can rapidly obtain a more objective opinion after an assessment [15]. Under this pandemic, deep learning and CT scan images have allowed staff to promptly diagnose patients with suspected COVID-19 infection [16].
Various deep learning models have been built and successfully used to recognize COVID-19. A ResNet 50 model for identifying COVID-19 using chest CT scans was presented in Ref [17]. They provide the ResNet base model with the wavelet coefficients of the complete image without cutting any areas of the image. The accuracy of the result was 92.2%. Researchers in Ref [18] evaluated five deep CNN learning models, AlexNet, VGG16, VGG19, GoogleNet, and ResNet50, in detecting COVID-19 patients. The researchers utilized traditional image augmentation with CGAN to boost classification performance for all five models. The outcome suggested ResNet-50 has attained the highest accuracy of 82.91%. Eight pre-trained models including VGG16, VGG19, InceptionV3, InceptionResNetV2, Xexception, DenseNet121, DenseNet169, and DenseNet201 were examined for recognizing COVID-19 patients in Ref [19]. The results indicate that DenseNet201 achieved the highest accuracy of 85%. In Ref [20], a CNN design was proposed based on SqueezeNet for the rapid identification of COVID-19 CT images with regard to other pneumonia and healthy CT images. The architecture permitted an accuracy of 85.03%. Researchers in Ref [21] created FCONet, employing VGG16, ResNet-50, Inception-V3, or Xception as a backbone and using a dataset of 3993 CT scans for recognizing COVID-19. The result indicates that FCONet had an average accuracy of 96.97%. Ref [22] developed a simple CNN and modified pre-trained AlexNet model with a CT dataset of 361 CT images. The outcome suggested that modified CNN had attained the best accuracy of 94.1%.
The contributions of our paper are summarized as follows:
We propose EDNC (F-EDNC, FC-EDNC, and O-EDNC) ensemble deep neural network for COVID-19 recognition, which helps clinicians rapidly and accurately analyze and recognize COVID-19 lung infections from chest CT scans.
A deep neural network named CANet has been developed and built from scratch for comparative analysis with EDNC.
Our proposed F-EDNC has achieved an accuracy of 97.55%, followed by FC-EDNC (97.14%) and O-EDNC (96.32%).
A web application allows users to use F-EDNC easily.
The rest of this paper is structured as follows: Section 2 discusses materials and methods. Section 3 presents the results. Section 4 compares the results with state-of-the-art approaches. Section 5 concludes this study.
2. Materials and Methods
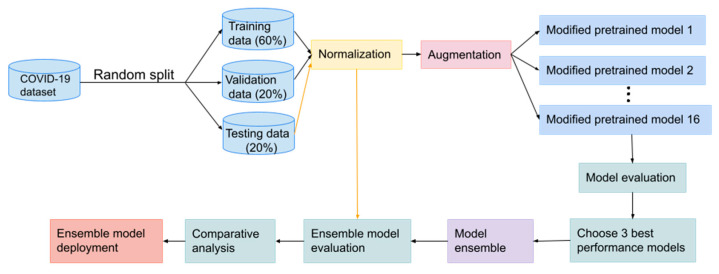
This section focuses on the methodology of developing and implementing the COVID-19 recognition model. We present deep learning methods to distinguish between chest CT scans for COVID-19 and non-COVID-19 symptoms. The flow diagram shown in Figure 1 illustrates these key phrases.
Figure 1.
Flowchart of COVID-19 recognition system design.
2.1. The Dataset
2.1.1. Main Dataset
The COVID-19 recognition task in this paper uses a CT scan dataset titled SARS-CoV-2, which is available at [23]. It contains 2481 CT scan images of both sexes collected from hospitals in Sao Paulo, Brazil. Of these CT scans, 1252 were COVID-19 positive, and 1229 were COVID-19 negative (not normal).
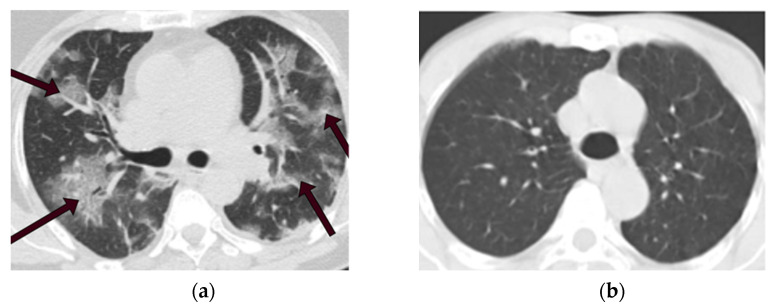
These CT scan images are in PNG format with 104 × 119 to 416 × 512 spatial resolution. We selected 1229 images from each category to make the data balanced perfectly. Figure 2a displays a CT scan of a COVID-19 patient in this dataset, the area indicated by the arrows is infected with COVID-19. In contrast, a CT scan of a non-COVID-19 patient is depicted in Figure 2b. Table 1 indicates information on CT images used in this study.
Figure 2.
CT scans of COVID-19 and non-COVID-19 patients. (a) CT scan of a COVID-19 patient. (b) CT scan of a non-COVID-19 (not normal) patient.
Table 1.
Information of the selected main Chest CT scan dataset.
| Classes | Numbers of Samples | Format |
|---|---|---|
| COVID-19 | 1229 | PNG |
| Non-COVID-19 | 1229 | PNG |
2.1.2. Alternative Dataset
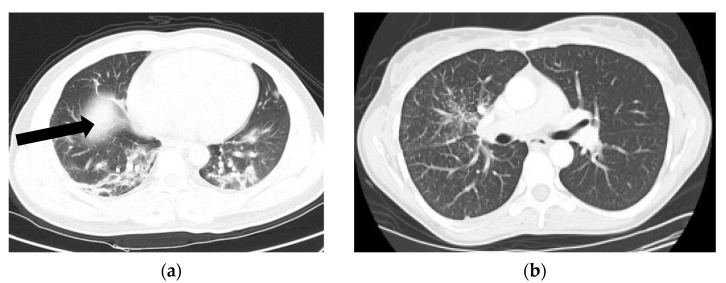
In order to prove the generalization of the proposed deep learning models, another public CT dataset named COVIDx CT-2A [24] has been applied in this paper as shown in Figure 3. CT images numbering with PNG format have been randomly selected from COVID-19 and non-COVID-19 data. Table 2 indicates information on CT images used in this study.
Figure 3.
CT scans of COVID-19 and non-COVID-19 patients. (a) CT scan of a COVID-19 patient. (b) CT scan of a non-COVID-19 (not normal) patient.
Table 2.
Information of the selected alternative Chest CT scan dataset.
| Classes | Numbers of Samples | Format |
|---|---|---|
| COVID-19 | 349 | PNG |
| Non-COVID-19 | 349 | PNG |
2.1.3. DICOM Format Dataset
The chest CT scan technology captures a series of sequential images from the patient’s lung. The infected spots may present in some images but not in others in an image series; for example, the lung is closed at the start and end of each CT scan image series. In order to detect COVID-19 symptoms effectively, a sample of data that indicated that the interior of the lung was clearly apparent in them is needed. Thus, to choose an image from each patient’s chest sequence images for training and validation purposes, only images in the middle of the CT sequence can be selected. Some previous methods of automatically selecting images inside the lung that are visible from a CT sequence have been used in [25].
If a user utilizes a CT dataset with DICOM format, a Python program of converting DICOM format to PNG can be executed as follows to feed the deep learning model:
Step 1: Read the DICOM image with the dicom.read_file() function.
Step 2: Translate the rescale slope and intercept information from the DICOM image header.
Step 3: Display the image in the proper range by using window (1500) level (−600) and width information from the image header.
Step 4: Convert the DICOM image to PNG format using the cv2.convertScaleAbs() function.
2.2. Data Preprocessing
First of all, the dataset (the selected chest CT scan dataset) is randomly split into training, validation, and testing sets with 60%, 20%, and 20%, respectively. Secondly, to train the deep learning model appropriately, we rescale the pixel values of images to the range of [0, 1] from [0, 255] due to the pixel-value representation required in image processing [26], which can be described as follows:
| (1) |
where and represent pixel values of 0 and 255, and and are the new pixel values of 0 and 1. This pixel-value rescaling approach is conducted in all training, validation, and testing datasets.
Further, the deep learning network requires fixed-sized data; thus, the sizes of all CT images are rescaled to 224 × 224 to meet the input size requirement [27]. Moreover, a larger dataset in deep learning may yield higher classification accuracy than a smaller dataset. However, having a large dataset is not always practical [28,29,30,31]. Thus, a data augmentation approach is used to increase the volume of data without acquiring new images [32]. To augment CT scan images used in this work, we perform geometric alterations such as picture rotation and flipping.
2.3. Modelling
2.3.1. Transfer Learning Models
Given the shortage of CT scans of COVID-19 patients, training a Convolutional Neural Network (CNN) from scratch may be challenging. To overcome this difficulty, we use transfer learning techniques and a range of pre-trained models [33]. The primary advantage of transfer learning is that it can train data with fewer samples and less time [34]. The knowledge learned from the previously trained model can be transferred to the newly trained model [35].
Sixteen widely used CNN models are chosen to perform transfer learning for the COVID-19 recognition task: VGG16, InceptionV3, ResNet50, ResNet152V2, ResNet101, ResNet101V2, DenseNet201, MobileNetV3 small, MobileNet, MobileNetV2, VGG19, ResNet50V2, XceptionNet, InceptionResNetV2, NASNet, and EfficientNet. The reason for selecting these models is that they are effective in computer vision. Many of them have been reported to function well in medical diagnostics [36,37].
These models have been pre-trained on the ImageNet dataset for classification purposes. ImageNet is a freely accessible image database that contains 14 million photos classified into 20,000 categories [38]. Due to the enormous dataset utilized to train these sixteen models, the learning weights of these models may be used to recognize pictures in the medical sector. The above sixteen models are used as the base models. Thus, the feature extraction layers (convolutional and pooling layer pairs) are frozen to keep their ImageNet-optimized weights, avoiding information loss and maximizing feature extraction capabilities for future COVID-19 tasks training. Then, the initial fully connected layers of the pre-trained models are trimmed, and the following layers are added to classify COVID-19 CT scans:
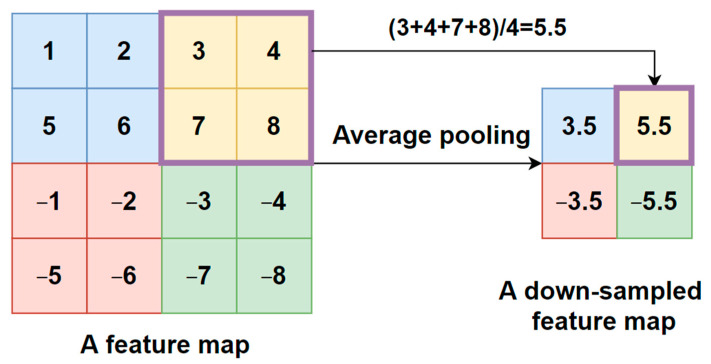
- An average pooling layer, which produces a down-sampled feature map by averaging the values of all pixels in each batch of the feature map, and the calculating procedure is shown in Figure 4. The output size of the pooling layer is calculated as follows:
where represents the input size of the pooling operation. is the size of the pooling filter. is the stride size;(2) A flattened layer to convert the down-sampled feature map to a one-dimensional array;
- A fully connected layer with 64 filters and a Rectified Linear Unit (ReLU) activation to connect each neuron in layers before and after. ReLU helps to solve the problem of vanishing gradients. It is calculated using the equation below.
(3) A dropout layer with a 0.5 dropout ratio to mitigate model overfitting problems;
Figure 4.
Average pooling procedure.
These newly added layers within the modified models are trained using the COVID-19 dataset. After each training epoch, the models are validated against a validation set. Since this research examines a binary classification problem (COVID-19 and non-COVID-19 classes), the number of neurons at the output layer was, thus, set to two. Figure 5 shows the modified architecture of the sixteen pre-trained models used in this research.
Figure 5.
The architecture of the modified pre-trained model.
2.3.2. The Proposed EDNC Architectures
The accuracy of disease prediction is critical in the medical field since erroneous choices result in high expenses and risks to human life. The drawback of using the predictions of several deep learning classifiers independently is that they have a significant degree of variation. Because each model is designed differently and trained independently, they update their weights separately and provide inconsistent results when asked to categorize the same data. These problems may be addressed by the ensemble of individual models, which will decrease variance, and the ensemble model will be more generalizable than the individual models [43].
The ensemble deep neural network for COVID-19 recognition (EDNC) models are proposed based on the combination of three pre-trained models. Three out of sixteen best-performing pre-trained models are chosen to execute the ensemble. Similarly to the individual transfer learning model, feature extraction layers in each of the three pre-trained models were set to be untrainable, preventing the weights from being changed in new model training. The next section details the architectures of three types of combined models.
F-EDNC
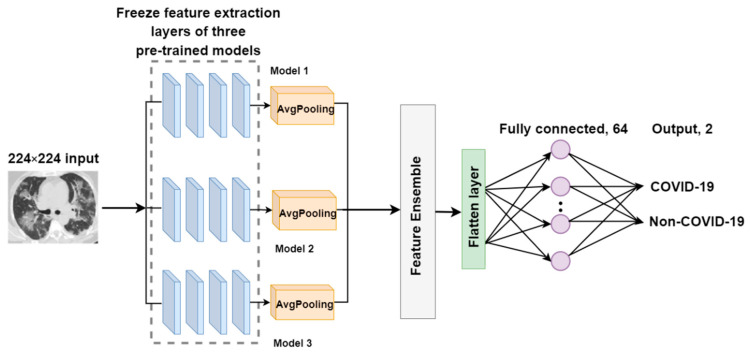
The primary goal of the feature-ensemble deep neural network for COVID-19 recognition (F-EDNC) is to group more characteristics from the input to the model. Thus, this proposed feature-ensemble technique produces a dataset that combines all desired features in the same CT scan input. It comprises three pre-trained models with the highest accuracy for identifying COVID-19 images. Assume to be the input COVID-19 image dataset, then we have the following:
| (5) |
where are the feature extracted by the transfer learning models from the same input . In this case, is 3.
Therefore, the feature ensemble from different pre-trained models can be represented as follows.
| (6) |
These three models were trimmed after feature extraction layers with average pooling layers added. Following that, an ensemble layer was created to merge the outputs of these three feature extraction layers to obtain more precise data with respect to feature information. Then, three layers were added to complete the feature ensemble model: a flatten layer, a fully connected layer, and an output layer. The loss function we used for our model is categorical cross-entropy, which can be represented as the following equation:
| (7) |
where represents the label, are the target values, and are the predicted values.
The architecture of the F-EDNC model is illustrated in Figure 6.
Figure 6.
The architecture of the F-EDNC model.
FC-EDNC
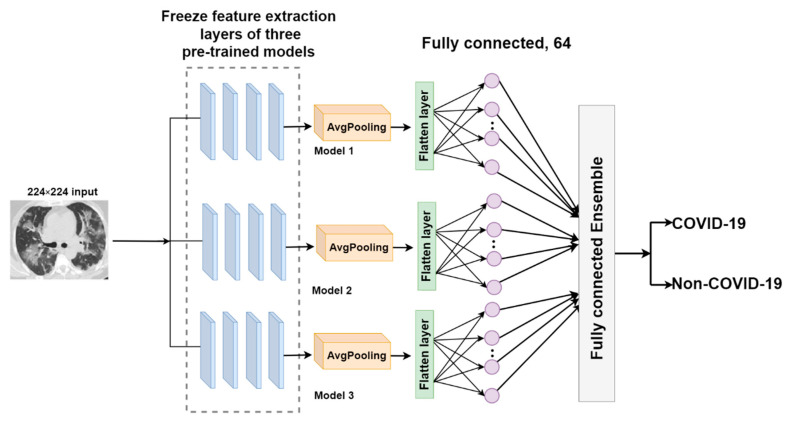
The fully connected-ensemble deep neural network for COVID-19 (FC-EDNC) combines the fully connected layers of three pre-trained models to create an ensemble model with 386 trainable parameters. The output of fully connected layer of the pre-trained models will be utilized as a distinct input for this proposed model. In this case, is 3.
| (8) |
Therefore, the fully connected layer ensemble from different pre-trained models can be represented as follows.
| (9) |
The output of fully connected layers is concatenated to generate a more accurate probability of identifying COVID-19 CT scans. The architecture of the FC-EDNC model is indicated in Figure 7.
Figure 7.
The architecture of the FC-EDNC model.
O-EDNC
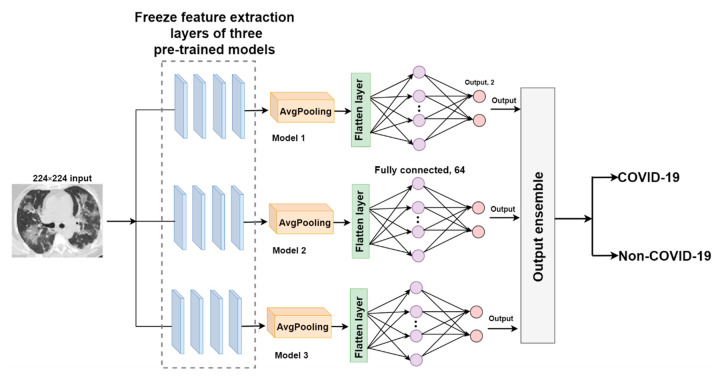
The output-ensemble deep neural network for COVID-19 (O-EDNC) approach is accomplished by assemble three pre-trained models at the output layer with 14 trainable parameters. This method can be represented as follows:
| (10) |
where are the outputs of individual pre-trained models.
Thus, the output layer ensemble from different pre-trained models can be represented as follows.
| (11) |
This method assumes that the ensembled model may learn more characteristics in this merged output to make more precise predictions. The architecture of the O-EDNC model is shown in Figure 8.
Figure 8.
The architecture of the O-EDNC model.
2.3.3. CANet: A Self-Build CNN Model for Comparative Analysis
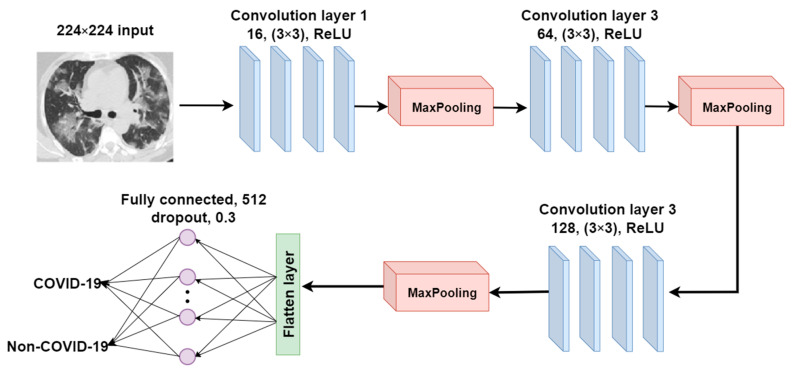
We proposed a CNN model and built it from scratch to compare it with the pre-trained and ensemble models in terms of model performance, training time, and model complexity in the COVID-19 recognition task. This proposed CNN model, CANet, is constructed using three convolutional and max-pooling layers, as shown in Figure 8. The 2D convolutional operation can be written as follows:
| (12) |
where represents the input image, is the kernel, and * represents the convolution operation. The number of filters in the first convolutional layer is set to 16 and raised to 64 and 128 in subsequent convolutional layers. The filter’s size is set to 3 ∗ 3. Each activation unit in the convolution layers has been implemented using ReLU activation. The output size of the convolutional layer is calculated using the following equation:
| (13) |
where represents the input size of the convolution operation. is the size of the convolution filter. is the stride size, and is the padding size. The architecture of the CANet model is shown in Figure 9.
Figure 9.
The architecture of the CANet model.
Three layers (a flatten layer, a fully connected layer, and a dropout layer) and a Softmax activation function are added to complete this CNN architecture. The model is trained and assessed in 50 epochs using the same COVID-19 dataset as the transfer learning models.
2.4. Localhost Web Application Development
2.4.1. Web Application Workflow
A web application is built based on the Flask framework, enabling users to upload their CT images easily and to obtain their COVID-19 results quickly. The architecture of the frontend and backend of COVID-19 recognition system is shown in Figure 10.
Figure 10.
The architecture of the COVID-19 recognition system.
The following steps detail the functionality of the web application.
Step 1. The user visits the web application and uploads a CT image.
Step 2. The submitted picture is sent to the backend to which the proposed F-EDNC model is supplied. The image is resized to 224*224 and is converted to a NumPy array containing the pixel intensities before feeding into the model.
Step 3. The F-EDNC model has been saved in HDF5 format in the backend and is loaded by the model.load() function to process the input image.
Step 4. The output is calculated by the predict() function with the NumPy size array (2,1), which contains the two classes of probability. The highest probability class is then retrieved.
Step 5. The result is displayed at the front end.
2.4.2. Technology Used in Building the Localhost Web Application
Technologies such as Python, Keras, Tensorflow, NumPy, and Pandas are used in building the backend model. The Flask framework routes the web page and hosts the web server in Python. The advantage of using Flask is that it can build a web application in one single python file; moreover, it reduces the work of coding in JavaScript and jQuery. To develop a web application that recognizes CT scan images, we create two routes on the flask application: an index page route for the users to upload their image file and a predicted route to predict the saved model. Furthermore, Bootstrap was utilized as a CSS stylesheet in building a webpage. Bootstrap is a CSS framework that provides some pre-built CSS classes. It can help incorporate responsive web pages in the web application so that our web pages can work well on mobile browsers.
2.5. Model Evaluation
2.5.1. Experimental Setup
The networks are implemented on Jupiter notebook with Python 3.7 (Python Software Foundation, Leicester, UK), TensorFlow 2.4.0 (Google, Leicester, UK), Keras 2.3.1 (François Chollet, Leicester, UK), and Scikit-Learn 0.20.4 (David Cournapeau, Leicester, UK). They are trained on a PC with Intel CPU Xeon E5–2680 v2, 16 GB RAM (Intel, Leicester, UK), and Nvidia GPU RTX2070S (Nvidia, Leicester, UK). The web application is developed with Flask 1.0.2 (Pallets, Leicester, UK).
2.5.2. Confusion Matrix
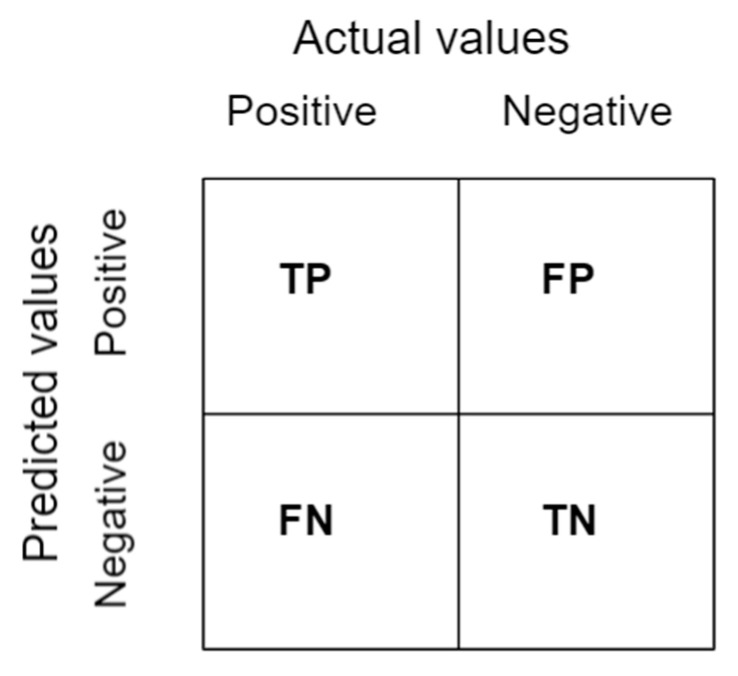
A confusion matrix is a table as shown in Figure 11 that summarizes the results of a classification problem prediction [44]. The number of right and wrong predictions is combined and classified in four distinct ways as follows:
Figure 11.
A representation of the confusion matrix.
True Positive (TP): The prediction and the actual outputs are both positive.
False Positive (FP): The prediction is positive, but the actual output is negative.
True Negative (TN): Both the prediction and the real result are negative.
False Negative (FN): There is a negative prediction, while the actual result is positive.
2.5.3. Classification Metrics
The following five metrics were used to evaluate the model’s performance [44]:
Accuracy refers to the ratio of correct to incorrect predictions.
| (14) |
Precision indicates the accuracy of which a model classifies a sample as positive.
| (15) |
Sensitivity refers to a model’s ability to recognize positive samples.
| (16) |
F1-Scores measures precision and recall in a balanced manner.
| (17) |
Specificity counts the number of negative samples that have been identified as such.
| (18) |
3. Results
3.1. Results of Sixteen Modified Pre-Trained Models
The main dataset is randomly partitioned into training, validation, and test subsets with 60%, 20%, and 20%, respectively. The proposed models are trained using training data and validated against the validation set after each training cycle. Then, we use the testing dataset to evaluate the models and quantify the performance of the models using evaluation metrics.
3.1.1. Classification Results
As observed in Table 3, the pre-trained models MobileNet, DenseNet201, and ResNet50V2 ranked top 3 on the prediction accuracy with 95.71%, 93.47%, and 93.47%, followed by ResNet101V2, ResNet152V2, MobileNetV2, and NASNet, all of which are achieved greater than 90% accuracy. Other models such as InceptionResNetV2, VGG16, Xception, InceptionV3, and VGG19 provided acceptable results with more than 80% accuracy. ResNet50 and ResNet101 achieved approximately 73% accuracy, whereas the worst outcomes were obtained by MobileNetV3Small and EfficientNetB7, which provided an accuracy of 50%. Other measures such as precision, recall, and F1 score are detailed in Table 3.
Table 3.
Result for modified pre-trained models of main dataset in one holdout run. Bold means these three models have the highest accuracy.
| Model | Accuracy | Precision | Sensitivity | F1 | Specificity |
|---|---|---|---|---|---|
| DenseNet201 | 0.9347 | 0.9388 | 0.9312 | 0.9350 | 0.9383 |
| VGG16 | 0.8857 | 0.8531 | 0.9127 | 0.8819 | 0.8621 |
| InceptionV3 | 0.8776 | 0.8082 | 0.9384 | 0.8684 | 0.8315 |
| ResNet50 | 0.7265 | 0.7265 | 0.7265 | 0.7265 | 0.7265 |
| ResNet50V2 | 0.9347 | 0.9224 | 0.9456 | 0.9339 | 0.9243 |
| ResNet152V2 | 0.9265 | 0.9102 | 0.9409 | 0.9253 | 0.9170 |
| Xception | 0.8898 | 0.8367 | 0.9361 | 0.8836 | 0.8524 |
| VGG19 | 0.8837 | 0.9020 | 0.8701 | 0.8858 | 0.8983 |
| ResNet101 | 0.7306 | 0.5429 | 0.8693 | 0.6684 | 0.6716 |
| ResNet101V2 | 0.9327 | 0.9143 | 0.9492 | 0.9314 | 0.9173 |
| NASNet | 0.9061 | 0.8694 | 0.9383 | 0.9025 | 0.8783 |
| MobileNetV2 | 0.9265 | 0.9796 | 0.8856 | 0.9302 | 0.9772 |
| MobileNet | 0.9571 | 0.9184 | 0.9956 | 0.9554 | 0.9242 |
| MobileNetV3Small | 0.5000 | 0 | 0 | 0 | 0.5000 |
| InceptionResNetV2 | 0.8959 | 0.8694 | 0.9181 | 0.8931 | 0.8760 |
| EfficientNetB7 | 0.5000 | 1.0000 | 0.5000 | 0.6667 | 0 |
3.1.2. Confusion Matrix Results
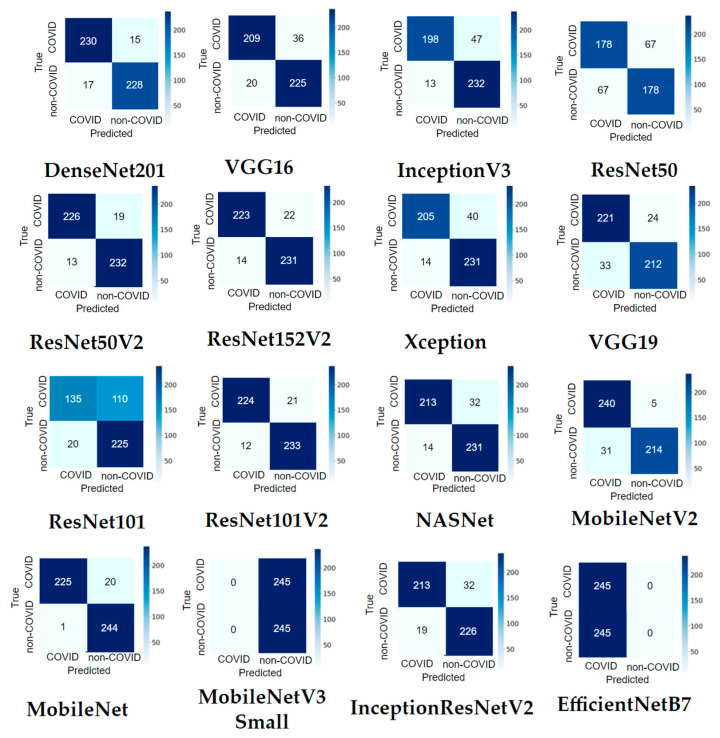
It can be observed from Figure 12 that most pre-trained models perform well in recognizing COVID-19 and non-COVID-19 CT scans. MobileNet only misclassified 21 out of 490 images (95.71% accuracy). ResNet50V2 and DenseNet201 made both 32/490 misclassifications (93.47% accuracy). MobileNet correctly identified 244 out of 245 non-COVID-19 images, and only one was misclassified (99.59% accuracy). MobileNetV2 recognized 240 of 245 COVID-19 images, with only five images that were not recognized (97.96% accuracy).
Figure 12.
Confusion matrix result of the main dataset for sixteen modified pre-trained models in one hold-out run.
3.1.3. Learning Curve Results
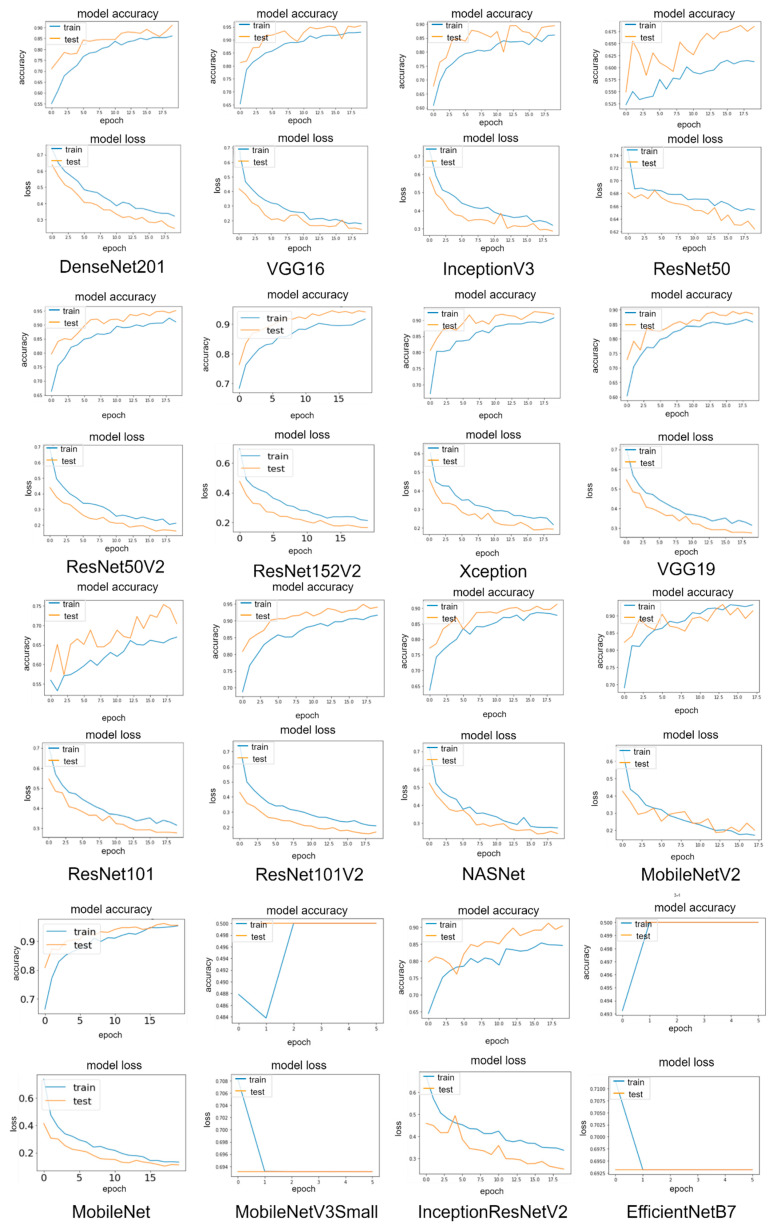
Accuracy and loss curves for sixteen pre-trained models during training and validation periods are shown in Figure 13. The graphs show that the MobileNet has the lowest loss rate of 11.17% and the highest accuracy rate of 95.51%, followed by DenseNet201 and ResNet50V2 with loss rates of 15.93% and 22.59%, respectively. It can be observed that all validation curves exhibit oscillations compared to the training curve. This is because the size of the validation dataset is relatively small compared to the training dataset for the model to learn. The plot also indicated that all validation data resulted in better accuracy and a lower loss rate than the training data, suggesting that the models learn better on the validation dataset than the training dataset. This is because a dropout of 0.5 is used in model training, which means 50% of the features are set to zero, whereas all neurons are used in the validation, which results in better validation accuracy.
Figure 13.
Learning curves of the main dataset for sixteen modified pre-trained models in one hold-out run.
3.2. Results of EDNC Models
3.2.1. Classification Results
Three ensemble strategies have been applied for recognizing COVID-19 CT images. It has been shown in Table 4 that all three EDNC models outperform individual pre-trained models in predicting COVID-19 lung infections. The accuracy, precision, specificity, and F1-score were improved by 4.08%, 6.03%, 5.72%, and 3.74%, respectively. However, pre-trained MobileNet still holds the most significant sensitivity of 99.56%. Among three ensemble models, the F-EDNC model obtained the best accuracy of 97.55%, and the highest recall of 96.41%. At the same time, FC-EDNC holds the highest F1-score of 97.18%, the highest specificity score of 98.33%, and the highest precision score of 98.37%. The CANet model received an accuracy of 91.63%, outperforming most of the pre-trained models. The classification results using the alternative dataset can be found in Table 5. It shows that the F-EDNC obtained the best accuracy of 97.83% and the highest sensitivity score of 100%.
Table 4.
Comparison of test result for pre-trained and ensemble model for main dataset in one holdout run. Bold indicates the model holds the highest accuracy.
| Model | Accuracy | Precision | Sensitivity | F1 | Specificity |
|---|---|---|---|---|---|
| ResNet50V2 | 0.9347 | 0.9224 | 0.9456 | 0.9339 | 0.9243 |
| DenseNet201 | 0.9347 | 0.9388 | 0.9312 | 0.9350 | 0.9383 |
| MobileNet | 0.9571 | 0.9184 | 0.9956 | 0.9554 | 0.9242 |
| F-EDNC | 0.9755 | 0.9787 | 0.9641 | 0.9713 | 0.9814 |
| O-EDNC | 0.9632 | 0.9551 | 0.9710 | 0.9795 | 0.9630 |
| FC-EDNC | 0.9714 | 0.9837 | 0.9602 | 0.9718 | 0.9833 |
| CANet | 0.9163 | 0.9061 | 0.925 | 0.9155 | 0.908 |
Table 5.
Comparison of test result for pre-trained and ensemble model for the alternative dataset in one holdout run. Bold means it outperformed other models.
| Model | Accuracy | Precision | Sensitivity | F1 | Specificity |
|---|---|---|---|---|---|
| ResNet50V2 | 0.9565 | 0.9710 | 0.9436 | 0.9571 | 0.9701 |
| ResNet152V2 | 0.9510 | 0.9347 | 0.9347 | 0.9502 | 0.9673 |
| MobileNet | 0.9710 | 0.9420 | 1.0000 | 0.9701 | 0.9452 |
| F-EDNC | 0.9783 | 0.9565 | 1.0000 | 0.9778 | 0.9583 |
| O-EDNC | 0.9710 | 0.9420 | 1.0000 | 0.9701 | 0.9452 |
| FC-EDNC | 0.9783 | 0.9714 | 0.9602 | 0.9734 | 0.9602 |
| CANet | 0.9237 | 0.9168 | 0.9205 | 0.9223 | 0.9115 |
3.2.2. Confusion Matrix Results
It can be observed from the confusion matrix in Figure 14 that the numbers of misclassifications with proposed ensemble models have been significantly reduced compared to the numbers with the single pre-trained model. The proposed F-EDNC has only misclassified 12 CT scans out of 490 CT images (97.55% accuracy). The FC-EDNC model successfully classified 476 out of 490 CT images (97.14% accuracy), and O-EDNC correctly identified 472 CT images (96.32% accuracy). The CANet model misclassified 41 CT images (91.63% accuracy), which did not perform well compared to the ensemble models.
Figure 14.
Confusion matrix result for EDNC and CANet models in one hold-out run.
3.2.3. False Discovery Rate Results
False discovery rate (FDR) means the percentage of all false discoveries, for example, the percentage of false discoveries in the calculation of all discoveries. The formula of FDR is as follows.
| (19) |
Table 6 indicates the FDR of three pre-trained models and all ensemble models, it can be observed that F-EDNC obtained the lowest FDR with 1.22%.
Table 6.
False discovery rate (FDR) result for pre-trained and ensemble models for the main dataset. Bold shows it has the lowest FDR.
| Model | FDR |
|---|---|
| ResNet50V2 | 0.0775 |
| DenseNet201 | 0.0612 |
| MobileNet | 0.0816 |
| F-EDNC | 0.0122 |
| O-EDNC | 0.0448 |
| FC-EDNC | 0.0163 |
| CANet | 0.0938 |
3.2.4. Learning Curve Results
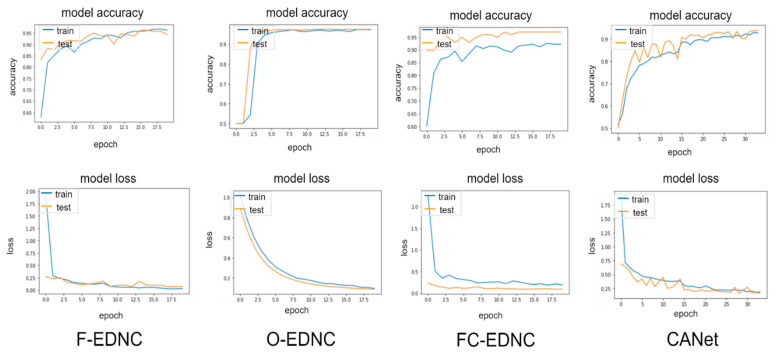
EDNC illustrates much better learning curves than individual pre-trained models, as shown in Figure 15. It can be observed that the F-EDNC model has the lowest loss rate of 3.42% and the highest accuracy rate of 98.92%, followed by O-EDNC and FC-EDNC with loss rates of 8.9% and 18.91% and accuracy rates of 96.89% and 92.18%, respectively. Furthermore, when training and validation loss decreases to a stable stage, the difference between the final training and validation values is minimal in F-EDNC and O-EDNC models, suggesting that F-EDNC and O-EDNC are good fit models. While in FC-ENDC, the gaps between the training and validation values in accuracy and lose curves are not promising.
Figure 15.
Learning curves for EDNC and CANet models in one hold-out run.
The CANet model shows small gaps between validation and training value in the accuracy and loss curve; however, there are oscillations observed in the validation curve, which indicated that the size of the validation sample is too small for CANet to learn. According to the above results, it can conclude that F-EDNC performs best in categorizing chest CT scan images.
3.3. Classification Results of Five Runs for Pre-Trained Model and EDNC Model
To provide a more accurate assessment of model performance than a single validation (hold-out), we implement the process (random dataset-splitting, training, validation, and testing) five times on main dataset, with the findings averaged to obtain a more consistent and reliable result. Table 7 and Table 8 shows the averaged test results of proposed models in five hold-out runs.
Table 7.
Average test result for pre-trained model for the main dataset in five runs. Bold means these three models have the highest accuracy.
| Model | Accuracy | Precision | Sensitivity | F1 | Specificity |
|---|---|---|---|---|---|
| DenseNet201 | 0.9388 | 0.9610 | 0.9231 | 0.9412 | 0.9565 |
| VGG16 | 0.8918 | 0.8612 | 0.8792 | 0.8701 | 0.8692 |
| InceptionV3 | 0.8734 | 0.8490 | 0.8489 | 0.8491 | 0.8560 |
| ResNet50 | 0.7285 | 0.7224 | 0.7314 | 0.7269 | 0.7287 |
| ResNet50V2 | 0.9408 | 0.9306 | 0.9502 | 0.9403 | 0.9320 |
| ResNet152V2 | 0.9224 | 0.8980 | 0.9442 | 0.9205 | 0.9027 |
| Xception | 0.8939 | 0.8410 | 0.9406 | 0.8880 | 0.8571 |
| VGG19 | 0.8776 | 0.8980 | 0.8627 | 0.8800 | 0.8936 |
| ResNet101 | 0.7429 | 0.5673 | 0.8742 | 0.6881 | 0.6798 |
| ResNet101V2 | 0.9306 | 0.9061 | 0.9527 | 0.9289 | 0.8764 |
| NASNet | 0.8980 | 0.8530 | 0.9372 | 0.8931 | 0.8652 |
| MobileNetV2 | 0.9020 | 0.9836 | 0.8456 | 0.9094 | 0.9805 |
| MobileNet | 0.9510 | 0.9383 | 0.9661 | 0.9520 | 0.9407 |
| MobileNetV3Small | 0.5000 | 0 | 0 | 0 | 0.5000 |
| InceptionResNetV2 | 0.9020 | 0.8776 | 0.9227 | 0.8996 | 0.8832 |
| EfficientNetB7 | 0.5000 | 1.0000 | 0.5000 | 0.6667 | 0 |
Table 8.
Average test result for pre-trained and ensemble model for the main dataset in five runs. Bold indicates the model holds the highest accuracy.
| Model | Accuracy | Precision | Sensitivity | F1 | Specificity |
|---|---|---|---|---|---|
| ResNet50V2 | 0.9408 | 0.9306 | 0.9502 | 0.9403 | 0.9320 |
| DenseNet201 | 0.9388 | 0.9610 | 0.9231 | 0.9412 | 0.9565 |
| MobileNet | 0.9510 | 0.9383 | 0.9661 | 0.9520 | 0.9407 |
| F-EDNC | 0.9775 | 0.9755 | 0.9795 | 0.9775 | 0.9756 |
| O-EDNC | 0.9612 | 0.9592 | 0.9631 | 0.9611 | 0.9593 |
| FC-EDNC | 0.9755 | 0.9836 | 0.9679 | 0.9757 | 0.9834 |
| CANet | 0.9224 | 0.9347 | 0.9124 | 0.9234 | 0.9331 |
3.4. Training Time and Model Size Results
It can be observed from Table 9 that MobileNet used the smallest amount of time to complete one epoch training. At the same time, EfficientNetB7 consumed 34 s, which is the most considerable amount of time to finish one epoch training. The sizes of each model weight are shown in Table 4 as well. It can be observed that MobileNetV3Small has the smallest size of 13.26 MB, whereas the proposed F-EDNC has the most considerable model size of 377.2 MB.
Table 9.
Training time and weights comparison of all models in the main dataset.
| Pre-Trained Model | Accuracy | Training Time (Second/Epoch) | Parameters (MB) |
|---|---|---|---|
| DenseNet201 | 0.9347 | 30 | 84.37 |
| VGG16 | 0.8857 | 26 | 63.08 |
| InceptionV3 | 0.8776 | 26 | 90.01 |
| ResNet50 | 0.7265 | 27 | 103.99 |
| ResNet50V2 | 0.9347 | 26 | 103.9 |
| ResNet152V2 | 0.9265 | 28 | 237.5 |
| Xception | 0.8898 | 27 | 93.48 |
| VGG19 | 0.8837 | 26 | 79.87 |
| ResNet101 | 0.7306 | 28 | 177.19 |
| ResNet101V2 | 0.9327 | 29 | 177.08 |
| NASNet | 0.9061 | 32 | 25.26 |
| MobileNetV2 | 0.9265 | 27 | 17.52 |
| MobileNet | 0.9571 | 25 | 19.33 |
| MobileNetV3Small | 0.5000 | 28 | 13.26 |
| InceptionResNetV2 | 0.8959 | 30 | 213.77 |
| EfficientNetB7 | 0.5000 | 34 | 263.42 |
| F-EDNC (Ours) | 0.9755 | 31 | 377.2 |
| O-EDNC (Ours) | 0.9632 | 31 | 337.24 |
| FC-EDNC (Ours) | 0.9714 | 31 | 348 |
| CANet (Ours) | 0.9163 | 26 | 338.7 |
3.5. Model Deployment Result
We deployed our COVID-19 recognition system in a localhost web application for users to use. The F-EDNC model was chosen to be deployed because it has the highest average of accuracy, precision, sensitivity, specificity, and F1-score.
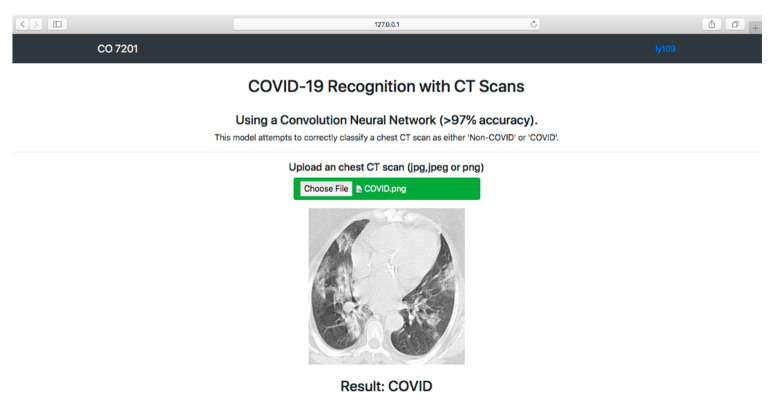
As shown in Figure 16, a simple HTML web page was created to allow users to obtain COVID-19 results. Users can upload CT scan images by clicking the “Choose File” button. Once the users hit the “Predict!” button, the image will be sent to the system backend, where the proposed model can use the input image to predict the COVID-19 condition. The results (COVID-19 or Non-COVID-19) will be displayed on the front end. (The code is available at https://github.com/rgiol/code, access date: 4 January 2022).
Figure 16.
Overview of the frontend of the localhost web application.
4. Discussion
Using deep learning approaches for recognizing COVID-19 disease is a hot topic that has sparked much attention recently. In this field, exciting results have been shown and continue to emerge while simultaneously utilizing various neural networks. CT scan images are among the critical dataset types used to identify COVID-19 symptoms. Numerous deep learning models have been created and effectively deployed for identifying COVID-19.
In this study, twenty state-of-the-art techniques were selected for comparison purposes. After reviewing their methods and findings, we believe that there are still several research gaps in COVID-19 recognition compared to our study. Some of the most critical ones are listed as follows:
The majority of studies utilized a dataset of only a few hundred COVID-19 images, which is inadequate for developing accurate and robust deep learning methods. Insufficient data may affect the performance of proposed methods.
In most studies, there was a data imbalance problem, with one class having more images than the other. This affects the accuracy of models.
Additionally, there are still some other pre-trained models that have not been utilized in COVID-19 classification.
The impact of different ensemble methods has not received adequate attention in COVID-19 research. It should be emphasized that these techniques are beneficial in both improving performances and dealing with uncertainty associated with deep learning models.
In none of the studies was there a webpage set up for users to upload images and to obtain COVID-19 predictions.
In contrast, our study used a perfectly balanced CT scan dataset with more than two thousand chest CT images. Sixteen pre-trained deep learning models have been investigated, including those not employed in the COVID-19 detection area. Furthermore, three ensemble models have been proposed to recognize COVID-19 CT images. The findings of each model are summarized in Table 10. The model proposed in our study outperforms most of the existing classifiers.
Table 10.
Comparison with state-of-the-art approaches.
| Author | Architecture | Accuracy | F1 | Recall | Precision |
|---|---|---|---|---|---|
| Matsuyama, E. [17] | ResNet50 + wavelet coefficients | 92.2% | 91.5% | 90.4% | / |
| Loey, M. [18] | ResNet50 + augumentation + CGAN | 82.91% | / | 77.66% | / |
| Do, C. [19] | Modified DenseNet201 | 85% | / | 79% | 91% |
| Polsinelli, M. [20] | Modified SqueezeNet | 85.03% | 86.20% | 87.55% | 85.01% |
| Panwar, H. [45] | Modified VGG19 | 94.04 | |||
| Mishra, A. [46] | Modified DenseNet121, ResNet50, VGG16, InceptionV3 and DenseNet201 | 88.3% | 86.7% | 90.15% | |
| Ko, H. [21] | Modified VGG16, ResNet-50, Inception-v3, and Xception | 96.97% | |||
| Maghdid, H. [22] | Modified Alexnet, A self-build CNN | 94.1% | 100% | ||
| Arora, V. [47] | Modified MobileNet, DenseNet121, ResNet50, VGG16, InceptionV3 and XceptionNet |
94.12% | 96.11% | 96.11% | 96.11% |
| Alshazly. H. [48] | CovidResNet and CovidDenseNet | 93.87% | 95.70 | 92.49 | 99.13% |
| Yu, Z. [49] | Modified InceptionV3, ResNet50, ResNet-101, DenseNet201 |
95.34% | |||
| Jaiswal, A. [50] | Modified DenseNet201 | 96.25% | 96.29% | 96.29% | 96.29% |
| Sanagavarapu, S. [51] | Ensembled ResNets | 87% | 84% | 81% | 91% |
| Song, J. [52] | A large-scale bi-directional generative adversarial network | 92% | |||
| Sarker, L [53] | Modified Densenet121 | 96.49% | 96% | 96% | 96% |
| Shan, F. [54] | VB-Net | 91.6% | |||
| Wang, S. [55] | Modified DenseNet | 85% | 90% | 79% | |
| Gozes, O. [56] | Modified ResNet50 | 94% | |||
| Wang, S. [57] | Modified Inception | 79.3% | 63% | 83% | |
| Li, L. [58] | Modified RestNet50 | 90% | |||
| Proposed | EDNC | 97.75% | 97.75% | 97.95% | 97.55% |
5. Conclusions
This paper applies transfer learning methodology to modify and build sixteen deep learning models for COVID-19 recognition with the help of chest CT scans. Three ensemble deep neural networks (F-EDNC, FC-EDNC, and O-EDNC) were proposed further to enhance the performance of those sixteen deep learning models with a dataset containing 2458 CT scans. CANet, a self-build CNN model, has been designed and trained on the same dataset. The performances of the proposed EDNC have been evaluated and compared to CANet and the sixteen modified pre-trained models. The results have shown that EDNC outperformed the pre-trained models and CANet in COVID-19 image classification performance.
Among the results, F-EDNC achieves an accuracy of 97.75%, a sensitivity of 97.95%, a precision of 97.55%, a specificity of 97.56%, and an F1 score of 97.75%. Additionally, the proposed F-EDNC is deployed through a web application, enabling users to easily use the COVID-19 recognition system. Despite the excellent performance of the proposed COVID-19 recognition system, this study has several limitations. Firstly, if a user conducts the process of deriving a 2D image from a 3D CT scan, the classification result may vary depending on the selection of the 2D image. Secondly, this study has not utilized other preprocessing techniques such as image enhancement. In future work, image enhancement technology may be used to determine whether there is room for the improvement of results. In this study, the proposed EDNC significantly improved COVID-19 recognition performance, indicating the possibility of a completely automated and quick diagnosis of COVID-19 using deep learning. This finding will save time and money for health-care professionals in screening COVID-19 infections.
Author Contributions
Conceptualization, Y.-D.Z. and L.Y.; methodology, L.Y.; software, L.Y.; validation, Y.-D.Z., S.-H.W. and L.Y.; formal analysis, S.-H.W., Y.-D.Z. and L.Y.; data curation, L.Y.; writing—original draft preparation, L.Y., Y.-D.Z. and S.-H.W.; writing—review and editing, Y.-D.Z.; visualization, L.Y.; supervision, Y.-D.Z.; project administration, Y.-D.Z. and S.-H.W.; funding acquisition, Y.-D.Z. and S.-H.W. All authors have read and agreed to the published version of the manuscript.
Funding
The paper is partially supported by Hope Foundation for Cancer Research, UK (RM60G0680); Royal Society International Exchanges Cost Share Award, UK (RP202G0230); Medical Research Council Confidence in Concept Award, UK (MC_PC_17171); British Heart Foundation Accelerator Award, UK (AA/18/3/34220); Sino-UK Industrial Fund, UK (RP202G0289); Global Challenges Research Fund (GCRF), UK (P202PF11); and LIAS Pioneering Partnerships award, UK (P202ED10).
Institutional Review Board Statement
Not applicable.
Informed Consent Statement
Not applicable.
Data Availability Statement
https://www.kaggle.com/plameneduardo/sarscov2-ctscan-dataset (accessed on 20 August 2021).
Conflicts of Interest
The authors declare no conflict of interest.
Footnotes
Publisher’s Note: MDPI stays neutral with regard to jurisdictional claims in published maps and institutional affiliations.
References
- 1.WHO Coronavirus (COVID-19) Dashboard. [(accessed on 20 August 2021)]. Available online: https://Covid19.who.int.
- 2.MRT The WHO Believes That We Have Already Traveled “60% of the Way” in the Fight against COVID-19. [(accessed on 11 October 2021)]. Available online: https://marketresearchtelecast.com/the-who-believes-that-we-have-already-traveled-60-of-the-way-in-the-fight-against-COVID-19/175989.
- 3.Weekly Epidemiological Update on COVID-19-31 August 2021. [(accessed on 1 September 2020)]. Available online: https://www.who.int/publications/m/item/weekly-epidemiological-update-on-COVID-19---31-August-2021.
- 4.Fisman D.N., Tuite A.R. Evaluation of the relative virulence of novel SARS-CoV-2 variants: A retrospective cohort study in Ontario, Canada. CMAJ. 2021;193:E1619–E1625. doi: 10.1503/cmaj.211248. [DOI] [PMC free article] [PubMed] [Google Scholar]
- 5.Sanderson K. COVID Vaccines Protect against Delta, but Their Effectiveness Wanes. [(accessed on 11 October 2021)]. Available online: https://www.nature.com/articles/d41586-021-02261-8. [DOI] [PubMed]
- 6.Mwai P. COVID-19 Vaccinations: More Than 50 Nations Have Missed a Target Set by the WHO. [(accessed on 11 October 2021)]. Available online: https://www.bbc.com/news/56100076.
- 7.Schaefer G.O. Making Vaccines Available to Other Countries before Offering Domestic Booster Vaccinations. 2021. [(accessed on 15 September 2021)]. Available online: https://jamanetwork.com/journals/jama/fullarticle/2783234. [DOI] [PubMed]
- 8.Bustin S.A., Nolan T. RT-qPCR testing of SARS-CoV-2: A primer. Int. J. Mol. Sci. 2020;21:3004. doi: 10.3390/ijms21083004. [DOI] [PMC free article] [PubMed] [Google Scholar]
- 9.Waller J.V., Kaur P., Tucker A., Lin K.K., Diaz M., Henry T.S., Hope M. Diagnostic tools for coronavirus disease (COVID-19): Comparing CT and RT-PCR viral nucleic acid testing. Am. J. Roentgenol. 2020;215:834–838. doi: 10.2214/AJR.20.23418. [DOI] [PubMed] [Google Scholar]
- 10.Zhang J.-F., Liu J., Ma H.-N., Feng K., Chen Z.-W., Yang L.-S., Mei B. RT-PCR combined with CT examination in the diagnosis and prognosis evaluation of COVID-19 patients in Fangcang hospital: A case series. J. Multidiscip. Health. 2021;14:145–149. doi: 10.2147/JMDH.S293601. [DOI] [PMC free article] [PubMed] [Google Scholar]
- 11.Wu J., Pan J., Teng D., Xu X., Feng J., Chen Y.-C. Interpretation of CT signs of 2019 novel coronavirus (COVID-19) pneumonia. Eur. Radiol. 2020;30:5455–5462. doi: 10.1007/s00330-020-06915-5. [DOI] [PMC free article] [PubMed] [Google Scholar]
- 12.National Institute of Health Computed Tomography (CT) [(accessed on 11 October 2021)]; Available online: https://www.nibib.nih.gov/science-education/science-topics/computed-tomography-ct.
- 13.Ross H. What Is a CT Scan? Procedure, Risks, and Results. [(accessed on 21 August 2021)]. Available online: www.healthline.com/health/ct-scan.
- 14.Esteva A., Chou K., Yeung S., Naik N., Madani A., Mottaghi A., Liu Y., Topol E., Dean J., Socher R. Deep learning-enabled medical computer vision. NPJ Digit. Med. 2021;4:5. doi: 10.1038/s41746-020-00376-2. [DOI] [PMC free article] [PubMed] [Google Scholar]
- 15.Liu X., Faes L., Kale A.U., Wagner S.K., Fu D.J., Bruynseels A., Mahendiran T., Moraes G., Shamdas M., Kern C., et al. A comparison of deep learning performance against health-care professionals in detecting diseases from medical imaging: A systematic review and meta-analysis. Lancet Digit. Health. 2019;1:e271–e297. doi: 10.1016/S2589-7500(19)30123-2. [DOI] [PubMed] [Google Scholar]
- 16.Ahuja A.S. The impact of artificial intelligence in medicine on the future role of the physician. PeerJ. 2019;7:e7702. doi: 10.7717/peerj.7702. [DOI] [PMC free article] [PubMed] [Google Scholar]
- 17.Matsuyama E. A Deep learning interpretable model for novel coronavirus disease (COVID-19) screening with chest CT images. J. Biomed. Sci. Eng. 2020;13:140–152. doi: 10.4236/jbise.2020.137014. [DOI] [Google Scholar]
- 18.Loey M., Manogaran G., Khalifa N.E.M. A deep transfer learning model with classical data augmentation and CGAN to detect COVID-19 from chest CT radiography digital images. Neural Comput. Appl. 2020;32:1–13. doi: 10.1007/s00521-020-05437-x. [DOI] [PMC free article] [PubMed] [Google Scholar]
- 19.Do C.M., Vu L. Applications of Digital Image Processing XLIII. Volume 11510. International Society for Optics and Photonics; San Diego, CA, USA: 2020. An approach for recognizing COVID-19 cases using convolutional neural network applied to CT scan images; p. 1151034. [Google Scholar]
- 20.Polsinelli M., Cinque L., Placidi G. A light CNN for detecting COVID-19 from CT scans of the chest. Pattern Recognit. Lett. 2020;140:95–100. doi: 10.1016/j.patrec.2020.10.001. [DOI] [PMC free article] [PubMed] [Google Scholar]
- 21.Ko H., Chung H., Kang W.S., Kim K.W., Shin Y., Kang S.J., Lee J.H., Kim Y.J., Kim N.Y., Jung H., et al. COVID-19 pneumonia diagnosis using a simple 2D deep learning framework with a single chest CT image: Model development and validation. J. Med. Internet Res. 2020;22:e19569. doi: 10.2196/19569. [DOI] [PMC free article] [PubMed] [Google Scholar]
- 22.Maghdid H.S., Asaad A.T., Ghafoor K.Z.G., Sadiq A.S., Mirjalili S., Khan M.K.K. Multimodal Image Exploitation and Learning 2021. Volume 11734. SPIE; Orlando, FL, USA: 2021. Diagnosing COVID-19 pneumonia from X-ray and CT images using deep learning and transfer learning algorithms; p. 117340E. [Google Scholar]
- 23.PlamenEduardo. SARS-CoV-2 CT-Scan Dataset. [(accessed on 11 October 2021)]. Available online: https://www.kaggle.com/plameneduardo/sarscov2-ctscan-dataset.
- 24.GUNRAJ H. COVIDx CT. 2021. [(accessed on 4 January 2022)]. Available online: https://www.kaggle.com/hgunraj/covidxct.
- 25.Rahimzadeh M., Attar A., Sakhaei S.M. A fully automated deep learning-based network for detecting COVID-19 from a new and large lung CT scan dataset. Biomed. Signal Process. Control. 2021;68:102588. doi: 10.1016/j.bspc.2021.102588. [DOI] [PMC free article] [PubMed] [Google Scholar]
- 26.Bineeth K., Preena K.P. A review on 2D image representation methods. Int. J. Eng. Res. Technol. 2015;4:1075–1081. [Google Scholar]
- 27.Sangaiah A.K. Deep Learning and Parallel Computing Environment for Bioengineering Systems. Academic Press; Cambridge, MA, USA: 2019. [Google Scholar]
- 28.Wang S.-H., Zhang Y., Cheng X., Zhang X., Zhang Y.-D. PSSPNN: PatchShuffle stochastic pooling neural network for an explainable diagnosis of COVID-19 with multiple-way data augmentation. Comput. Math. Methods Med. 2021;2021:6633755. doi: 10.1155/2021/6633755. [DOI] [PMC free article] [PubMed] [Google Scholar] [Retracted]
- 29.Wang S.-H., Nayak D.R., Guttery D.S., Zhang X., Zhang Y.-D. COVID-19 classification by CCSHNet with deep fusion using transfer learning and discriminant correlation analysis. Inf. Fusion. 2021;68:131–148. doi: 10.1016/j.inffus.2020.11.005. [DOI] [PMC free article] [PubMed] [Google Scholar]
- 30.Wang S.-H., Govindaraj V.V., Górriz J.M., Zhang X., Zhang Y.-D. COVID-19 classification by FGCNet with deep feature fusion from graph convolutional network and convolutional neural network. Inf. Fusion. 2021;67:208–229. doi: 10.1016/j.inffus.2020.10.004. [DOI] [PMC free article] [PubMed] [Google Scholar]
- 31.Zhang Y.-D., Satapathy S.C., Zhang X., Wang S.-H. COVID-19 Diagnosis via densenet and optimization of transfer learning setting. Cogn. Comput. 2021;13:1–17. doi: 10.1007/s12559-020-09776-8. [DOI] [PMC free article] [PubMed] [Google Scholar]
- 32.Shorten C., Khoshgoftaar T.M. A survey on image data augmentation for deep learning. J. Big Data. 2019;6:60. doi: 10.1186/s40537-019-0197-0. [DOI] [PMC free article] [PubMed] [Google Scholar]
- 33.Pan S.J., Yang Q. A Survey on transfer learning. IEEE Trans. Knowl. Data Eng. 2010;22:1345–1359. doi: 10.1109/TKDE.2009.191. [DOI] [Google Scholar]
- 34.Zhuang F., Qi Z., Duan K., Xi D., Zhu Y., Zhu H., Xiong H., He Q. A Comprehensive survey on transfer learning. Proc. IEEE. 2021;109:43–76. doi: 10.1109/JPROC.2020.3004555. [DOI] [Google Scholar]
- 35.Weiss K., Khoshgoftaar T.M., Wang D.D. A survey of transfer learning. J. Big Data. 2016;3:1345–1459. doi: 10.1186/s40537-016-0043-6. [DOI] [Google Scholar]
- 36.Kononenko I. Machine learning for medical diagnosis: History, state of the art and perspective. Artif. Intell. Med. 2001;23:89–109. doi: 10.1016/S0933-3657(01)00077-X. [DOI] [PubMed] [Google Scholar]
- 37.Xu J., Xue K., Zhang K. Current status and future trends of clinical diagnoses via image-based deep learning. Theranostics. 2019;9:7556–7565. doi: 10.7150/thno.38065. [DOI] [PMC free article] [PubMed] [Google Scholar]
- 38.Lab S.V. ImageNet. [(accessed on 11 October 2021)]. Available online: https://image-net.org.
- 39.Alzubaidi L., Zhang J., Humaidi A.J., Al-Dujaili A., Duan Y., Al-Shamma O., Santamaría J., Fadhel M.A., Al-Amidie M., Farhan L. Review of deep learning: Concepts, CNN architectures, challenges, applications, future directions. J. Big Data. 2021;8:53. doi: 10.1186/s40537-021-00444-8. [DOI] [PMC free article] [PubMed] [Google Scholar]
- 40.Labach A., Salehinejad H., Valaee S. Survey of dropout methods for deep neural networks. arXiv. 20191904.13310 [Google Scholar]
- 41.Li Z., Liu F., Yang W., Peng S., Zhou J. A survey of convolutional neural networks: Analysis, applications, and prospects. IEEE Trans. Neural Netw. Learn. Syst. 2021;32:1–21. doi: 10.1109/TNNLS.2021.3084827. [DOI] [PubMed] [Google Scholar]
- 42.Wang W., Yang Y. Development of convolutional neural network and its application in image classification: A survey. Opt. Eng. 2019;58:040901. doi: 10.1117/1.OE.58.4.040901. [DOI] [Google Scholar]
- 43.Rajaraman S., Siegelman J., Alderson P.O., Folio L.S., Folio L.R., Antani S.K. Iteratively pruned deep learning ensembles for COVID-19 detection in chest X-rays. IEEE Access. 2020;8:115041–115050. doi: 10.1109/ACCESS.2020.3003810. [DOI] [PMC free article] [PubMed] [Google Scholar]
- 44.Novakovic J.D. Evaluation of classification models in machine learning. Theory Appl. Math. Comput. Sci. 2017;7:39–46. [Google Scholar]
- 45.Panwar H., Gupta P., Siddiqui M.K., Morales-Menendez R., Bhardwaj P., Singh V. A deep learning and grad-CAM based color visualization approach for fast detection of COVID-19 cases using chest X-ray and CT-Scan images. Chaos Solitons Fractals. 2020;140:110190. doi: 10.1016/j.chaos.2020.110190. [DOI] [PMC free article] [PubMed] [Google Scholar]
- 46.Mishra A.K., Das S.K., Roy P., Bandyopadhyay S. Identifying COVID19 from chest CT images: A deep convolutional neural networks based approach. J. Health Eng. 2020;2020:8843664. doi: 10.1155/2020/8843664. [DOI] [PMC free article] [PubMed] [Google Scholar]
- 47.Arora V., Ng E.Y.-K., Leekha R.S., Darshan M., Singh A. Transfer learning-based approach for detecting COVID-19 ailment in lung CT scan. Comput. Biol. Med. 2021;135:104575. doi: 10.1016/j.compbiomed.2021.104575. [DOI] [PMC free article] [PubMed] [Google Scholar]
- 48.Alshazly H., Linse C., Barth E., Martinetz T. Explainable COVID-19 detection using chest CT scans and deep learning. Sensors. 2021;21:455. doi: 10.3390/s21020455. [DOI] [PMC free article] [PubMed] [Google Scholar]
- 49.Yu Z., Li X., Sun H., Wang J., Zhao T., Chen H., Ma Y., Zhu S., Xie Z. Rapid identification of COVID-19 severity in CT scans through classification of deep features. Biomed. Eng. Online. 2020;19:63. doi: 10.1186/s12938-020-00807-x. [DOI] [PMC free article] [PubMed] [Google Scholar]
- 50.Jaiswal A., Gianchandani N., Singh D., Kumar V., Kaur M. Classification of the COVID-19 infected patients using DenseNet201 based deep transfer learning. J. Biomol. Struct. Dyn. 2021;39:5682–5689. doi: 10.1080/07391102.2020.1788642. [DOI] [PubMed] [Google Scholar]
- 51.Sanagavarapu S., Sridhar S., Gopal T. COVID-19 identification in CLAHE enhanced CT scans with class imbalance using ensembled resnets; Proceedings of the 2021 IEEE International IOT, Electronics and Mechatronics Conference (IEMTRONICS); Toronto, ON, Canada. 21–24 April 2021; pp. 1–7. [Google Scholar]
- 52.Song J., Wang H., Liu Y., Wu W., Dai G., Wu Z., Zhu P., Zhang W., Yeom K.W., Deng K. End-to-end automatic differentiation of the coronavirus disease 2019 (COVID-19) from viral pneumonia based on chest CT. Eur. J. Pediatr. 2020;47:2516–2524. doi: 10.1007/s00259-020-04929-1. [DOI] [PMC free article] [PubMed] [Google Scholar]
- 53.Sarker L., Islam M., Hannan T., Ahmed Z. COVID-DenseNet: A deep learning architecture to detect COVID-19 from chest radiology images. Preprint. 2020:2020050151. doi: 10.20944/preprints202005.0151.v3. [DOI] [Google Scholar]
- 54.Shan F., Gao Y., Wang J., Shi W., Shi N., Han M., Xue Z., Shen D., Shi Y. Lung infection quantification of COVID-19 in CT images with deep learning. arXiv. 20202003.04655 [Google Scholar]
- 55.Wang S., Zha Y., Li W., Wu Q., Li X., Niu M., Wang M., Qiu X., Li H., Yu H., et al. A fully automatic deep learning system for COVID-19 diagnostic and prognostic analysis. Eur. Respir. J. 2020;56:2000775. doi: 10.1183/13993003.00775-2020. [DOI] [PMC free article] [PubMed] [Google Scholar]
- 56.Gozes O., Frid-Adar M., Greenspan H., Browning P.D., Zhang H., Ji W., Bernheim A., Siegel E. Rapid AI development cycle for the Coronavirus (COVID-19) pandemic: Initial results for automated detection & patient monitoring using deep learning CT image analysis. arXiv. 20202003.05037 [Google Scholar]
- 57.Wang S., Kang B., Ma J., Zeng X., Xiao M., Guo J., Cai M., Yang J., Li Y., Meng X., et al. A deep learning algorithm using CT images to screen for Corona Virus Disease (COVID-19) Eur. Radiol. 2021;31:6096–6104. doi: 10.1007/s00330-021-07715-1. [DOI] [PMC free article] [PubMed] [Google Scholar]
- 58.Li L., Qin L., Xu Z., Yin Y., Wang X., Kong B., Bai J., Lu Y., Fang Z., Song Q., et al. Using artificial intelligence to detect COVID-19 and community-acquired pneumonia based on pulmonary CT: Evaluation of the diagnostic accuracy. Radiology. 2020;296:E65–E71. doi: 10.1148/radiol.2020200905. [DOI] [PMC free article] [PubMed] [Google Scholar]
Associated Data
This section collects any data citations, data availability statements, or supplementary materials included in this article.
Data Availability Statement
https://www.kaggle.com/plameneduardo/sarscov2-ctscan-dataset (accessed on 20 August 2021).


