

Summary:
Epstein-Barr virus (EBV) causes endemic Burkitt lymphoma and immunosuppression-related lymphomas. These B-cell malignancies arise by distinct transformation pathways and have divergent viral and host expression programs. To identify host dependency factors resulting from these EBV B-cell transformed cell states, we performed parallel genome-wide CRISPR/Cas9 loss-of-function screens in Burkitt lymphoma (BL) and lymphoblasotid cell lines (LCL). These highlighted 57 BL and 87 LCL genes uniquely important for their growth and survival. LCL hits were enriched for EBV-induced genes, including viral super-enhancer targets. Our systematic approach uncovered key mechanisms by which EBV oncoproteins activate the PI3K/AKT pathway and evade tumor suppressor responses. LMP1-induced cFLIP was found to be critical for LCL defense against TNFα-mediated programmed cell death, while EBV-induced BATF/IRF4 were critical for LCL BIM suppression and MYC induction. Finally, EBV super-enhancer targeted IRF2 protected LCLs against BLIMP1 tumor suppression. Our results identify viral transformation-driven synthetic lethal targets for therapeutic intervention.
Introduction
The gamma-herpesvirus Epstein Barr virus (EBV) infects >95% of adults worldwide and is associated with 200,000 human malignancies per year (Cohen et al., 2011). EBV causes endemic Burkitt lymphoma (BL) in regions with holoendemic malaria, and is an important etiology of BL with HIV co-infection (Kieff and Rickinson, 2007; Lieberman, 2014; Rickinson, 2014; Sugden, 2014; Thorley-Lawson and Allday, 2008). EBV is also the major infectious etiology of immunosuppression-associated lymphoma, causing post-transplant lymphoproliferative disease (PTLD) in up to 20% of transplants (LaCasce, 2006) and HIV-associated B cell cancers (Powles, 2009). The mechanisms by which EBV causes B-cell cancers remain to be fully elucidated.
EBV establishes latent infection in B cells, in which the virus expresses latency factors rather than producing infectious particles. The EBV growth (or Latency III) program encodes three latent membrane proteins, six EBV nuclear antigens (EBNA) and non-coding RNAs. These EBV factors convert primary human B-cells into activated lymphoblasts, which further transform into immortalized lymphoblastoid cell lines (LCLs) if left unchecked. In immunocompetent hosts, T and NK cell responses limit EBV oncoprotein expression, ultimately driving EBV into the default (Latency I) program. In this state, the EBV genome tethering protein EBNA 1 is the only viral protein expressed (Kieff and Rickinson, 2007; Nonkwelo et al., 1996; Rowe et al., 1987). The Latency I pattern is found in EBV-infected memory B-cells and BL cells.
Immunoglobulin locus translocations upregulate BL MYC expression (Schmitz et al., 2012), whereas EBV latency factors are instead the lymphoblastoid B-cell oncogenic drivers (Kieff and Rickinson, 2007). EBV LMP1 mimics CD40 signaling to activate NF-κB, MAP kinase and interferon regulatory factor pathways (Cahir-McFarland et al., 2004; Kieff and Rickinson, 2007). LMP2A mimics tonic B-cell receptor signaling to activate PI3K/AKT/mTOR and is essential for pre-germinal center B-cell transformation by EBV (Caldwell et al., 1998; Cen and Longnecker, 2015; Mancao and Hammerschmidt, 2007). EBNA2, 3A and 3C bind to host transcription factors to modulate gene expression (Banerjee et al., 2013; Jha et al., 2015; Robertson et al., 1996; Schmidt et al., 2015; Zhao et al., 1996). EBNA and LMP1-activated NF-κB subunits form viral super-enhancers that strongly upregulate 187 host genes (Zhou et al., 2015). The extent to which individual EBV target genes are critical for LCL growth and survival has not been tested systematically.
The mechanisms by which EBV circumvents tumor suppressor checkpoints, a hallmark of cancer, remain incompletely understood. EBV-mediated upregulation of pro-survival BCL2 (Henderson et al., 1991) and suppression of pro-apoptotic BIM have key roles in B-cell transformation (Anderton et al., 2008; Wood et al., 2016). Yet, while viral genes important for B-cell transformation have been identified, systematic genetic analysis of host dependency factors critical for transformed EBV B-cell growth and survival has not been performed. Likewise, current pharmacologic therapies do not sufficiently harness dependencies that specifically arise from EBV infection.
Clustered Regularly Interspaced Short Palindromic Repeats (CRISPR)/Cas9 enables powerful loss-of-function genetic analysis (Doench et al., 2016). We used CRISPR human genome-wide screens to identify host dependency factors critical for LCL versus EBV+ BL growth and survival. Our analysis revealed distinct pathways and EBV-induced host genes critical for EBV+ Burkitt versus LCL growth and survival. Collectively, our results highlight multiple EBV-driven Achilles heel therapeutic targets.
Results
CRISPR/Cas9 Screens for EBV-transformed B-cell Growth and Survival Factors
CRISPR mutagenesis was used to generate loss-of-function libraries, using the Tier I ENCODE project LCL GM12878 and the EBV+ BL cell line P3HR1. P3HR1 and GM12878 possess EBV latency I and III state, respectively, which we validated by EBNA and LMP expression patterns (Figure S1A). Briefly, B-cells with stable Cas9 expression were transduced with the Avana single-guide RNA (sgRNA) library (Figure 1A), comprised of 74,700 lentiviruses (Doench et al., 2016). Each lentivirus delivers a unique sgRNA, which targets a human gene, frequently resulting in the introduction of nonsense mutations (Doench et al., 2016). Four independent sgRNAs target each human protein coding gene. A multiplicity of infection of 0.3 was used to minimize lentivirus coinfection. Transduced cells were puromycin selected and then grown for 21 days, providing strong selective pressure for sgRNAs that enhance or suppress cell growth or survival. P3HR1 and GM12878 Day 21 sgRNA abundance were quantitated by next-generation sequencing. Screen quadruplicates were highly concordant (Figure S1B–C).
Figure 1. CRISRP/Cas9 Screens Identify Growth and Survival Factors in EBV-infected Burkitt and Lymphoblastoid B-cells.
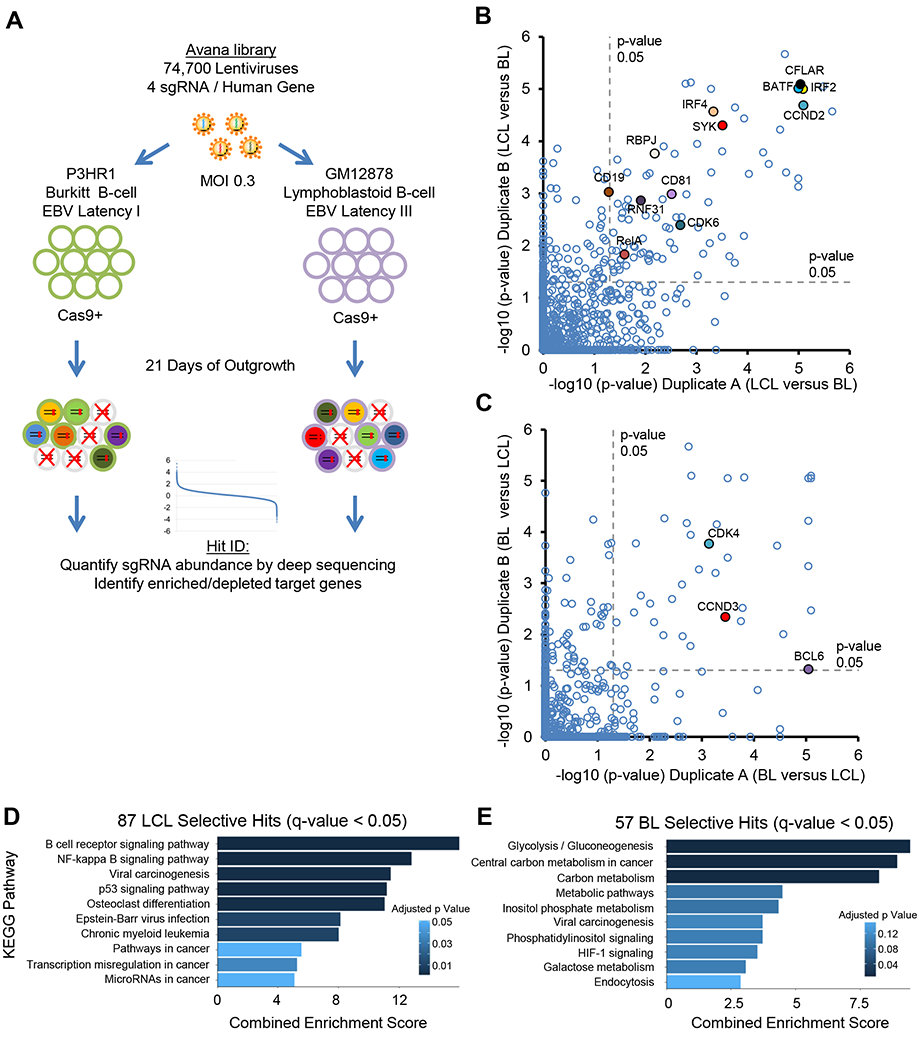
(A) CRISPR/Cas9 screen workflow and screening strategy. (B-C) Scatter plots showing the statistical significance of top (B) GM12878-selective and (C) P3HR1-selective hits. Statistical significance was quantitated by the STARS algorithm, using two biological replicates for each axis (see Table S1). (D-E) Enrichr pathway analysis of (D) GM12878-selective and (E) P3HR1-selective screen hits, using a q<0.05 cutoff. See also Figure S1.
The STARS algorithm, which integrates data from independent guides targeting the same gene, was used to identify statistically significant hits (Doench et al., 2016). To highlight dependencies of each EBV latency state and to filter essential B-cell housekeeping genes, we focused on hits that were unique to P3HR1 versus GM12878. Using a stringent multiple hypothesis testing adjusted q-value < 0.05 cutoff, 87 hits were selectively depleted from GM12878, whereas 57 were selectively depleted from P3HR1 (Figure 1B–C). Many host dependency factors known to be important for EBV oncoprotein function scored in the LCL screen, including the LMP1/NF-κB pathway components IKKβ (encoded by IKBKB), HOIP (encoded by RNF31), and p52 (encoded by NFKB2). Likewise, genes encoding the key EBNA2 co-factor RBP-Jκ and the EBNA3-associated proteins WDR48 and CTBP1 were GM12878-selective hits (Table S1). Consistent with chemical inhibitor and biochemical studies (Forte and Luftig, 2009; Saha et al., 2009), MDM2 was a top LCL hit, as was the p53 suppressor MDM4 (Table S1). Likewise, P3HR1-selective hits included factors previously identified as central to BL biology (Table S2). For instance, the germinal center transcription repressor BCL6 was a top hit, and has important oncogenic BL roles (Basso and Dalla-Favera, 2012) (Figure 1C, S1D).
Gene ontology analysis identified distinct pathways enriched amongst LCL versus BL-selective hits. Enriched LCL Kyoto Encyclopedia of Genes and Genomes (KEGG) pathways included the B-cell receptor and NF-κB signaling, p53 signaling, viral carcinogenesis and EBV infection (Figure 1D). P3HR1-selective hits were enriched for multiple metabolic pathways, including glycolysis, central carbon metabolism, inositol phosphate metabolism, and galactose metabolism (Figure 1E). Notably, myc expression is highly upregulated in BL by characteristic translocations, and both glycolysis and central carbon metabolism are highly myc-induced, including in B lymphocytes and BL cells (Caro-Maldonado et al., 2014; Le et al., 2012). These results highlight complex P3HR1 metabolic dependencies, with potentially non-redundant glycolysis and mitochondrial oxidative phosphorylation roles.
We next asked whether LCL-specific dependency factors were enriched for EBV latency III program-induced B-cell genes. Using a primary human B-cell EBV infection dataset (Price et al., 2012), we found that the 87 GM12878 hits were significantly enriched for EBV-upregulated host genes, but did not include the many genes EBV suppresses by >1.5 fold (Figure 2A–B). EBV upregulated LCL hits included the cell cycle activators Cyclin D2 (encoded by CCND2) and CDK6 (Figure 2C). By contrast, cyclin D3 (encoded by CCND3), which is frequently targeted by activating mutations in BL (Schmitz et al., 2014), was a P3HR1-selective hit, as was its binding partner CDK4 (Figure 2C–D, S1E–H). Importantly, palbociclib, a well-tolerated CDK4/6 antagonist in clinical use, blocked LCL growth (Figure S1I), highlighting an opportunity for therapeutic intervention. These data indicate that LCLs are addicted to multiple EBV oncoprotein-induced dependency factors.
Figure 2. CRISPR Screens Highlight LCL and BL Dependency Factors.
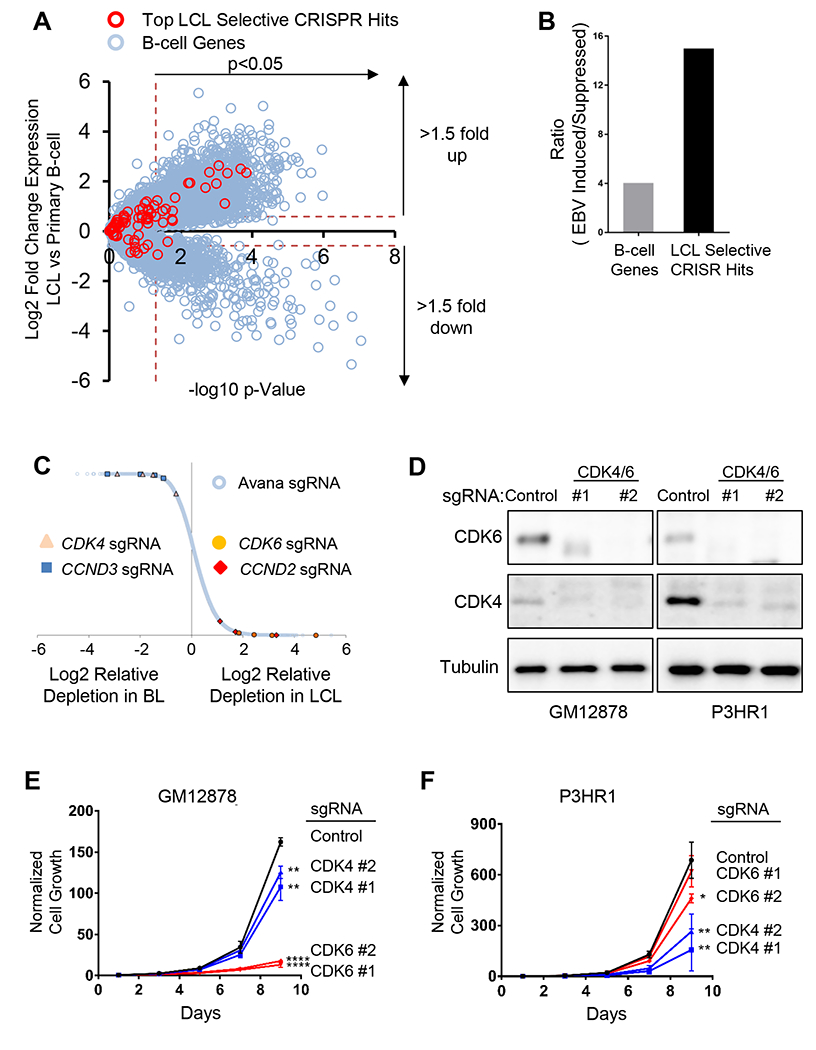
(A) Scatter plot of EBV-mediated effects on primary human B cell gene expression Y axis, Log2 (LCL to primary B-cell ratios); X axis, −log10 (p-value). Values (Price et al., 2012) of top LCL-selective hits (red circle) versus all other B cell genes (blue circle) are shown. (B) Ratios of EBV-induced to EBV-suppressed primary B-cell host genes for genome-wide (gray bar) versus for the 87 LCL-selective screen hits at q <0.05 cutoff (black bar). (C) CRISPR screens identified distinct GM12878 and P3HR1 cyclin/cyclin-dependent kinase dependencies. Data are expressed as Log2 normalized values of sgRNA abundance from quadruplicate screens. The four sgRNAs against CDK4 (triangle), CCND3 (square), CDK6 (closed circle) and CCND2 (diamond) are highlighted among all Avana sgRNA library abundances (open circle). (D) Immunoblot analysis of CDK4 or CDK6 knockout in whole cell extracts of GM12878 or P3HR1 with the indicated sgRNAs. (E-F) Growth curves of GM12878 versus P3HR1 Cas9 cells expressing CDK6 (red), CDK4 (blue) or non-targeting control (black) sgRNA. Mean and standard deviation (S.D.) of triplicate experiments are shown. See also Figure S1.
CD19 and CD81 Are Critical LCL Dependency Factors Important for PI3K Activation
The LMP2A pathway provides LCLs with key PI3K/AKT/mTOR survival signals (Cen and Longnecker, 2015), but has not been systematically analyzed by genetic approaches. Our screens identified multiple known LMP2A mediators as essential for LCL survival, including the tyrosine kinases SYK and BTK (Figure 1B, S2A–B). Interestingly, the B-cell receptor adaptor BLNK, which nucleates BCR signaling complexes, was also a strong LCL hit (Table S1). Using a p < 0.05 cutoff, the PI3K p85 regulatory (encoded by PIK3R1) and p110 (encoded by PIK3CD) catalytic subunits were identified as LCL-selective hits, though PIK3CD sgRNAs were also depleted from Day 21 P3HR1 pools to a lesser extent (Figure S2C). By contrast, all four sgRNAs against PTEN, which encodes a phosphatase that opposes PI3K, were significantly enriched in GM12878, but not P3HR1 Day 21 pools (Figure S2D). Thus, although EBV microRNAs target PTEN in B-cells (Bernhardt et al., 2016), residual PTEN may fine-tune LMP2A-mediated PI3K pathway activation to limit LCL growth.
How LMP2A recruits PI3K to the LCL plasma membrane remains to be defined. Notably, BCR signaling utilizes CD19/81/21 to recruit PI3K, where concurrent recognition of complement-tagged antigen by immunoglobulin and CD21 colocalizes the two complexes(Tuveson et al., 1993). We noted that all four CD19 and CD81 sgRNAs, but not CD21 sgRNAs, strongly suppressed LCL outgrowth (Figure 3A–C). We verified that CD21 sgRNAs efficiently knocked out GM12878 CD21 expression (data not shown). To investigate potential CD19 and CD81 roles in LMP2A signaling, we first validated our screen results, using two independent LCLs. CD19 sgRNAs efficiently knocked out LCL plasma membrane CD19 expression, as did sgRNAs against CD81, which is required for CD19 cell surface localization (Shoham et al., 2003) (Figure 3D). Independent CD19 and CD81 sgRNAs strongly impaired outgrowth of the two LCLs, but had comparatively little effects on P3HR1 (Figure 3E and S2E–F). Consistent with a role at the level of PI3K activation, CD19 and CD81 sgRNAs significantly diminished phosphorylation of the PI3K substrate AKT, but did not impair upstream LMP2A-triggered SYK phosphorylation (Figure 3F). Redundancy between the three AKT genes (AKT1, 2 and 3) may have precluded AKT genes from scoring in our screen. Collectively, these data suggest that the CD19/81 complex is an LCL dependency factor critically important for EBV oncoprotein-mediated PI3K pathway activation (Figure 3G).
Figure 3. CD19/81 Promote EBV-Mediated PI3K/AKT Pathway Activation.
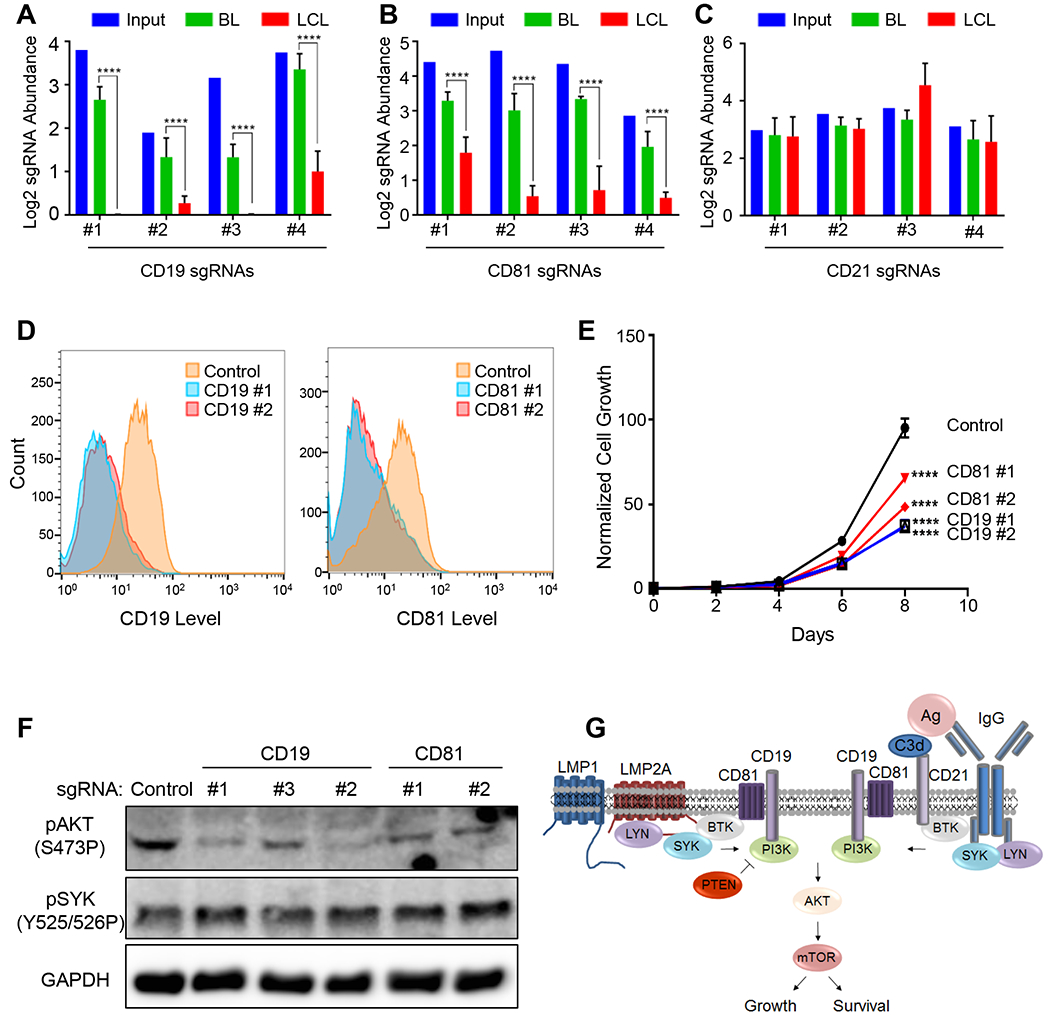
(A-C) Log2 normalized abundance of sgRNAs targeting (A) CD19, (B) CD81 or (C) CD21 in the library input, P3HR1 BL (Day 21) or GM12878 LCL (Day 21). Mean and S.D. values from quadruplicate screens are shown. (D) Flow cytometry profiles of plasma membrane CD19 levels in GM12878 Cas9+ LCLs following control (blue) or CD19 sgRNA (red) expression. (E) Growth curve analysis of GM12878 Cas9 cells expressing control, CD19 or CD18 sgRNAs. Mean and S.D. values of triplicate experiments are shown. (F) Immunoblot analysis of phospho-AKT, phospho-SYK or GAPDH in GM12878 expressing the indicated sgRNAs. (G) Schematic model of EBV latent membrane protein in comparison to B-cell receptor-mediated PI3K pathway activation. See also Figure S2–3.
Identification of LCL Addiction to LMP1-Induced cFLIP
The LMP1/NF-κB pathway is critical for LCL survival, yet GM12878 ChIP-seq analysis identified thousands of LMP1/NF-κB host targets (Zhao et al., 2014). Systematic genetic approaches have not been used to identify which of these are key LCL dependency factors. Unexpectedly, our CRISPR approach highlighted the LMP1 target cFLIP (encoded by CFLAR), a suppressor of extrinsic apoptosis and necroptosis pathways, as a critically important LCL survival factor (Figure 1B, S3A). All four CFLAR sgRNAs were markedly depleted from the Day 21 LCL, but not P3HR1 pools (Figure 4A). We validated this result in another LCL/EBV+ BL pair (Figure S3). Since cFLIP has not been previously been identified as a critical LCL dependency factor, we investigated the mechanism by which its loss triggers LCL death. We found that cFLIP sgRNAs rapidly activated the LCL extrinsic apoptosis pathway, as judged by initiator caspase-8 activity (Figure 4B). Likewise, cFLIP loss triggered LCL, but not P3HR1 downstream executioner caspase 3/7 activity (Figure 4C), cleavage of the caspase 3/7 substrate PARP (Figure 4D) and cell surface annexin V positivity (Figure S4A–B). These results suggest that a major LMP1 pro-survival LCL role is to block a constitutively activated extrinsic apoptosis pathway.
Figure 4. LCLs are Critically Dependent on LMP1-induced cFLIP.
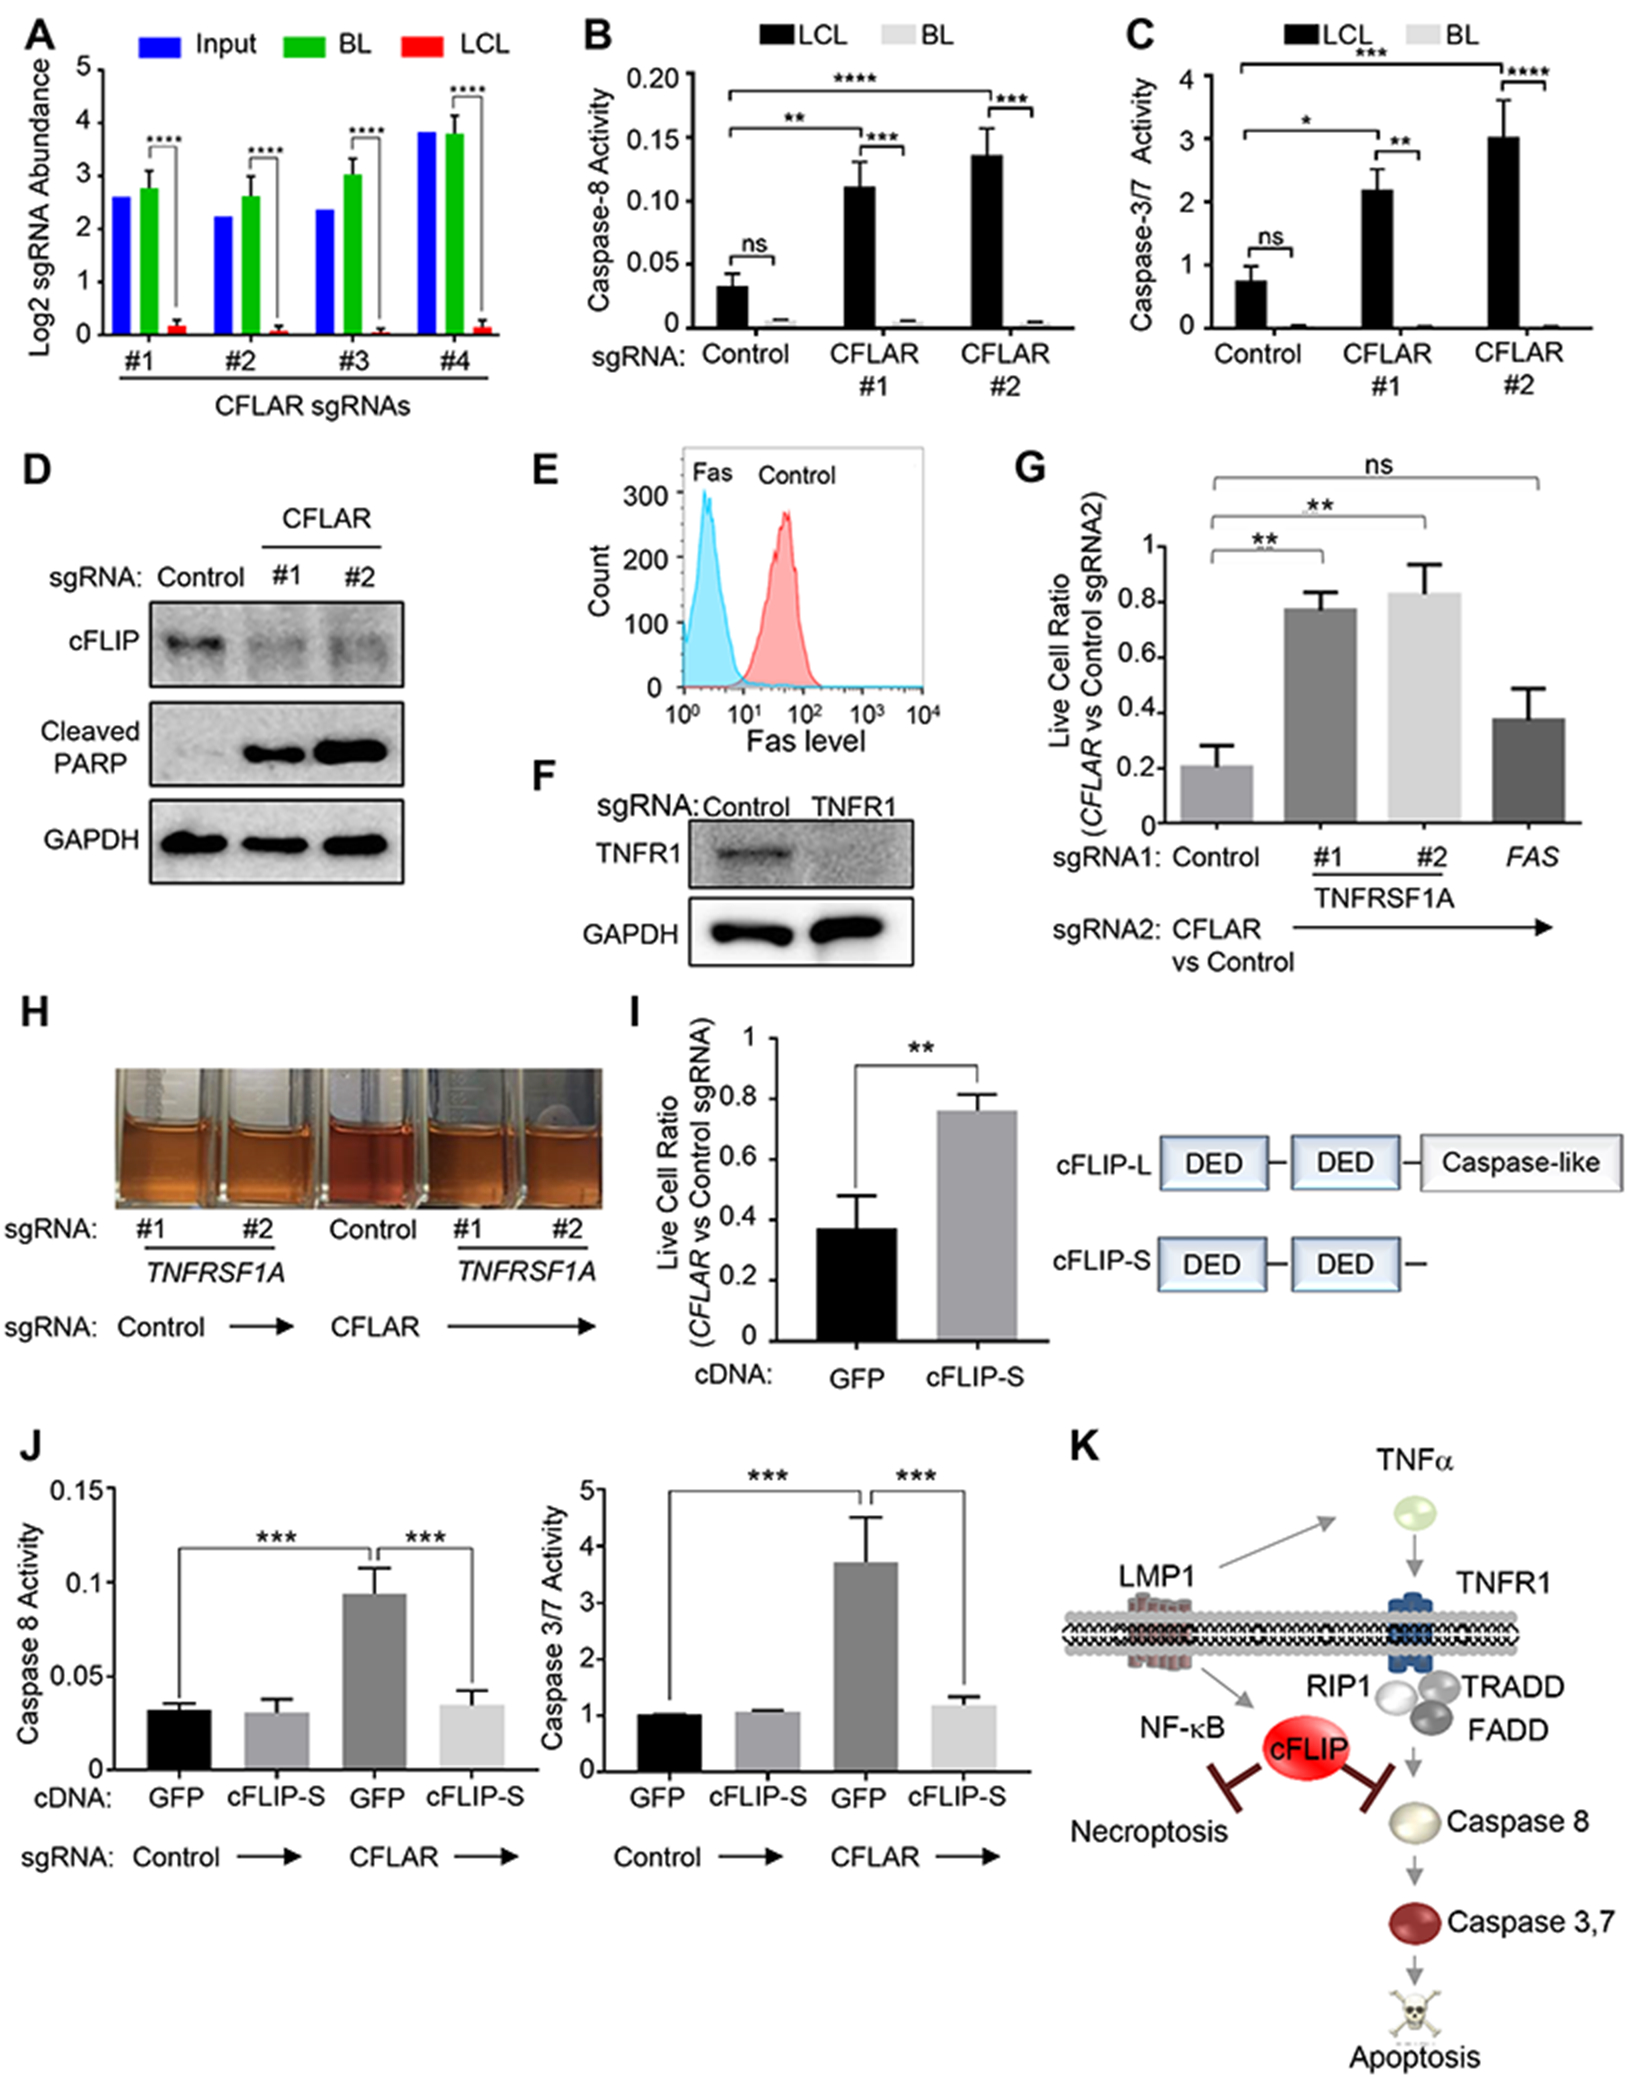
(A). Log2 normalized abundance of the CFLAR sgRNAs in the library input, P3HR1 BL (Day 21) or GM12878 LCL (Day 21). (B-C) CFLAR sgRNAs induce caspase-8 (B) and caspase-3/7 activity (C) in GM12878 LCLs but not P3HR1 BL. (D) Immunoblot analysis of PARP cleavage in GM12878 expressing control or CFLAR sgRNAs, as shown. (E) Flow cytometry analysis of cell surface Fas levels in GM12878 expressing control or Fas sgRNAs. (F) Immunoblot analysis of type I TNF receptor (TNFR1) in GM12878 expressing control or TNFRSF1A sgRNA. (G) LCLs expressing control, TNFRSF1A, or FAS sgRNA (sgRNA 1) were subsequently transduced with lentivirus expressing either CFLAR or control sgRNAs (sgRNA 2). Normalized live cell numbers were expressed as the ratio of cells transduced with CFLAR sgRNA to those with control sgRNA. (H) Cultures of GM12878 expressing TNFRSF1A or control sgRNA on day 5 after transduction of control or CFLAR sgRNAs. (I) cDNA rescue of CFLAR-sgRNA-transduced LCLs. GM12878 stably expressing the indicated rescue cDNAs were transduced with control or CFLAR sgRNA. 1 week after transduction, live cell ratios of CFLAR- to control-sgRNA-transduced cells were shown. Schematic diagram of cFLIP isoforms is shown on the right. (J) GM12878 expressing GFP or cFLIP-S rescue cDNAs were transduced with control or CFLAR sgRNAs. After 5 days, caspase-8 and 3/7 activities were measured. (K) Schematic diagram of LMP1-induced cFLIP survival roles. Mean and S.D. values of at least triplicate experiments are shown. See also Figure S4–6.
We hypothesized that EBV oncoproteins create the synthetic LCL cFLIP requirement, perhaps through induction of Fas and/or TNFα expression (Arvey et al., 2012; Cahir-McFarland et al., 2004; Price et al., 2012; Spender et al., 2001). In support, we found that antibody blockade of TNFα, but not Fas, significantly protected GM12878 from cFLIP loss (Figure S4C). To extend this result, we established LCLs deficient for Fas or the Type I TNF receptor (encoded by TNFRSF1A) (Figure 4E–F, S4D). To test whether Fas or TNF receptor loss could rescue LCLs from subsequent cFLIP loss, we next expressed control or CFLAR sgRNAs. Intriguingly, TNFRSF1A sgRNAs, but not the FAS sgRNA, significantly rescued LCLs from death (Figure 4G), and LCLs doubly deficient for the Type I TNF receptor and cFLIP could be propagated (Figure 4H). Together, our results suggest that EBV growth program-induced TNFα expression creates the synthetic cFLIP dependency.
LCLs express two cFLIP isoforms, cFLIP-L and cFLIP-S, which block cell death by discrete mechanisms. cFLIP-L heterodimerizes with caspase-8, blocks the extrinsic pathway, and together with FADD, blocks RIP3-dependent necroptosis (Dillon et al., 2012). cFLIP-S instead competes with caspase-8 for death receptor recruitment. To test whether cFLIP-S could rescue LCLs from endogenous cFLIP isoform knockout, we established LCLs with sgRNA-resistant cFLIP-S or control GFP cDNA expression. We found that cFLIP-S blocked caspase activation and significantly rescued LCLs from a sgRNA targeting the first common cFLIP-S/L exon (Figure 4I–J, S4E). These results suggest that a major LMP1 role is to rescue LCLs from the TNFα-triggered extrinsic apoptosis pathway. We were unable to establish LCLs with stable cFLIP-L expression, presumably since its enforced expression triggers apoptosis (Micheau et al., 2002). However, chemical caspase and necroptosis inhibitors synergistically rescued CFLAR sgRNA-induced LCL death (Figure S4F), suggesting that cFLIP-L also has a role in LCL protection from TNF-induced necroptosis (Figure 4K).
Our studies highlight LMP1-mediated cFLIP induction as an LCL synthetic lethal target. However, our prior ChIP-seq studies (Zhao et al., 2014) suggest that LMP1-induced canonical and non-canonical NF-κB pathways induce cFLIP in LCLs (Figure S5A). We therefore tested the effects of the neddylation inhibitor MLN4924 (Milhollen et al., 2010), which blocks ubiquitin ligases necessary for both LMP1-induced canonical and non-canonical NF-κB pathways (Figure S6A). MLN4924 blocked LCL cFLIP expression and triggered cell death (Figure S6B, F). We next tested pairs of BL cells, differing only in their EBV expression patterns (Figure S6C–E). In all three cell lines, we found that the EBV growth program sensitized BL to MLN4924 toxicity (Figure S6G–I). Blockade of cullin ubiquitin ligases with roles beyond NF-κB may also have contributed to this phenotype. Collectively, our systematic CRISPR approach identified cFLIP as a critical LMP1/NF-κB induced LCL dependency factor.
BATF and IRF4 are LCL Dependency Factors that Integrate EBV Oncoprotein Signaling
ChIP-seq and RNA profiling identified host genes targeted by multiple EBV oncoproteins. However, systematic genetic approaches have not yet been harnessed to identify which of these are critical LCL dependency factors. Intriguingly, our CRISPR screens highlighted BATF and IRF4, which are synergistically induced by EBV membrane and nuclear oncoproteins, as critically-important survival factors (Figure 1B, 5A–C, S5B–C).
Figure 5. LCLs are Addicted to EBV-induced BATF and IRF4.

(A-B) Log2 normalized abundances of (A) BATF and (B) IRF4 sgRNAs in the library input, P3HR1 BL (Day 21) or GM12878 LCL (Day 21). Mean and S.D. of quadruplicate samples are shown; ****, p<0.0001. (C) Immunoblot analysis of GM12878 whole cell extracts collected 5 days after expression of control, BATF, or IRF4 sgRNAs, as indicated. (D) Caspase-3/7 activity was measured 5 days after introduction of control, BATF or IRF4 sgRNA in GM12878 LCL or P3HR1 BL. (E) Immunoblot analysis of BATF, IRF4 and tubulin in whole cell lysates of primary human B-cells infected by EBV at the indicated time points post infection. (F) cDNA rescue of BATF-sgRNA-transduced LCLs. GM12878 stably expressing the indicated rescue cDNAs were transduced with control or BATF sgRNA. 1 week after transduction, live cell ratios of BATF- to control-sgRNA-transduced cells were shown. (G) Venn diagrams of GM12878 genes upregulated or downregulated by BATF or IRF4 sgRNA. Differentially expressed (DE) genes associated with a FDR adjusted p value < 0.05 between BATF or IRF4 sgRNA and control sgRNA groups were subject to analysis. See also Figure S7.
We confirmed LCL BATF and IRF4 dependency by the following approaches. First, knockout of either transcription factor triggered GM12878, but not P3HR1 apoptosis, which we validated in an additional LCL/BL pair (Figure 5D and S3). Second, primary human B-cell EBV infection highly upregulated BATF and IRF4 on the protein level (Figure 5E). Third, BATF sgRNA-induced apoptosis induction was rescued by BATF, but not GFP cDNA (Figure 5F), validating on-target effects. Likewise, while we could only achieve modest HA-IRF4 LCL expression, it nonetheless significantly rescued LCLs from IRF4 sgRNA (Figure S7A–B). BATF or IRF4 knockout did not affect LCL cFLIP protein levels (data unpublished), suggesting non-redundant LCL dependency factor roles.
ENCODE ChIP-seq (Ernst et al., 2011) identified thousands of BATF and IRF4 co-occupied GM12878 sites. To identify functionally important BATF/IRF4 LCL targets, we performed RNAseq after control, IRF4 or BATF sgRNA expression. Using biological triplicate replicates collected prior to apoptosis, we found that 829 LCL genes were commonly BATF- and IRF4-sgRNA downregulated at a FDR < 0.05 and 1.5-fold cutoff, and 737 B-cell genes were commonly up-regulated (Figure 5G). Unexpectedly, BCL2L11, which encodes the key pro-apoptotic tumor suppressor BIM, was amongst the most highly IRF4 or BATF sgRNA-induced LCL gene (Table S1, Figure 6A). BATF cDNA rescue suppressed this phenotype (Figure 6B). These results suggest that IRF4 and BATF, likely as DNA-bound transcription factor complexes, are necessary for EBV oncoprotein-mediated BCL2L11 silencing, a key event in lymphoblastoid B-cell transformation. EBNA3A and 3C, which are also necessary for BIM silencing (Paschos et al., 2012; Wood et al., 2016), co-occupy a BCL2L11 locus binding site with BATF and IRF4 (Figure 6C) (Jiang et al., 2014; Schmidt et al., 2015).
Figure 6. BATF and IRF4 are Critical for LCL BIM Suppression and MYC Induction.
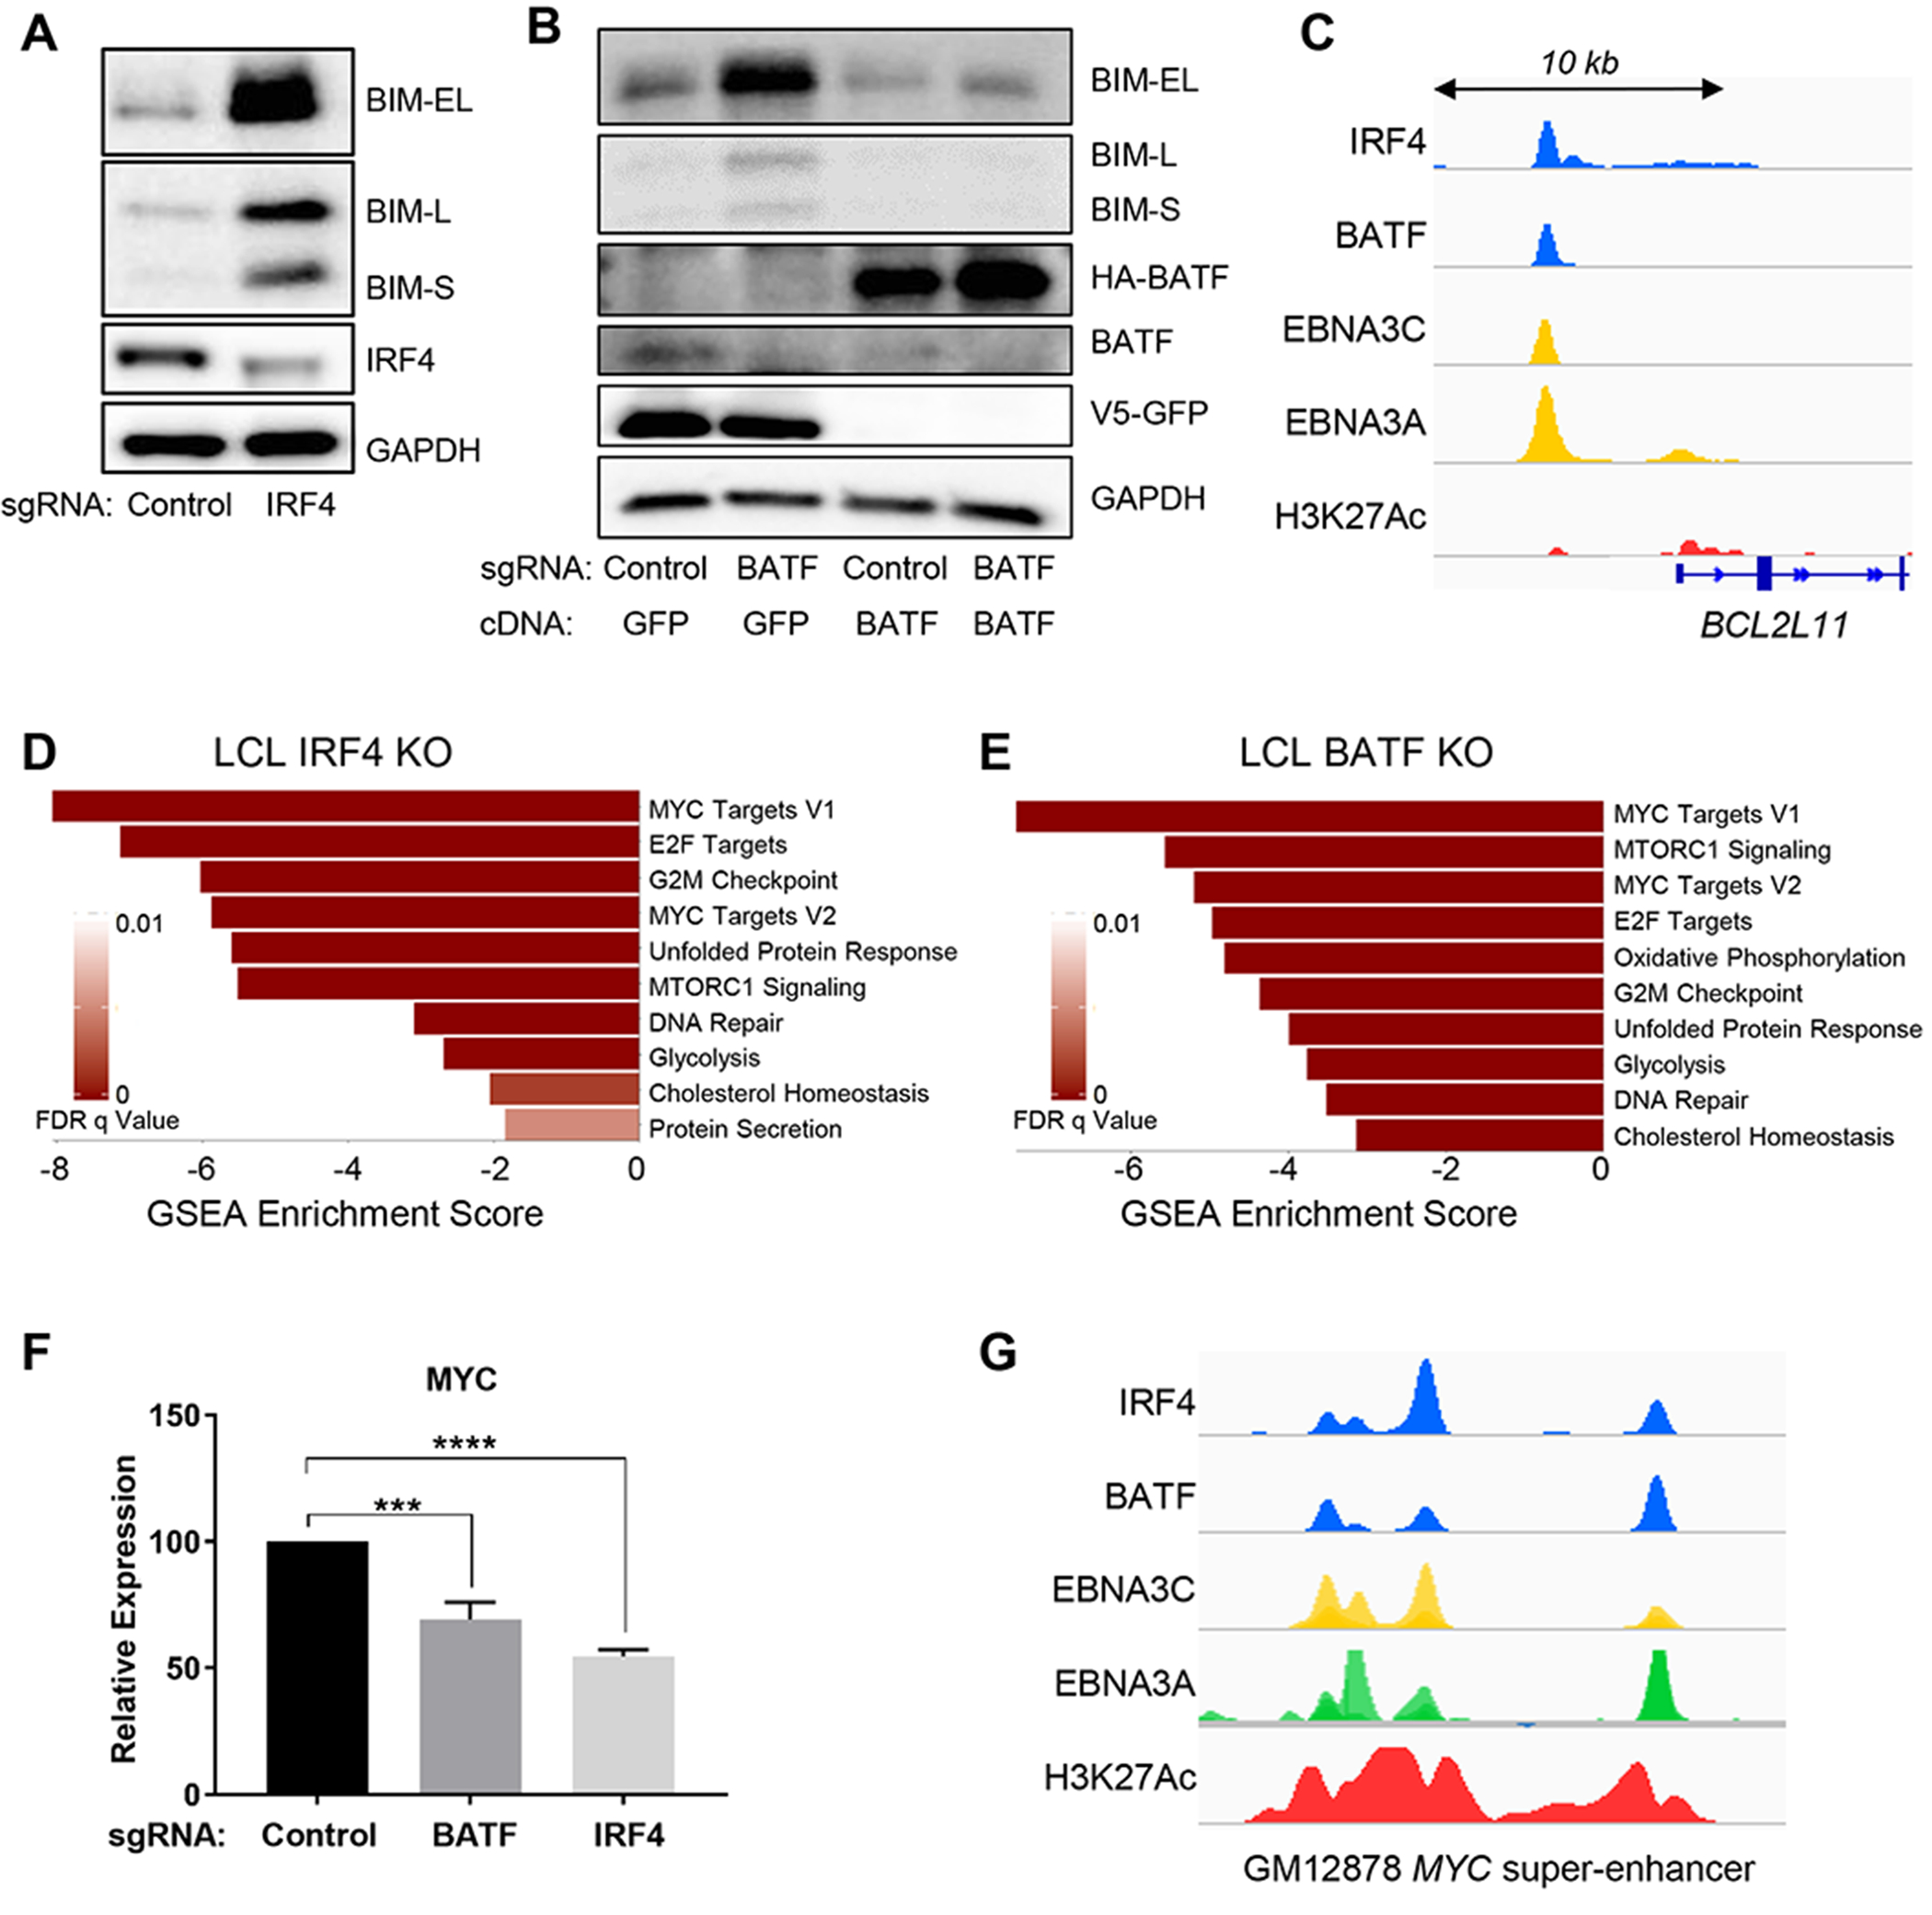
(A) Immunoblot analysis of BIM extra long (EL), long (L) or short (S) isoforms, IRF4, or GAPDH expression in whole cell lysates of GM12878 cells 6 days following expression of control or IRF4 sgRNA. (B) Immunoblot analysis of the whole cell lysates of GM12878 stably expressing HA-BATF rescue or V5-GFP cDNA on day 7 after transduction of control or BATF sgRNA. (C) ChIP-seq signal visualization for IRF4, BATF, H3K27Ac, EBNA3A and EBNA3C at the BCL2L11 locus in GM12878. (D-E) GSEA Hallmark analysis of significantly downregulated gene sets in RNAseq datasets obtained from GM12878 4 days after transduction of control, IRF4 or BATF sgRNA, as indicated. (F) MYC mRNA levels in GM12878 on day 5 after transduction of control, IRF4 or BATF sgRNA. Mean and S.D. values from triplicate independent experiments are shown; ***, p<0.0001. (G) GM12878 ChIP-seq signals of IRF4, BATF, EBNA3C, 3A or H3K27Ac at the EBV super enhancer closest to the MYC transcriptional start site.
BATF and IRF4 likely have additional LCL dependency role(s), since we found that BCL2L11 knockout clones were not rescued from subsequent IRF4 or BATF sgRNA-induced death (data unpublished). We therefore performed gene set enrichment analysis (GSEA) on our datasets and found that similar key pathways were perturbed by BATF and IRF4 sgRNAs, in support of key common LCL dependency factors roles (Figure 6D–E). IRF4 and BATF sgRNA downregulated genes were highly enriched for MYC targets, and IRF4 and BATF sgRNAs decreased MYC mRNA levels by 65% and 45%, respectively (Table S3–4, Figure 6F). Interestingly, GM12878 ChIP-seq (Zhou et al., 2015) found BATF, IRF4 and EBNA co-occupancy at LCL upstream super-enhancers that loop to the MYC promoter (Figure 6G), again supporting a model in which BATF and IRF4 are required for key EBNA nuclear functions. Collectively, these results suggest that the EBV growth program creates BATF and IRF4 addiction, centered on BIM suppression and MYC upregulation.
Super-enhancer Target IRF2 is an LCL Dependency Factor That Counteracts BLIMP1
187 LCL viral super-enhancers (SE), co-occupied by EBNA and LMP1-activated NF-κB transcription factors, were recently identified (Zhou et al., 2015). SE are strong transcription determinants that target genes important for cell identity and oncogenic state (Whyte et al., 2013), yet EBV SE targets have not been systematically tested for roles as LCL dependency factors. Interestingly, top LCL screen hits CFLAR and IRF2 (Figure 1B) are EBV SE targets. All four of the IRF2 sgRNAs were significantly depleted in GM12878, but not P3HR1 Day 21 pools (Figure 7A–B). LCL IRF2 knockout induced LCL apoptosis, as judged by caspase 3/7 activity and annexin V surface positivity (Figure 7C). We confirmed this result in a second LCL/BL pair (Figure S3).
Figure 7. LCLs are Addicted to EBV-Targeted IRF2.
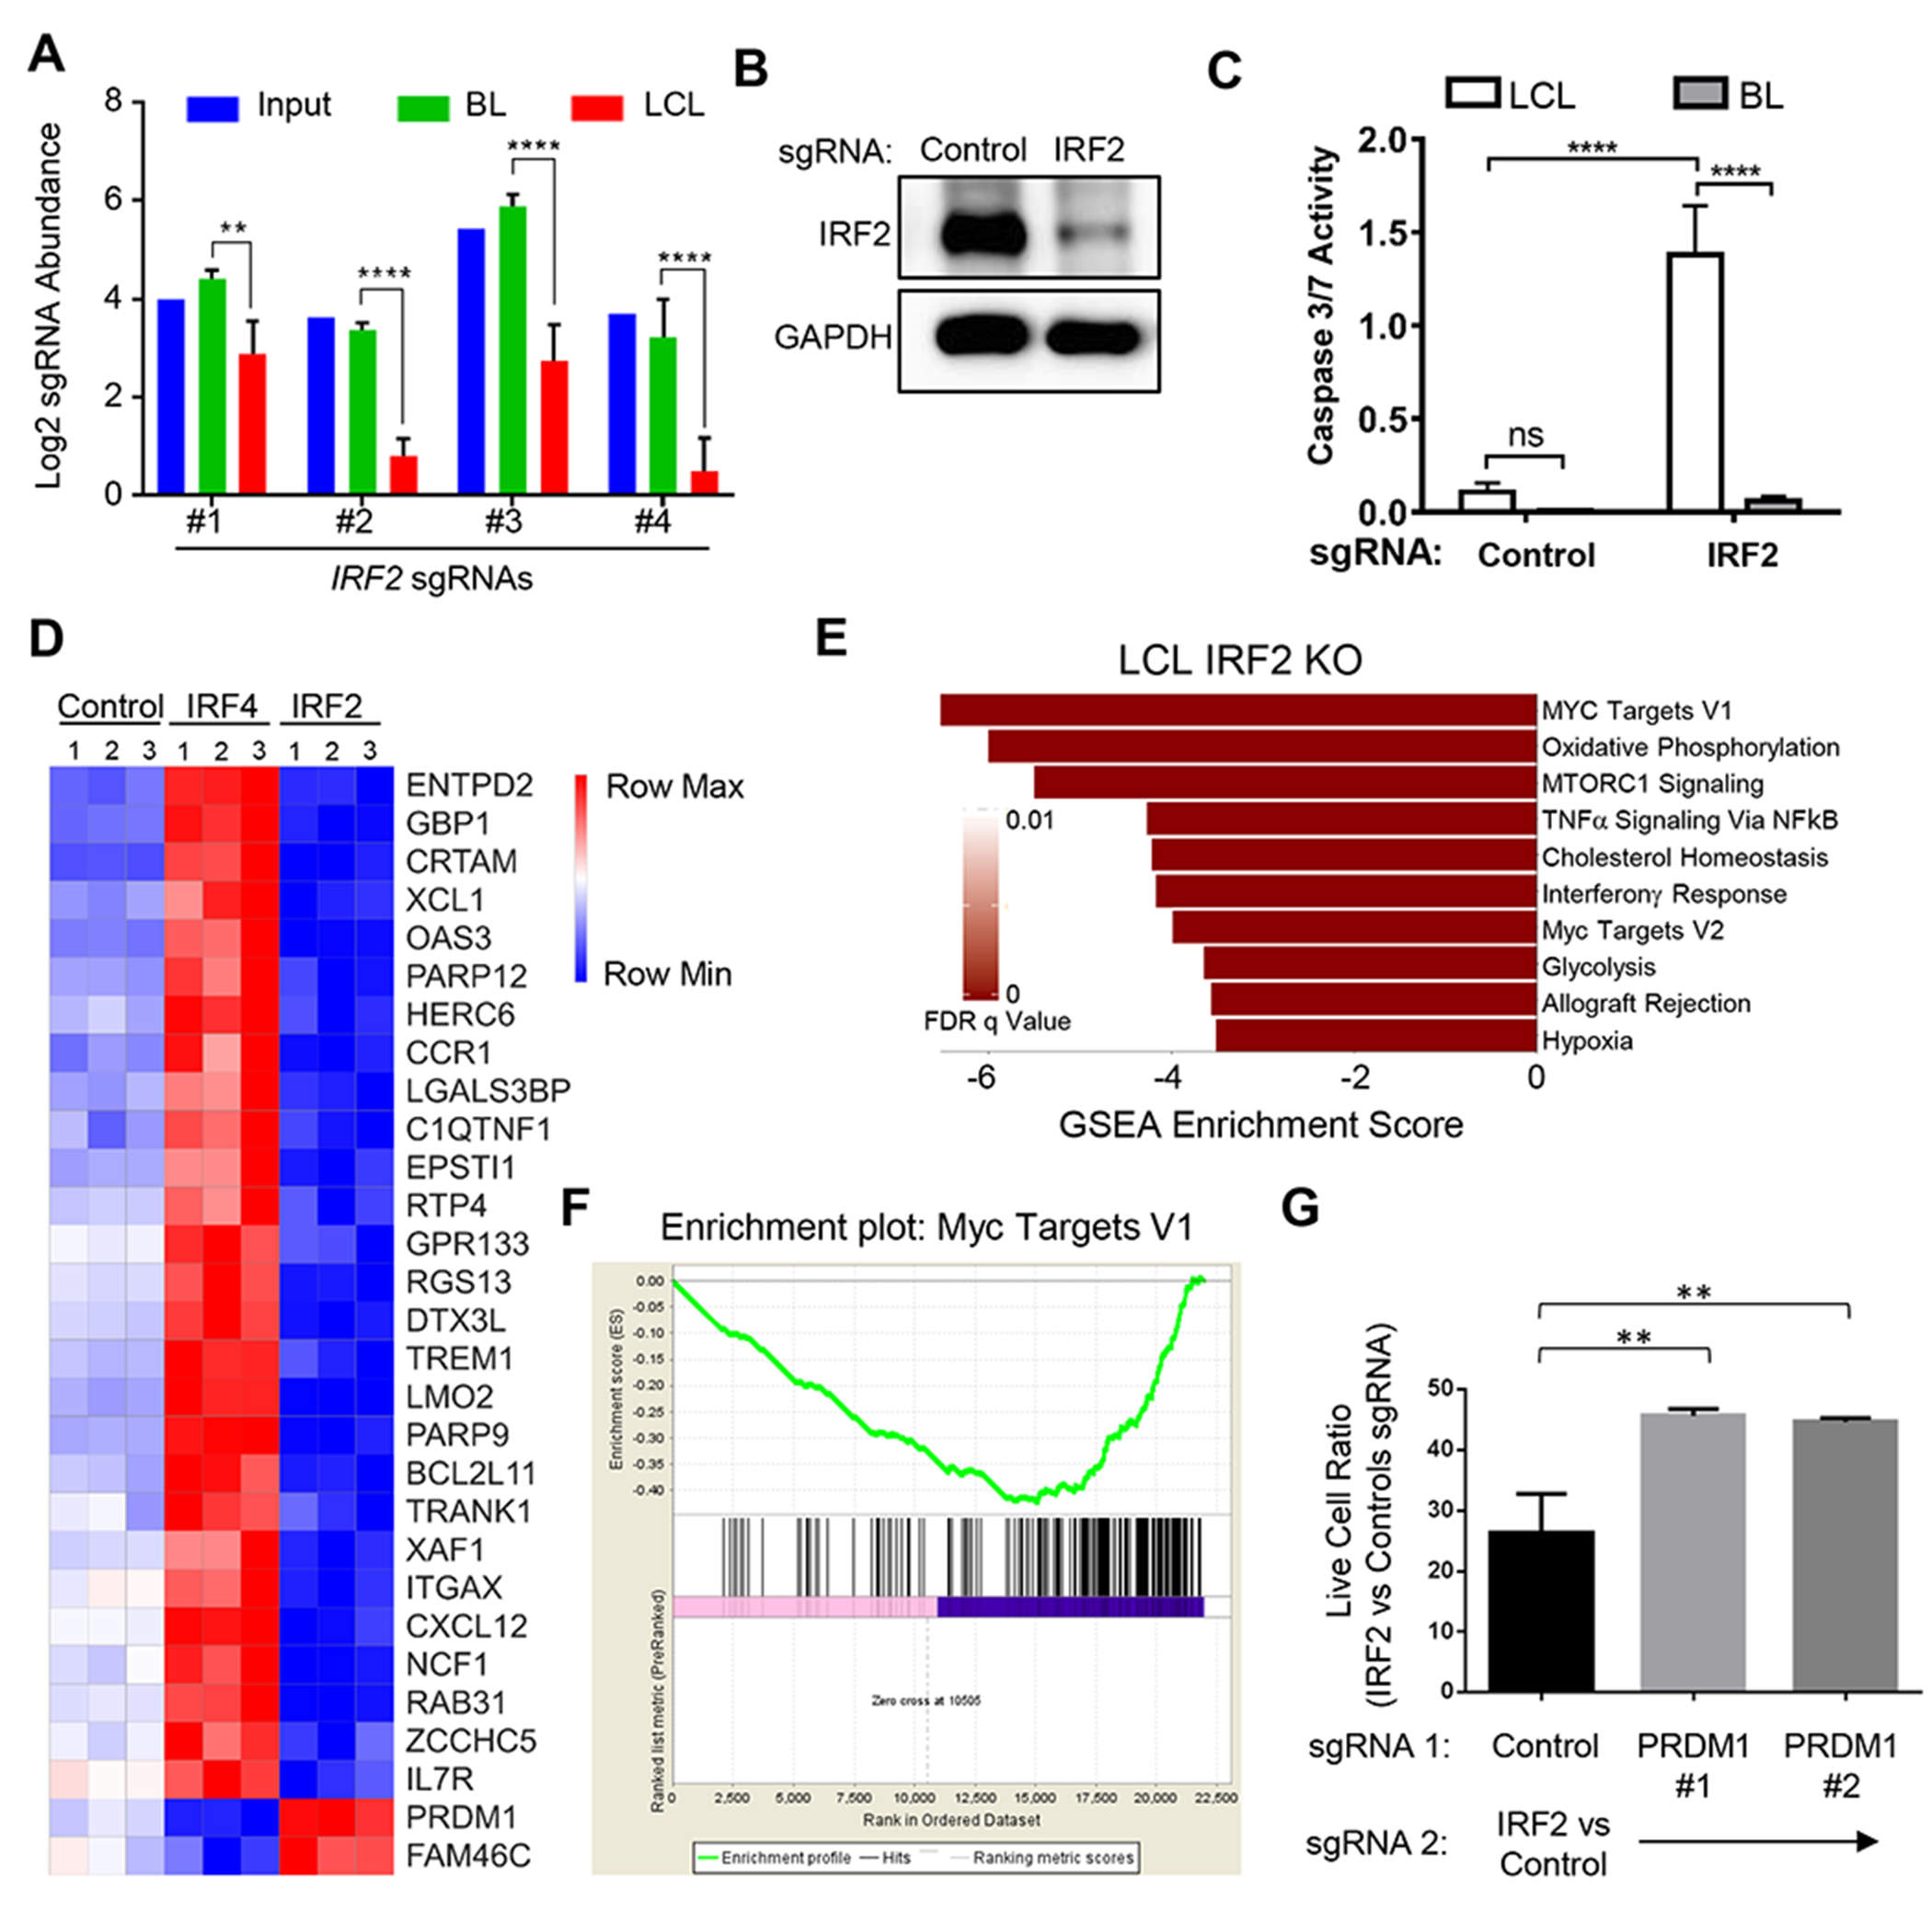
(A) Log2 normalized abundances of IRF2 sgRNAs in the library input, P3HR1 BL (Day 21) or GM12878 LCL (Day 21); **, p<0.01; ****, p<0.0001. (B) Immunoblot analysis of IRF2 in GM12878 whole cell lysates 5 days after transduction of the control or IRF2 sgRNA. (C) Caspase 3/7 activity in GM12878 (white box) or P3HR1 (grey box) 5 days after transduction of the control or IRF2 sgRNA. Mean and S.D. of three replicates are shown. (D) Heatmap visualization of RNAseq levels for representative GM12878 genes divergently affected by IRF2 versus IRF4 sgRNAs. Data from triplicate samples are shown. (E) GSEA Hallmark analysis of significantly downregulated gene sets in RNAseq datasets from GM12878 transduced with IRF2 sgRNA compared to control sgRNA. (F) GSEA Enrichment plot of MYC target genes in GM12878 following transduction of IRF2 versus control sgRNA. (G) GM12878 expressing control or independent PRDM1 sgRNAs (sgRNA 1) were subsequently transduced with IRF2 or control sgRNA (sgRNA 2). Normalized live cell numbers were expressed as the ratio of cells transduced with IRF2 sgRNA to those with control sgRNA. Mean and S.D. of triplicate experiments is shown (**p<0.01). See also Figure S7.
IRF2 has not been studied in detail in EBV-infected cells or in B-cells more generally. We therefore used RNAseq following IRF2 knockout to gain insights into LCL IRF2 dependency factor roles (Table S4). Interestingly, even though IRF4 and IRF2 were top LCL screen hits, their knockouts frequently produced opposite effects on host gene expression (Figure 7D). For instance, the interferon response gene IFI35 was significantly induced by IRF4 sgRNA, but suppressed by IRF2 sgRNA (Figure 7D). We hypothesized that LCLs may therefore require IRF2 to inhibit a tumor suppressor response induced by IRF4 addiction.
To gain further insights into IRF2 dependency factor roles, we performed GSEA on our IRF2 RNAseq dataset. This analysis identified MYC targets to be the most significantly down-regulated by IRF2 sgRNA expression (Figure 7E–F), and IRF2 sgRNA diminished LCL MYC mRNA level by ~40% (p<0.001) (Table S1). Notably, the IRF4 target gene PRDM1, which encodes the transcription repressor Blimp1, is a potent MYC repressor. PRDM1 is amongst the most highly EBV-induced gene upon primary human B-cell infection (Price et al., 2012). Since LCLs are addicted to MYC, we hypothesized that IRF2 might be a critical LCL dependency factor required to evade Blimp1 tumor suppressor effects on MYC. In support, Blimp1 and IRF2 compete for DNA binding sites (Kuo and Calame, 2004), and Blimp1 binds to a MYC promoter interferon response element (Lin et al., 2000). Furthermore, PRDM1 was the 5th most highly IRF2 knockout-induced LCL gene (Table S5). In support of this model, Blimp1 knockout partially rescued subsequent LCL IRF2 KO (Figure 7G and S7C). Once established, we were able to propagate LCLs doubly deficient for IRF2 and Blimp1, supporting the hypothesis that LCL IRF4 addition creates the synthetic IRF2 requirement. Collectively, these results identify and provide mechanistic insights into EBV SE-driven LCL dependency.
Discussion
Forward genetic approaches identified EBV genes critical for B-cell growth transformation (Kieff and Rickinson, 2007). We now use CRISPR/Cas9 to perform the first genome-wide loss-of-function screens for EBV transformed B cell host dependency factors. This approach identified non-redundant mechanisms by which EBV oncoproteins block tumor suppressor responses, including evasion of TNFα, BIM and Blimp1 effects. Our CRISPR and RNAseq datasets provide a resource for future investigation of EBV/host interactions and lymphomagenesis, and highlight the utility of CRISPR screens in studies of human tumor viruses, which collectively cause 15-20% of all human cancers.
CRISPR/Cas9 analysis revealed dependency factors important for EBV oncoprotein signaling, including known and newly-implicated pathway nodes. We identified CD19 and CD81 as critical for LMP2A-mediated AKT pathway activation, likely through obligatory roles in PI3K plasma membrane recruitment. While complement-tagged antigen bridges BCR-activated tyrosine kinases and CD19-bound PI3K, LMP2A signals independently of ligand (Cen and Longnecker, 2015). Our data raises the possibility that LMP2A instead directly associates with CD19 and/or CD81, perhaps mimicking CD21 signals to trigger PI3K recruitment. Further studies are required to identify how PI3K is recruited to epithelial cell membranes in the absence of CD19 expression, where LMP1 promotes PI3K lipid raft association (Meckes et al., 2013).
LMP1-mediated NF-κB activation is critical for LCL survival (Cahir-McFarland et al., 2004; Keller et al., 2006), yet target genes responsible for this phenotype have not been defined by systematic genetic analysis. Our CRISPR screens identified that LCLs are addicted to a small subset of LMP1/NF-κB target genes, including cFLIP, BATF, IRF4, IRF2, CDK6 and cyclin D2, which block tumor repressor programmed cell death responses and promote cell growth. We found cFLIP to be essential for LCL protection against TNFα-mediated apoptosis and necroptosis, and highlight cFLIP induction as a novel EBV therapeutic target. cFLIP. Notably, cFLIP is not highly expressed in BL cells with low NF-κB activity, and ectopic cFLIP expression renders BL cell lines resistant to extrinsic apoptosis (Snow et al., 2006; Tepper and Seldin, 1999). Our data suggest that both LMP1-induced cFLIP isoforms have essential roles in protection from apoptosis and necroptosis. Pro-survival BCL2 family members did not score as LCL-selective hits, perhaps due to redundancy between BCL2 homologues. An important goal for future studies will be to determine whether these LMP1-induced LCL dependency factors have shared roles in EBV+ Hodgkin lymphoma Reed-Sternberg cells, which highly co-express LMP1 and LMP2A (Weniger and Kuppers, 2016).
We identified BATF and IRF4 as key LCL dependency factors induced by multiple EBV oncoproteins. The AP-1 complex subunit BATF is upregulated within 24 hours of EBV infection by EBNA2 and later also by LMP1-mediated NF-κB (Dirmeier et al., 2005; Farrell et al., 2004; Johansen et al., 2003; Zhao et al., 2014). EBNA3C, LMP1/NF-κB and LMP2A upregulate IRF4 (Banerjee et al., 2013; Cahir-McFarland et al., 2004; Minamitani et al., 2015; Seto et al., 2010). We provided the first evidence that BATF is necessary for LCL survival, and extended the observation that IRF4 siRNA knockdown augments DNA damage-induced apoptosis (Banerjee et al., 2013). Residual IRF4 expression may account for the milder RNAi phenotype.
BATF and IRF4 were each critical for EBV-mediated silencing of BIM, a major lymphocyte BH3-only apoptosis executioner protein induced by oncogenic stress. EBNA3 oncoproteins are also necessary for EBV-mediated BIM suppression (Paschos et al., 2012; Wood et al., 2016), but require host factors for recruitment to DNA. Taken together with the observation that BATF, IRF4, EBNA3A and EBNA3C co-occupy a BCL2L11 locus binding site, our results support a model in which DNA-bound BATF/IRF4 recruit EBNA3A/3C/co-repressor complexes to silence BIM. Alternatively, BATF/IRF4 may independently recruit co-repressors to BCL2L11.
We uncovered key IRF4 and BATF roles in LCL MYC expression, and as expected, MYC sgRNAs were toxic to both GM12878 and P3HR1. Yet, LCL IRF4 dependency necessitates evasion of Blimp1, a well characterized IRF4 B-cell target that suppresses MYC (Lin et al., 1997; Nutt et al., 2015). To maintain MYC activity, NF-κB/IRF4-dependent B-cell lymphomas frequently inactivate Blimp1 by somatic mutation (Mandelbaum et al., 2010; Pasqualucci et al., 2011; Tam et al., 2006). Furthermore, Blimp1 over-expression triggers EBV lytic replication (Reusch et al., 2015; Vrzalikova et al., 2011). We therefore hypothesized that EBV uses IRF2 to evade IRF4-triggered Blimp1 tumor suppression, and Blimp1 knockout significantly rescued subsequent LCL IRF2 loss. A future goal will be to identify whether LMP1 activates IRF2, given its direct roles in IRF7 activation (Huye et al., 2007; Ning et al., 2008; Song et al., 2008). Likewise, two IRF2 binding partners, IRF2BP2 and IRF2BPL, are EBV SE targets (Zhou et al., 2015), and redundancy may have precluded them from scoring in our CRISPR screens. It will be of interest to determine whether IRF2BP2 and/or IRFF2BPL support IRF2 pro-survival LCL roles.
Recombinant EBV strains that lack the BHRF1 miRNA cluster are impaired for B-cell transformation in vitro (Feederle et al., 2011; Seto et al., 2010). The LCL-selective hit PSMD13 and the BL-selective hit KMT2D are BHRF1-1 targets (Skalsky et al., 2012). Additional EBV miRNA targets did not have score as LCL- or BL-selective hits, perhaps because their expression is suppressed by EBV miRNAs or because EBV miRNA targets may more frequently have tumor suppressor roles (Bernhardt et al., 2016). Indeed, all 4 sgRNAs against the BHRF1 miRNA target PTEN tumor suppressor were enriched in GM12878 Day 21 pools, suggesting that they enhanced LCL growth.
EBV oncoproteins lack enzymatic activity and may not be druggable targets. Importantly, systematic CRISPR genetic analysis identified multiple EBV-transformed B-cell synthetic lethal targets, including host enzymes for which inhibitors are in clinical use or late-stage human trials. These include small molecule inhibitors of SYK, PI3K, MDM2, CDK4/6, IRF4, and super-enhancers. A future goal will be to identify combinations that synergistically block EBV-transformed B-cell growth and survival.
STAR★Methods
CONTACT FOR REAGENT AND RESOURCE SHARING
Further information and requests for resources and reagents should be directed to and will be fulfilled by the Lead Contact, Benjamin E Gewurz (bgewurz@bwh.harvard.edu).
EXPERIMENTAL MODEL AND SUBJECT DETAILS
Cell lines
GM12878 LCL were obtained from Coriell Institute for Medical Research and P3HR1 clone 16 was obtained from Dr. Elliott Kieff. Low passage GM12878 and P3HR1 aliquots were used for all studies. For validation studies, an additional low-passage LCL (LCL #2) and the EBV+ Burkitt lymphoma Daudi cell line (ATCC) were used. The BL cell lines BL41, BL41 superinfected with the EBV strain B95.8 (BL41-B95.8), and LCL #2 were gifts from Dr. Elliott Kieff. The BL cell lines KEM I, KEM III, MUTU I and MUTU III were gifts from Dr. Jeff Sample. Cell lines with stable Streptococcus pyogenes Cas9 used in the study were established by lentiviral transduction and blasticidin selection, as previously described (Greenfeld et al., 2015). Cas9 activity assays were performed using plamsid pXPR-011 (a gift from John Doench, also available on Addgene Cat#59702), which expresses GFP and a sgRNA against GFP, as described (Doench et al., 2014). The sgRNA targeting GFP programs Cas9 to edit the GFP cDNA, and results in loss of GFP expression. The extent of GFP loss is quantitated by flow cytometry. For all transductions, lentiviruses were made by transfecting 293T (ATCC), as previously described (Greenfeld et al., 2015). Cells were cultured in a humidified chamber at 37 degree Celsius with 5% CO2. B-cells were grown in GIBCO RPMI 1650 medium (Life Technologies) supplemented with 10% fetal calf serum (FCS). 293T were grown in Dulbecco’s Modified Eagle’s Medium (DMEM) with 10% FCS. Puromycin was used at 3μg/ml. Hygromycin was used at 200 μg/ml for 96 hours, then 100 μg/ml thereafter. Blasticidin was used at 5 μg/ml. Cells were routinely confirmed to be negative for mycoplasma contamination by the MycoAlert Mycoplasma Detection Kit (Lonza).
Primary Human B cells
Primary human B-cells were purified from the peripheral blood of anonymous donors that was obtained from Brigham and Women’s Hospital. Cells were cultured in GIBCO RPMI 1650 medium (Life Technologies) supplemented with 10% FCS in a humidified chamber at 37 degree Celsius with 5% CO2.
METHOD DETAILS
CRISPR/Cas9 Loss-of-Function Screens
The Broad Institute Avana sgRNA library (Doench et al., 2016) was used to generate biological quadruplicate P3HR1 and GM12878 libraries, for use in our growth and survival screens. Briefly, 130 million Cas9-expressing P3HR1 or GM12878 were infected with the Avana library at a multiplicity of infection (MOI) of 0.3 by spinoculation in 12-well plates at 300g for 2 hours, in the presence of 4 μg/μl polybrene. Each human gene is targeted by four distinct sgRNAs, which use unique targeting sequences and PAM sites. Plates were then returned to 37°C with 5% CO2 for 6 hour, followed by exchange into fresh RPMI after 6 hours. 48 hours later, transduced cells were selected by puromycin (3 μg/ml). B-cell libraries were passaged every 72 hours for 21 days, keeping library cell number at 40 million with each passage to maintain adequate sgRNA complexity. After 21 days, genomic DNA was harvested from 40 million cells per each screen replicate, using the Blood and Cell Culture DNA Maxi Kit (Qiagen), according to the manufacturer protocol. sgRNAs were PCR amplified as described (Doench et al., 2016), and sgRNA abundance was quantified by an Illumina Hiseq sequencer. We then used the STARS algorithm (Doench et al., 2016) to calculate hit statistical significance, using a stringent cutoff of q < 0.05 (p-value adjusted for the False Discovery Rate). For all hits, at least two independent sgRNAs scored independently.
Next Generation Sequencing and Data Processing
To attach sequencing adaptors and barcode samples, PCR of sgDNA was performed, in multiple 100 μl reactions (total volume) containing a maximum of 10 μg genomic DNA, as described (Doench et al., 2016). Per 96 well plate, a master mix consisted of 75 μL ExTaq DNA Polymerase (Clontech), 1000 μL of 10x Ex Taq buffer, 800 μL of dNTP provided with the enzyme, 50 μL of P5 stagger primer mix (stock at 100 μM concentration), and 2075 μL water. Each well consisted of 50 μL sgDNA plus water, 40 μL PCR master mix, and 10 μL of a uniquely barcoded P7 primer (stock at 5 μM concentration). PCR cycling conditions: an initial 1 minute at 95°C; followed by 30 seconds at 94°C, 30 seconds at 52.5°C, 30 seconds at 72°C, for 28 cycles; and a final 10 minute extension at 72°C. P5/P7 primers were synthesized at Integrated DNA Technologies (IDT). Samples were purified with Agencourt AMPure XP SPRI beads according to manufacturer’s instructions (Beckman Coulter). Samples were sequenced on a HiSeq2000 (Illumina). Reads were counted by first searching for the CACCG sequence in the primary read file that appears in the vector 5’ to all sgRNA inserts. The next 20 nts are the sgRNA insert, which was then mapped to a reference file of all possible sgRNAs present in the library. The read was then assigned to a condition (e.g. a well on the PCR plate) on the basis of the 8nt barcode included in the P7 primer. The resulting matrix of read counts was first normalized to a reads per million within each condition by the following formula: read per sgRNA / total reads per condition × 106. Reads per million were then log2-transformed, by first adding one to all values, which is necessary in order to take the log of sgRNAs with zero reads.
STARS Analysis
STARS is a gene ranking algorithm for CRISPR-based genetic perturbation screens, which we used to evaluate the rank and statistical significance of P3HR1 versus GM12878 screen hits according to the manual (Doench et al., 2016). STARS leverages the abundance of the four independent sgRNAs targeting each human gene and compares their values between two screen conditions (i.e. GM12878 vs P3HR1). Using the most recent bioinformatic data available from John Doench and the Broad Institute (Doench et al., 2016), sgRNAs predicted to have >5 genome-wide off-target sites were removed from consideration. We note that the majority of Avana sgRNAs are not predicted to have off-target sites, and that each sgRNA against a human gene has a distinct off-target signature, raising our confidence when >1 sgRNA per set of 4 yields a similar biological pheontype. The log2-fold-change of each sgRNA was determined by comparing average values from quadruplicate GM12878 versus P3HR1 CRISPR/Cas9 screens. We then determined the percent-rank of each sgRNA: each sgRNA was ranked by log2-fold change, and this number was then divided by the total number of sgRNAs in the pool to determine a percent-rank. These percent-rank values were then averaged across biological replicates. For performing STARS analysis, the percent-rank values across subpools were merged.
CRISPR/Cas9 Mutagenesis Studies
Following the Avana screen, specific human genes were targeted by CRISPR/Cas9 engineering, using Avana sgRNA sequences. These can be found in Table S6. All sgRNA oligos were supplied by Integrated DNA Technologies, Inc. and cloned into the pLentiGuide-Puro vector (Addgene), according to the Zhang Lab protocol (http://www.genome-engineering.org/crispr/wp-content/uploads/2014/05/CRISPR-Reagent-Description-Rev20140509.pdf), or into pLenti Sp BsmBI sgRNA Hygro (Addgene). Puromycin selection (3μg/ml) or hygromycin (200 ug/ml) was added 48 hours post transduction. Since CRISPR/Cas9 editing frequently does not result in significant loss of target gene mRNA, we assayed for loss of target gene protein expression by immunoblotting.
Cell Number and Caspase Activation Assays
Cell number was quantified by CellTiter-Glo (CTG, Promega) live cell assay, as previously described (Greenfeld et al., 2015). Normalized cell growths for cell growth curves were calculated by normalizing CTG values of the samples at different time points to the CTG values of the same samples at the starting time point (i.e. day 1). Caspase 3/7 and 8 activities were quantified by Caspase-Glo assays (Promega) according to manufacturer’s manual, and normalized to the cell number of the same sample determined by CTG assay. All values are quantitated on a Molecular Devices plate reader. The average and standard deviation of biological triplicate experiments were used to calculate statistical significance by non-paired Student’s T-test, using GraphPad software. P value < 0.05 cutoff was used to assign significance.
Double Knockout Analysis
For double CRISPR/Cas9 knockout experiments, cells were separately transduced and selected for each round of sgRNA perturbation. Loss of target gene expression was validated via immunoblotting after the first round of selection, and cells were subject to the next perturbation. The sgRNA vectors are pLentiGuide-puro (Addgene) and pLenti Sp BsmBI sgRNA Hygro (a gift from Rene Maehr, also available on Addgene) which bear different selection markers. Cells were selected for 2 weeks with hygromycin 200 ug/ml, and then transduced with lentivirus encoding the second sgRNA and puromycin resistance marker.
Antibody Rescue
Following transduction with control or CFLAR sgRNA-expressing lentivirus and 24 hours after puromycin selection, cells were plated at 300,000 cells/ml in 12-well plates. Vehicle control, anti-TNF-α antibody (Invivogen, 1:1000), anti-FAS-L (BioLegend, 1:1000), or 1:1000 of both neutralizing antibodies were added 24 hours after transduction, and refreshed 48 hours later. Live cell numbers were quantitated by CellTiter-Glo assay as described above.
Small Molecule Inhibitor Assay
Unless otherwise indicated, for all other chemical inhibitor experiments, cells were initially plated at 300,000 cells/ml in 12-well plates. MLN494 (Active Biochem) or Palbociclib was added to the cells at different concentrations as indicated. 48 hours later, live cell numbers were determined by CellTiter-Glo assay. For LCL studies, GM12878 cells were transduced with pXPR-011 or CFLAR sgRNA. 24 hours after puromycin selection, cells were plated at 300,000 cells/ml in 12-well plates. Vehicle control (0.5% DMSO), 100μM Necrostatin-2 (Nec-2) (ApexBio), 100μM Z-VAD-FMK (ApexBio), or 50μM Nec-2 + 50μM Z-VAD-FMK were added to the cells. All wells had a final concentration of 0.5% DMSO. Live cell numbers were quantitated by CellTiter-Glo assay.
Quantitative Real-time PCR (qPCR)
Total RNA was harvested from cells using a PureLink RNA Mini Kit (Life Technologies) and subjected to PureLink DNase digestion. Quantitative real-time PCR was performed using an CFX96 Touch™ Real-Time PCR Detection System (Bio-Rad) with Power SYBR Green RNA-to-Ct 1-Step Kit (Applied Biosystems), and data were normalized to endogenous control 18S rRNA. Relative expression or fold induction was calculated using 2-ΔΔCt method with the normalized Ct value of the untreated or mock treated sample at the earliest time point being the baseline. All samples were run in technical triplicates and at least three independent experiments were performed.
Flow Cytometry
10,000 live cells were acquired and analyzed by a FacsCalibur flow cytometer (BD). 72 hours post selection (unless otherwise indicated), cells were stained using fluorophore-conjugated antibodies against markers of interest or using the BD Annexin V-FITC apoptosis detection kit, sorted on a BD FACSCalibur and analyzed with BD CellQuest Pro software (BD Biosciences).
Immunoblot Analysis
Western blots were performed as previously described (Greenfeld et al., 2015). Briefly, whole cell extracts were resolved by SDS-PAGE, transferred to nitrocellulose filters at 100V for 1 hour, and developed with indicated primary antibodies and horse-radish peroxidase coupled secondary antibodies from Cell Signaling Technology. Blots were developed by ECL chemiluminescence and imaged on a Carestream workstation.
Primary B-cell infection
Primary human B-cells were purified from peripheral blood of anonymous donors obtained from Brigham and Women’s Hospital via negative selection using RosetteSep™ Human B Cell Enrichment Cocktail and EasySep Human B Cell Enrichment Kits (StemCell Technologies), following the manufacturer’s protocols. >95% B-cell purity was confirmed by FACS for plasma membrane CD19 positivity. Cells were infected with B95.8 strain EBV at a MOI of 5.
RNA-seq
96 hours following lentiviral transduction and 48 hours following puromycin selection, dead cells were removed by Dead Cell Removal Kit (Miltenyi Biotec), following the manufacturer’s manual. Total RNAs were subsequently isolated using PureLink RNA Mini Kit (Thermo Fisher Scientific) following the manufacturer’s manual. An in-column DNA digestion step was included to remove any residual genomic DNA contamination. To construct RNA-seq libraries, 500 ng total RNA was used for polyA mRNA-selection using NEBNext Poly(A) mRNA Magnetic Isolation Module (New England Biolabs), followed by library construction via NEBNext Ultra RNA Library Prep Kit for Illumina (New England Biolabs). Each experimental treatment was performed in triplicate. Libraries were multi-indexed, pooled and sequenced on an Illumina NextSeq 500 sequencer using single-end 75 bp reads (Illunima).
RNA-seq Data Analysis and Visualization
Adaptor-trimmed Illumina reads for each individual library were mapped back to the human GRCh37.83 transcriptome assembly using STAR2.5.2b (Dobin et al., 2013). FeatureCounts was used to estimate the number of reads mapped to each contig (Liao et al., 2014). Only transcripts with at least 5 cumulative mapping counts were used in this analysis. DESeq2 was used to evaluate differential expression (DE) (Love et al., 2014). DESeq2 uses a negative binomial distribution to account for overdispersion in transcriptome data sets. It is conservative and uses a heuristic approach to detect outliers while avoiding false positives. Each DE analysis was composed of a pairwise comparison between experimental group and the control group. Differentially expressed genes were identified after a correction for false discovery rate (FDR). For more stringent analyses, we set the cutoff for truly differentially expressed genes as adjusted p value (FDR corrected) < 0.05 and absolute fold change > 1.5. DE genes meeting this cuffoff were selected and subject to downstream bioinformatics and functional analyses, including clustering, data visualization, GO annotation and pathway analysis. Venn diagrams were generated using a web-based application BioVenn (Hulsen et al., 2008). Heatmap was generated by feeding the Variance-Stabilizing Transformed values of selected DE genes from DESeq2 into Morpheus (https://software.broadinstitute.org/morpheus/).
Gene Set Enrichment Analysis (GSEA) and Enrichr Analysis
To perform GSEA analysis on RNA-seq datasets, the shrunken log fold changes of all genes in DEseq2 result output (experimental versus control) was used to generate a ranked list for GSEA (Subramanian et al., 2005). Preranked analysis using the Molecular Signatures Database v5.2 (H: hallmark gene sets). Top 10 most enriched gene sets ranked by GSEA normalized enrichment score were visualized using ggplot2 package in R. Gene sets with a nominal p value < 0.05 and false discovery rate (FDR) <0.25 were defined as significantly enriched. Enrichr was employed to perform gene list-based gene set enrichment analysis on selected gene subset. Top 10 most enriched gene sets ranked by Enrichr combined score were visualized using ggplot2 package in R. The algorithm to calculate the combined score is explicitly described previously (Chen et al., 2013).
cDNA rescue
cDNA rescue constructs were synthesized by GenScript and cloned into pXPR_118 vector (gift from John Doench). To abrogate Cas9 targeting, a silent point mutation was engineered into the proto-spacer adjacent motif. LCLs with stable N-terminal HA-tag cDNA rescue construct expression were established in GM12878 LCLs by lentiviral transduction and hygromycin selection. cDNA expression was confirmed by immunoblot. GM12878 with stable V5-tagged GFP were established for comparison. LCLs with stable control and rescue cDNA expression were then used in CRISPR experiments, as indicated. The design of rescue cDNAs for IRF4, BATF and CFLAR CRISPR knockout is described in detail below. sgRNA sequence is highlighted. PAM sequence is underlined. Mutations/insertions are in red. Intronic region is in parentheses.
| IRF4 KO and Rescue | |
|---|---|
| sgRNA | 5’ – GCAGGACTACAACCGCGAGG – 3’ |
| Genomic DNA | 5’ – G CAG GAC TAC AAC CGC GAG GAG G – 3’ |
| Rescue cDNA | 5’ – G CAG GAC TAC AAC CGC GAG GAA G – 3’ |
| Rescue cDNA sequence surrounding the PAM site mutation (in red, sgRNA sequence in yellow) | GGCAAGTACCCCGGGCTGGTGTGGGAGAACGAGGAGAAGAGCATCTTCCGCATCCCCTGGAAGCACGCGGGCAAGCAGGACTACAACCGCGAGGAAGACGCCGCGCTCTTCAAGGCTTGGGCACTGTTTAAAGGAAAGTTCCGAGAAGGCATCG |
| BATF (sgRNA target sequence is on the anti-sense strand and comprised of both intronic, denoted by parentheses, and exonic regions) | |
| sgRNA | 5’ – GACTCTACCTGTTTGCCAGG – 3’ |
| Genomic DNA | 5’ – (GACTCTA)C CTG TTT GCC AGG GGG – 3’ |
| Rescue cDNA (reverse complement) | 5’ – C CTG TTT GCC AGG TGC GGG – 3’ |
| Rescue cDNA sequence surrounding the PAM site | ATGCCTCACAGCTCCGACAGCAGTGACTCCAGCTTCAGCCGCTCTCCTCCCGCACCTGGCAAACAGGACTCATCTGATGATGTGAGAAGAGTTCAGAGGAGGG |
| CFLAR-S (sgRNA is on the anti-sense strand) | |
| sgRNA | 5’ – TATAGTCCGAAACAAGGTGA – 3’ |
| Genomic DNA | 5’ – T ATA GTC CGA AAC AAG GTG AGG G – 3’ |
| Rescue cDNA (reverse complement) | 5’ – T ATA GTC CGA AAC AAG GTG AGG A – 3’ |
| Rescue cDNA sequence surrounding the PAM mutation (in red) | GTATCTTGAAGATGGACAGAAAAGCTGTGGAGACCCACCTGCTCAGGAATCCTCACCTTGTTTCGGACTATAGAGTGCTGATGGCAGAGATTGGTGAGGATTTGGATAAATCTGATGTGTCCTCATTAATTTTCCTCATGAAGGATTACATGGGCCG |
QUANTIFICATION AND STATISTICAL ANALYSIS
Unless otherwise indicated, all bargraphs and linegraphs represent the arithmetic mean of three independent experiments with error bars denoting standard deviations. Significance between the control and experimental groups, or indicated pairs of groups, was assessed using the unpaired Student’s t test in the GraphPad Prism 7 software. P values correlate with symbols as follows, unless otherwise indicated: ns = not significant, p > 0.05; * p ⩽ 0.05; ** p ⩽ 0.01; *** p ⩽ 0.001; **** p ⩽ 0.0001.
The statistical significance of the screen hits was calculated by STARS analysis as described above and in more details in Doench’s work (Doench et al., 2016). STARS generates for each hit a p-value and a FDR-corrected p-value (q-value). A hit with a q-value < 0.05 from the STARS analysis of quadruplicate screens was defined as a significant hit. For Figure S1B–C, correlation analysis and Principal Component Analysis (PCA) among quaduplicate screens were determined and visualized using R 3.3.2.
For GSEA preranked analysis, gene sets with a nominal p value < 0.05 and FDR < 0.25 were defined as significantly enriched. The GSEA Enrichment Score is the Normalized Enrichment Score calculated by GSEA. The algorithm has been described previously (Subramanian et al., 2005). Enrichr was employed to perform gene list-based gene set enrichment analysis on LCL and BL selective hits. Top 10 most enriched gene sets ranked by Enrichr combined score were visualized using ggplot2 package in R. The algorithm to calculate the combined score has been explicitly described previously (Chen et al., 2013)
DATA AND SOFTWARE AVAILABILITY
All RNA-seq datasets have been deposited to NIH GEO Omnibus, accession #GSE93681.
Supplementary Material
KEY RESOURCES TABLE
| REAGENT or RESOURCE | SOURCE | IDENTIFIER |
|---|---|---|
| Antibodies | ||
| Mouse monoclonal anti-alpha Tubulin Clone DM1A | Abcam | Cat#ab7291; RRID: AB_2241126 |
| Rabbit polyclonal anti-IRF2 antibody | Bethyl | Cat#A303-380-A; RRID: AB_10954097 |
| Rabbit polyclonal anti-CDK4 antibody | Bethyl | Cat#A304-225A; RRID: AB_2620422 |
| Rabbit polyclonal anti-CDK6 antibody | Bethyl | Cat#A304-937A; RRID: AB_2621131 |
| Mouse monoclonal anti-BATF antibody | BioLegend | Cat#654802; RRID: AB_2561889 |
| Rabbit monoclonal anti-Bim antibody Clone C34C5 | Cell Signaling Technology | Cat#2933; RRID: AB_1030947 |
| Rabbit Anti-Blimp-1 / PRDI-BF1 Monoclonal Antibody, Unconjugated, Clone C14A4 | Cell Signaling Technology | Cat#9115; RRID: AB_2169699 |
| Rabbit polyclonal anti-IRF-4 Antibody | Cell Signaling Technology | Cat#4964; RRID: AB_10698467 |
| Phospho-Syk (Tyr525/526) Rabbit monoclonal antibody Clone C87C1 | Cell Signaling Technology | Cat#2710; RRID: AB_2197222 |
| Anti-rabbit IgG, HRP-linked Antibody | Cell Signaling Technology | Cat#7074; RRID: AB_2099233 |
| Anti-mouse IgG, HRP-linked Antibody | Cell Signaling Technology | Cat#7076; RRID: AB_330924 |
| Influenza hemagglutinin (HA) epitope (YPYDVPDYA) antibody | Covance Research Products Inc | Cat#MMS-101P; RRID: AB_2314672 |
| Mouse monoclonal anti-Glyceraldehyde-3-Phosphate Dehydrogenase antibody Clone 6C5 | Millipore | Cat# MAB374; RRID:AB_2107445 |
| Rabbit polyclonal Phospho-Akt (Ser473) Antibody | Cell Signaling Technology | Cat# 9271; RRID:AB_329825 |
| Mouse monoclonal anti-GAPDH antibody | Proteintech Group | Cat# 60004-1-Ig; RRID:AB_2107436 |
| Mouse monoclonal anti-FLIPS/L antibody Clone G-11 | Santa Cruz Biotechnology | Cat# sc-5276; RRID:AB_627764 |
| Mouse monoclonal anti-TNF-R1 antibody Clone H-5 | Santa Cruz Biotechnology | Cat# sc-8436; RRID:AB_628377 |
| Mouse monoclonal Anti-alpha-Tubulin antibody | Sigma-Aldrich | Cat# T5168; RRID:AB_477579 |
| Mouse monoclonal anti-Human CD19 Alexa Fluor 488 antibody | eBioscience | Cat# 53-0199-41; RRID:AB_1659679 |
| Mouse monoclonal FITC anti-human CD81 (TAPA-1) antibody | BioLegend | Cat# 349503; RRID:AB_10642824 |
| Mouse monoclonal anti-EBNA1 antibody [OT1X] | Dr. Jaap Middeldorp | N/A |
| Mouse monoclonal anti-EBNA2 antibody [PE2] | Dr. Elliott Kieff | N/A |
| Sheep polyclonal anti-EBNA3A antibody | Exalpha Biologicals | Cat# F115P |
| Mouse monoclonal anti-EBNA3C antibody [A10] | Dr. Elliott Kieff | N/A |
| Mouse monoclonal anti-EBV LMP1 antibody (S12) | Dr. David Thorley-Lawson | N/A |
| Mouse monoclonal anti-EBV LMP2A antibody Clone 14B7 | Dr. Richard Longnecker | N/A |
| Rabbit Anti-NF-KappaB p65, phosphor (Ser536) Monoclonal Antibody, Unconjugated, Clone 93H1 | Cell Signaling Technology | Cat# 3033; RRID:AB_331284 |
| Rabbit polyclonal anti-NFκB p65 Antibody Clone C-20 | Santa Cruz Biotechnology | Cat# sc-372; RRID:AB_632037 |
| Mouse monoclonal Anti-NF-kappaB p52 antibody | Millipore | Cat# 05-361; RRID:AB_309692 |
| Rabbit polyclonal V5 Antibody | Bethyl | Cat# A190-120P; RRID:AB_162729 |
| Cleaved PARP (Asp214) XP Rabbit monoclonal antibody Clone D64E10 | Cell Signaling Technology | Cat# 5625P; RRID:AB_10699460 |
| Mouse monoclonal CD71 antibody Clone 3B8 2A1 | Santa Cruz Biotechnology | Cat# sc-32272, RRID:AB_627167 |
| Purified anti-human CD178 (Fas-L) mouse monoclonal antibody | BioLegend | Cat# 306402; RRID:AB_314600 |
| Neutralizing human IgG1 monoclonal antibody against human TNF-α | InvivoGen | Cat# htnfa-mab1; RRID:AB_11124934 |
| Bacterial and Virus Strains | ||
| B95.8 Epstein-Barr Virus | Dr. Elliott Kieff | N/A |
| Biological Samples | ||
| Chemicals, Peptides, and Recombinant Proteins | ||
| MLN4924 | Active Biochem | Cat# A-1139 |
| Agencourt AMPure XP SPRI beads | Beckman Coulter | Cat# A63880 |
| Necrostatin-2 (Nec2) | ApexBio | Cat# A3652 |
| Z-VAD-FMK | ApexBio | Cat# A1902 |
| Palbociclib | ApexBio | Cat# A8316 |
| Critical Commercial Assays | ||
| FITC Annexin V Apoptosis Detection Kit I | BD Biosciences | Cat# 556547 |
| Power SYBR Green RNA-to-Ct 1-Step Kit | Applied Biosystems | Cat# 4389986 |
| CellTiter-Glo® Luminescent Cell Viability Assay | Promega | Cat# G7570 |
| Caspase-Glo® 3/7 Assay Systems | Promega | Cat# G8091 |
| Caspase-Glo® 8 Assay Systems | Promega | Cat# G8201 |
| Dead Cell Removal Kit | Miltenyi Biotec | Cat# 130-090-101 |
| NEBNext Poly(A) mRNA Magnetic Isolation Module | New England Biolabs | Cat# E7490 |
| NEBNext Ultra RNA Library Prep Kit for Illumina | New England Biolabs | Cat# E7530 |
| RosetteSep™ Human B Cell Enrichment Cocktail; Immunodensity isolation of untouched B cells | Stemcell Technologies | Cat# 15064 |
| EasySep Human B cell enrichment kit | Stemcell Technologies | Cat# 19054 |
| MycoAlert Mycoplasma Detection Kit | Lonza | Cat# LT07-218 |
| Blood and Cell Culture DNA Maxi Kit | Qiagen | Cat# 13362 |
| PureLink RNA Mini Kit | Thermo Fisher Scientific |
Cat# 12183018A |
| Deposited Data | ||
| Raw and analyzed data | This paper | GEO# GSE93681 |
| Experimental Models: Cell Lines | ||
| GM12878 lymphoblastoid cell line (LCL) | Coriell Institute for Medical Research | N/A |
| P3HR1 clone 16 | Dr. Elliott Kieff | N/A |
| LCL #2 | Dr. Elliott Kieff | N/A |
| EBV+ Burkitt lymphoma Daudi cell line | ATCC | CCL-213 |
| EBV− Burkitt lymphoma BL41 cell line | Dr. Elliott Kieff | N/A |
| BL41 superinfected with the EBV strain B95.8 (BL41-B95.8) | Dr. Elliott Kieff | N/A |
| Burkitt lymphoma KEM I cell line | Dr. Jeff Sample | N/A |
| Burkitt lymphoma KEM III cell line | Dr. Jeff Sample | N/A |
| Burkitt lymphoma MUTU I cell line | Dr. Jeff Sample | N/A |
| Burkitt lymphoma MUTU III cell line | Dr. Jeff Sample | N/A |
| GM12878-Cas9 | This paper | N/A |
| P3HR1-Cas9 | This paper | N/A |
| LCL #2-Cas9 | This paper | N/A |
| Daudi-Cas9 | This paper | N/A |
| 293T | ATCC | CRL-3216 |
| Experimental Models: Organisms/Strains | ||
| Oligonucleotides | ||
| BATF sgRNA #1: GACTCTACCTGTTTGCCAGG | This paper | N/A |
| BATF sgRNA #2: AGGACTCTACCTGTTTGCCA | This paper | N/A |
| CFLAR sgRNA #1: TTTCCCGTAAAATATCCAGA | This paper | N/A |
| CFLAR sgRNA #2: TATAGTCCGAAACAAGGTGA | This paper | N/A |
| CCND2 sgRNA #1: GTAAATGCACAGCTTCTCCG | This paper | N/A |
| CCND2 sgRNA #2: ACCTACCTCCAGCATCCAGG | This paper | N/A |
| IRF2 sgRNA #1: GTTCTGATAGGGGCAGCATT | This paper | N/A |
| IRF2 sgRNA #2: TAAACTCCAACACGATCCCG | This paper | N/A |
| IRF4 sgRNA #1: GCAGGACTACAACCGCGAGG | This paper | N/A |
| IRF4 sgRNA #2: CGTTCTCCCACACCAGCCCG | This paper | N/A |
| SYK sgRNA #1: GTGATGTTGCCGAAAAAGAA | This paper | N/A |
| SYK sgRNA #2: GCATCGACAAAGACAAGACA | This paper | N/A |
| CDK6 sgRNA #1: GCCGCTCTCCACCATCCGCG | This paper | N/A |
| CDK6 sgRNA #2: CCAGCAGTACGAATGCGTGG | This paper | N/A |
| CDK4 sgRNA #1: GTCTACATGCTCAAACACCA | This paper | N/A |
| CDK4 sgRNA #2: AAGAGTGTGAGAGTCCCCAA | This paper | N/A |
| TNFRSF1A sgRNA #1: CAGCTGCTCCAAATGCCGAA | This paper | N/A |
| TNFRSF1A sgRNA #2: GGAGATCTCTTCTTGCACAG | This paper | N/A |
| FAS sgRNA: ACTGCGTGCCCTGCCAAGAA | This paper | N/A |
| CD19 sgRNA #1: CTAGGTCCGAAACATTCCAC | This paper | N/A |
| CD19 sgRNA #2: GGACCCATGTGCACCCCAAG | This paper | N/A |
| CD19 sgRNA #3: GCTTCTACCTGTGCCAGCCG | This paper | N/A |
| CD81 sgRNA #1: TGGCTTCCTGGGCTGCTACG | This paper | N/A |
| CD81 sgRNA #2: GCAGCCCTCCACTCCCATGG | This paper | N/A |
| PRDM1 sgRNA #1: TTACAATTCATGCCGTAGGG | This paper | N/A |
| PRDM1 sgRNA #2: TTGGACAGATCTATTCCAGA | This paper | N/A |
| Control sgRNA: GAAAGACTATTTCAAGCAGA | This paper | N/A |
| Recombinant DNA | ||
| pXPR_118_BATF (rescue cDNA) | This paper | N/A |
| pXPR_118_IRF4 (rescue cDNA) | This paper | N/A |
| pXPR_118_CFLAR-S (rescue cDNA) | This paper | N/A |
| pLentiGuide-Puro | Addgene | Cat# 52963 |
| pLenti SpBsmBI sgRNA Hygro | Addgene | Cat# 62205 |
| pLentiCas9-Blast | Addgene | Cat# 52962 |
| pXPR-011 | John Doench | N/A |
| Avana CRISPR Lentivirus Library | Broad Institute | N/A |
| Software and Algorithms | ||
| STARS v1.2 | Doench et al., 2016 | http://portals.broadinstitute.org/gpp/public/software/stars |
| STAR2.5.2b | Dobin et al., 2013 | https://github.com/alexdobin/STAR |
| FeatureCounts v1.5.1 | Liao et al., 2014 | http://subread.sourceforge.net/ |
| DESeq2 v1.14.1 | Love et al., 2014 | https://bioconductor.org/packages/release/bioc/html/DESeq2.html |
| GSEA | Subramanian et al., 2005 | http://software.broadinstitute.org/gsea/index.jsp |
| GraphPad Prism 7 | GraphPad Software | https://www.graphpad.com/scientific-software/prism/ |
| Other | ||
Acknowledgements
B.E.G is a recipient of a Burroughs Wellcome Fund Career Award in Medical Sciences. This work was also supported by institutional funds NCI K08 CA140780, NCI RO1 CA085180 and CA AI123420. J.D. is supported by the Next Generation Fund at the Broad Institute. S.J. is a Howard Hughes Medical Institute predoctoral fellow. The authors do not have any financial conflicts of interest to disclose. We thank Dr. Elliott Kieff for reagents and helpful discussions, Emma Vaimberg and Dr. Glenn Cowley for technical assistance, Dr. Jeff Sample for the KEM and MUTU BL cell lines, Dr. Jaap Middeldorp for the EBNA1 antibody, and Dr. Richard Longnecker for the LMP2A antibody.
References
- Anderton E, Yee J, Smith P, Crook T, White RE, and Allday MJ (2008). Two Epstein-Barr virus (EBV) oncoproteins cooperate to repress expression of the proapoptotic tumour-suppressor Bim: clues to the pathogenesis of Burkitt’s lymphoma. Oncogene 27, 421–433. [DOI] [PubMed] [Google Scholar]
- Arvey A, Tempera I, Tsai K, Chen HS, Tikhmyanova N, Klichinsky M, Leslie C, and Lieberman PM (2012). An atlas of the Epstein-Barr virus transcriptome and epigenome reveals host-virus regulatory interactions. Cell Host Microbe 12, 233–245. [DOI] [PMC free article] [PubMed] [Google Scholar]
- Banerjee S, Lu J, Cai Q, Saha A, Jha HC, Dzeng RK, and Robertson ES (2013). The EBV Latent Antigen 3C Inhibits Apoptosis through Targeted Regulation of Interferon Regulatory Factors 4 and 8. PLoS Pathog 9, e1003314. [DOI] [PMC free article] [PubMed] [Google Scholar]
- Basso K, and Dalla-Favera R (2012). Roles of BCL6 in normal and transformed germinal center B cells. Immunol Rev 247, 172–183. [DOI] [PubMed] [Google Scholar]
- Bernhardt K, Haar J, Tsai MH, Poirey R, Feederle R, and Delecluse HJ (2016). A Viral microRNA Cluster Regulates the Expression of PTEN, p27 and of a bcl-2 Homolog. PLoS Pathog 12, e1005405. [DOI] [PMC free article] [PubMed] [Google Scholar]
- Cahir-McFarland ED, Carter K, Rosenwald A, Giltnane JM, Henrickson SE, Staudt LM, and Kieff E (2004). Role of NF-kappa B in cell survival and transcription of latent membrane protein 1-expressing or Epstein-Barr virus latency III-infected cells. Journal of virology 78, 4108–4119. [DOI] [PMC free article] [PubMed] [Google Scholar]
- Caldwell RG, Wilson JB, Anderson SJ, and Longnecker R (1998). Epstein-Barr virus LMP2A drives B cell development and survival in the absence of normal B cell receptor signals. Immunity 9, 405–411. [DOI] [PubMed] [Google Scholar]
- Caro-Maldonado A, Wang R, Nichols AG, Kuraoka M, Milasta S, Sun LD, Gavin AL, Abel ED, Kelsoe G, Green DR, et al. (2014). Metabolic reprogramming is required for antibody production that is suppressed in anergic but exaggerated in chronically BAFF-exposed B cells. J Immunol 192, 3626–3636. [DOI] [PMC free article] [PubMed] [Google Scholar]
- Cen O, and Longnecker R (2015). Latent Membrane Protein 2 (LMP2). Curr Top Microbiol Immunol 391, 151–180. [DOI] [PubMed] [Google Scholar]
- Chen EY, Tan CM, Kou Y, Duan Q, Wang Z, Meirelles GV, Clark NR, and Ma’ayan A (2013). Enrichr: interactive and collaborative HTML5 gene list enrichment analysis tool. BMC Bioinformatics 14, 128. [DOI] [PMC free article] [PubMed] [Google Scholar]
- Cohen JI, Fauci AS, Varmus H, and Nabel GJ (2011). Epstein-Barr virus: an important vaccine target for cancer prevention. Sci Transl Med 3, 107fs107. [DOI] [PMC free article] [PubMed] [Google Scholar]
- Dillon CP, Oberst A, Weinlich R, Janke LJ, Kang TB, Ben-Moshe T, Mak TW, Wallach D, and Green DR (2012). Survival function of the FADD-CASPASE-8-cFLIP(L) complex. Cell Rep 1, 401–407. [DOI] [PMC free article] [PubMed] [Google Scholar]
- Dirmeier U, Hoffmann R, Kilger E, Schultheiss U, Briseno C, Gires O, Kieser A, Eick D, Sugden B, and Hammerschmidt W (2005). Latent membrane protein 1 of Epstein-Barr virus coordinately regulates proliferation with control of apoptosis. Oncogene 24, 1711–1717. [DOI] [PubMed] [Google Scholar]
- Dobin A, Davis CA, Schlesinger F, Drenkow J, Zaleski C, Jha S, Batut P, Chaisson M, and Gingeras TR (2013). STAR: ultrafast universal RNA-seq aligner. Bioinformatics 29, 15–21. [DOI] [PMC free article] [PubMed] [Google Scholar]
- Doench JG, Fusi N, Sullender M, Hegde M, Vaimberg EW, Donovan KF, Smith I, Tothova Z, Wilen C, Orchard R, et al. (2016). Optimized sgRNA design to maximize activity and minimize off-target effects of CRISPR-Cas9. Nat Biotechnol 34, 184–191. [DOI] [PMC free article] [PubMed] [Google Scholar]
- Doench JG, Hartenian E, Graham DB, Tothova Z, Hegde M, Smith I, Sullender M, Ebert BL, Xavier RJ, and Root DE (2014). Rational design of highly active sgRNAs for CRISPR-Cas9-mediated gene inactivation. Nat Biotechnol 32, 1262–1267. [DOI] [PMC free article] [PubMed] [Google Scholar]
- Ernst J, Kheradpour P, Mikkelsen TS, Shoresh N, Ward LD, Epstein CB, Zhang X, Wang L, Issner R, Coyne M, et al. (2011). Mapping and analysis of chromatin state dynamics in nine human cell types. Nature 473, 43–49. [DOI] [PMC free article] [PubMed] [Google Scholar]
- Farrell CJ, Lee JM, Shin EC, Cebrat M, Cole PA, and Hayward SD (2004). Inhibition of Epstein-Barr virus-induced growth proliferation by a nuclear antigen EBNA2-TAT peptide. Proc Natl Acad Sci U S A 101, 4625–4630. [DOI] [PMC free article] [PubMed] [Google Scholar]
- Feederle R, Haar J, Bernhardt K, Linnstaedt SD, Bannert H, Lips H, Cullen BR, and Delecluse HJ (2011). The members of an Epstein-Barr virus microRNA cluster cooperate to transform B lymphocytes. Journal of virology 85, 9801–9810. [DOI] [PMC free article] [PubMed] [Google Scholar]
- Forte E, and Luftig MA (2009). MDM2-dependent inhibition of p53 is required for Epstein-Barr virus B-cell growth transformation and infected-cell survival. Journal of virology 83, 2491–2499. [DOI] [PMC free article] [PubMed] [Google Scholar]
- Greenfeld H, Takasaki K, Walsh MJ, Ersing I, Bernhardt K, Ma Y, Fu B, Ashbaugh CW, Cabo J, Mollo SB, et al. (2015). TRAF1 Coordinates Polyubiquitin Signaling to Enhance Epstein-Barr Virus LMP1-Mediated Growth and Survival Pathway Activation. PLoS Pathog 11, e1004890. [DOI] [PMC free article] [PubMed] [Google Scholar]
- Henderson S, Rowe M, Gregory C, Croom-Carter D, Wang F, Longnecker R, Kieff E, and Rickinson A (1991). Induction of bcl-2 expression by Epstein-Barr virus latent membrane protein 1 protects infected B cells from programmed cell death. Cell 65, 1107–1115. [DOI] [PubMed] [Google Scholar]
- Hulsen T, de Vlieg J, and Alkema W (2008). BioVenn - a web application for the comparison and visualization of biological lists using area-proportional Venn diagrams. BMC Genomics 9, 488. [DOI] [PMC free article] [PubMed] [Google Scholar]
- Huye LE, Ning S, Kelliher M, and Pagano JS (2007). Interferon regulatory factor 7 is activated by a viral oncoprotein through RIP-dependent ubiquitination. Mol Cell Biol 27, 2910–2918. [DOI] [PMC free article] [PubMed] [Google Scholar]
- Jha HC, Shukla SK, Lu J, Aj MP, Banerjee S, and Robertson ES (2015). Dissecting the contribution of EBNA3C domains important for EBV-induced B-cell growth and proliferation. Oncotarget 6, 30115–30129. [DOI] [PMC free article] [PubMed] [Google Scholar]
- Jiang S, Willox B, Zhou H, Holthaus AM, Wang A, Shi TT, Maruo S, Kharchenko PV, Johannsen EC, Kieff E, et al. (2014). Epstein-Barr virus nuclear antigen 3C binds to BATF/IRF4 or SPI1/IRF4 composite sites and recruits Sin3A to repress CDKN2A. Proc Natl Acad Sci U S A 111, 421–426. [DOI] [PMC free article] [PubMed] [Google Scholar]
- Johansen LM, Deppmann CD, Erickson KD, Coffin WF 3rd, Thornton TM, Humphrey SE, Martin JM, and Taparowsky EJ (2003). EBNA2 and activated Notch induce expression of BATF. Journal of virology 77, 6029–6040. [DOI] [PMC free article] [PubMed] [Google Scholar]
- Keller SA, Hernandez-Hopkins D, Vider J, Ponomarev V, Hyjek E, Schattner EJ, and Cesarman E (2006). NF-kappaB is essential for the progression of KSHV- and EBV-infected lymphomas in vivo. Blood 107, 3295–3302. [DOI] [PMC free article] [PubMed] [Google Scholar]
- Kieff E, and Rickinson A (2007). Epstein-Barr Virus and Its Replication. In Virology Fields, Knipe DM, and Howley PM, eds. (Lippincott Williams & Wilkins; ), pp. 2603–2654. [Google Scholar]
- Kuo TC, and Calame KL (2004). B lymphocyte-induced maturation protein (Blimp)-1, IFN regulatory factor (IRF)-1, and IRF-2 can bind to the same regulatory sites. J Immunol 173, 5556–5563. [DOI] [PubMed] [Google Scholar]
- LaCasce AS (2006). Post-transplant lymphoproliferative disorders. Oncologist 11, 674–680. [DOI] [PubMed] [Google Scholar]
- Le A, Lane AN, Hamaker M, Bose S, Gouw A, Barbi J, Tsukamoto T, Rojas CJ, Slusher BS, Zhang H, et al. (2012). Glucose-independent glutamine metabolism via TCA cycling for proliferation and survival in B cells. Cell Metab 15, 110–121. [DOI] [PMC free article] [PubMed] [Google Scholar]
- Liao Y, Smyth GK, and Shi W (2014). featureCounts: an efficient general purpose program for assigning sequence reads to genomic features. Bioinformatics 30, 923–930. [DOI] [PubMed] [Google Scholar]
- Lieberman PM (2014). Virology. Epstein-Barr virus turns 50. Science 343, 1323–1325. [DOI] [PMC free article] [PubMed] [Google Scholar]
- Lin KI, Lin Y, and Calame K (2000). Repression of c-myc is necessary but not sufficient for terminal differentiation of B lymphocytes in vitro. Mol Cell Biol 20, 8684–8695. [DOI] [PMC free article] [PubMed] [Google Scholar]
- Lin Y, Wong K, and Calame K (1997). Repression of c-myc transcription by Blimp-1, an inducer of terminal B cell differentiation. Science 276, 596–599. [DOI] [PubMed] [Google Scholar]
- Love MI, Huber W, and Anders S (2014). Moderated estimation of fold change and dispersion for RNA-seq data with DESeq2. Genome Biol 15, 550. [DOI] [PMC free article] [PubMed] [Google Scholar]
- Mancao C, and Hammerschmidt W (2007). Epstein-Barr virus latent membrane protein 2A is a B-cell receptor mimic and essential for B-cell survival. Blood 110, 3715–3721. [DOI] [PMC free article] [PubMed] [Google Scholar]
- Mandelbaum J, Bhagat G, Tang H, Mo T, Brahmachary M, Shen Q, Chadburn A, Rajewsky K, Tarakhovsky A, Pasqualucci L, et al. (2010). BLIMP1 is a tumor suppressor gene frequently disrupted in activated B cell-like diffuse large B cell lymphoma. Cancer Cell 18, 568–579. [DOI] [PMC free article] [PubMed] [Google Scholar]
- Meckes DG Jr., Menaker NF, and Raab-Traub N (2013). Epstein-Barr virus LMP1 modulates lipid raft microdomains and the vimentin cytoskeleton for signal transduction and transformation. Journal of virology 87, 1301–1311. [DOI] [PMC free article] [PubMed] [Google Scholar]
- Micheau O, Thome M, Schneider P, Holler N, Tschopp J, Nicholson DW, Briand C, and Grutter MG (2002). The long form of FLIP is an activator of caspase-8 at the Fas death-inducing signaling complex. J Biol Chem 277, 45162–45171. [DOI] [PubMed] [Google Scholar]
- Milhollen MA, Traore T, Adams-Duffy J, Thomas MP, Berger AJ, Dang L, Dick LR, Garnsey JJ, Koenig E, Langston SP, et al. (2010). MLN4924, a NEDD8-activating enzyme inhibitor, is active in diffuse large B-cell lymphoma models: rationale for treatment of NF-{kappa}B-dependent lymphoma. Blood 116, 1515–1523. [DOI] [PubMed] [Google Scholar]
- Minamitani T, Yasui T, Ma Y, Zhou H, Okuzaki D, Tsai CY, Sakakibara S, Gewurz BE, Kieff E, and Kikutani H (2015). Evasion of affinity-based selection in germinal centers by Epstein-Barr virus LMP2A. Proc Natl Acad Sci U S A. [DOI] [PMC free article] [PubMed] [Google Scholar]
- Ning S, Campos AD, Darnay BG, Bentz GL, and Pagano JS (2008). TRAF6 and the three C-terminal lysine sites on IRF7 are required for its ubiquitination-mediated activation by the tumor necrosis factor receptor family member latent membrane protein 1. Mol Cell Biol 28, 6536–6546. [DOI] [PMC free article] [PubMed] [Google Scholar]
- Nonkwelo C, Skinner J, Bell A, Rickinson A, and Sample J (1996). Transcription start sites downstream of the Epstein-Barr virus (EBV) Fp promoter in early-passage Burkitt lymphoma cells define a fourth promoter for expression of the EBV EBNA-1 protein. Journal of virology 70, 623–627. [DOI] [PMC free article] [PubMed] [Google Scholar]
- Nutt SL, Hodgkin PD, Tarlinton DM, and Corcoran LM (2015). The generation of antibody-secreting plasma cells. Nat Rev Immunol 15, 160–171. [DOI] [PubMed] [Google Scholar]
- Paschos K, Parker GA, Watanatanasup E, White RE, and Allday MJ (2012). BIM promoter directly targeted by EBNA3C in polycomb-mediated repression by EBV. Nucleic Acids Res 40, 7233–7246. [DOI] [PMC free article] [PubMed] [Google Scholar]
- Pasqualucci L, Dominguez-Sola D, Chiarenza A, Fabbri G, Grunn A, Trifonov V, Kasper LH, Lerach S, Tang H, Ma J, et al. (2011). Inactivating mutations of acetyltransferase genes in B-cell lymphoma. Nature 471, 189–195. [DOI] [PMC free article] [PubMed] [Google Scholar]
- Powles J (2009). Commentary: Why diets need to change to avert harm from global warming. Int J Epidemiol 38, 1141–1142. [DOI] [PubMed] [Google Scholar]
- Price AM, Tourigny JP, Forte E, Salinas RE, Dave SS, and Luftig MA (2012). Analysis of Epstein-Barr virus-regulated host gene expression changes through primary B-cell outgrowth reveals delayed kinetics of latent membrane protein 1-mediated NF-kappaB activation. Journal of virology 86, 11096–11106. [DOI] [PMC free article] [PubMed] [Google Scholar]
- Reusch JA, Nawandar DM, Wright KL, Kenney SC, and Mertz JE (2015). Cellular differentiation regulator BLIMP1 induces Epstein-Barr virus lytic reactivation in epithelial and B cells by activating transcription from both the R and Z promoters. Journal of virology 89, 1731–1743. [DOI] [PMC free article] [PubMed] [Google Scholar]
- Rickinson AB (2014). Co-infections, inflammation and oncogenesis: future directions for EBV research. Semin Cancer Biol 26, 99–115. [DOI] [PubMed] [Google Scholar]
- Robertson ES, Lin J, and Kieff E (1996). The amino-terminal domains of Epstein-Barr virus nuclear proteins 3A, 3B, and 3C interact with RBPJ(kappa). Journal of virology 70, 3068–3074. [DOI] [PMC free article] [PubMed] [Google Scholar]
- Rowe M, Rowe DT, Gregory CD, Young LS, Farrell PJ, Rupani H, and Rickinson AB (1987). Differences in B cell growth phenotype reflect novel patterns of Epstein-Barr virus latent gene expression in Burkitt’s lymphoma cells. EMBO J 6, 2743–2751. [DOI] [PMC free article] [PubMed] [Google Scholar]
- Saha A, Murakami M, Kumar P, Bajaj B, Sims K, and Robertson ES (2009). Epstein-Barr virus nuclear antigen 3C augments Mdm2-mediated p53 ubiquitination and degradation by deubiquitinating Mdm2. Journal of virology 83, 4652–4669. [DOI] [PMC free article] [PubMed] [Google Scholar]
- Schmidt SC, Jiang S, Zhou H, Willox B, Holthaus AM, Kharchenko PV, Johannsen EC, Kieff E, and Zhao B (2015). Epstein-Barr virus nuclear antigen 3A partially coincides with EBNA3C genome-wide and is tethered to DNA through BATF complexes. Proc Natl Acad Sci U S A 112, 554–559. [DOI] [PMC free article] [PubMed] [Google Scholar]
- Schmitz R, Ceribelli M, Pittaluga S, Wright G, and Staudt LM (2014). Oncogenic mechanisms in Burkitt lymphoma. Cold Spring Harb Perspect Med 4. [DOI] [PMC free article] [PubMed] [Google Scholar]
- Schmitz R, Young RM, Ceribelli M, Jhavar S, Xiao W, Zhang M, Wright G, Shaffer AL, Hodson DJ, Buras E, et al. (2012). Burkitt lymphoma pathogenesis and therapeutic targets from structural and functional genomics. Nature 490, 116–120. [DOI] [PMC free article] [PubMed] [Google Scholar]
- Seto E, Moosmann A, Gromminger S, Walz N, Grundhoff A, and Hammerschmidt W (2010). Micro RNAs of Epstein-Barr virus promote cell cycle progression and prevent apoptosis of primary human B cells. PLoS Pathog 6, e1001063. [DOI] [PMC free article] [PubMed] [Google Scholar]
- Shoham T, Rajapaksa R, Boucheix C, Rubinstein E, Poe JC, Tedder TF, and Levy S (2003). The tetraspanin CD81 regulates the expression of CD19 during B cell development in a postendoplasmic reticulum compartment. J Immunol 171, 4062–4072. [DOI] [PubMed] [Google Scholar]
- Skalsky RL, Corcoran DL, Gottwein E, Frank CL, Kang D, Hafner M, Nusbaum JD, Feederle R, Delecluse HJ, Luftig MA, et al. (2012). The viral and cellular microRNA targetome in lymphoblastoid cell lines. PLoS Pathog 8, e1002484. [DOI] [PMC free article] [PubMed] [Google Scholar]
- Snow AL, Lambert SL, Natkunam Y, Esquivel CO, Krams SM, and Martinez OM (2006). EBV can protect latently infected B cell lymphomas from death receptor-induced apoptosis. J Immunol 177, 3283–3293. [DOI] [PubMed] [Google Scholar]
- Song YJ, Izumi KM, Shinners NP, Gewurz BE, and Kieff E (2008). IRF7 activation by Epstein-Barr virus latent membrane protein 1 requires localization at activation sites and TRAF6, but not TRAF2 or TRAF3. Proc Natl Acad Sci U S A 105, 18448–18453. [DOI] [PMC free article] [PubMed] [Google Scholar]
- Spender LC, Cornish GH, Rowland B, Kempkes B, and Farrell PJ (2001). Direct and indirect regulation of cytokine and cell cycle proteins by EBNA-2 during Epstein-Barr virus infection. Journal of virology 75, 3537–3546. [DOI] [PMC free article] [PubMed] [Google Scholar]
- Subramanian A, Tamayo P, Mootha VK, Mukherjee S, Ebert BL, Gillette MA, Paulovich A, Pomeroy SL, Golub TR, Lander ES, et al. (2005). Gene set enrichment analysis: a knowledge-based approach for interpreting genome-wide expression profiles. Proc Natl Acad Sci U S A 102, 15545–15550. [DOI] [PMC free article] [PubMed] [Google Scholar]
- Sugden B (2014). Epstein-Barr virus: the path from association to causality for a ubiquitous human pathogen. PLoS Biol 12, e1001939. [DOI] [PMC free article] [PubMed] [Google Scholar]
- Tam W, Gomez M, Chadburn A, Lee JW, Chan WC, and Knowles DM (2006). Mutational analysis of PRDM1 indicates a tumor-suppressor role in diffuse large B-cell lymphomas. Blood 107, 4090–4100. [DOI] [PubMed] [Google Scholar]
- Tepper CG, and Seldin MF (1999). Modulation of caspase-8 and FLICE-inhibitory protein expression as a potential mechanism of Epstein-Barr virus tumorigenesis in Burkitt’s lymphoma. Blood 94, 1727–1737. [PubMed] [Google Scholar]
- Thorley-Lawson DA, and Allday MJ (2008). The curious case of the tumour virus: 50 years of Burkitt’s lymphoma. Nat Rev Microbiol 6, 913–924. [DOI] [PubMed] [Google Scholar]
- Tuveson DA, Carter RH, Soltoff SP, and Fearon DT (1993). CD19 of B cells as a surrogate kinase insert region to bind phosphatidylinositol 3-kinase. Science 260, 986–989. [DOI] [PubMed] [Google Scholar]
- Vrzalikova K, Vockerodt M, Leonard S, Bell A, Wei W, Schrader A, Wright KL, Kube D, Rowe M, Woodman CB, et al. (2011). Down-regulation of BLIMP1alpha by the EBV oncogene, LMP-1, disrupts the plasma cell differentiation program and prevents viral replication in B cells: implications for the pathogenesis of EBV-associated B-cell lymphomas. Blood 117, 5907–5917. [DOI] [PMC free article] [PubMed] [Google Scholar]
- Weniger MA, and Kuppers R (2016). NF-kappaB deregulation in Hodgkin lymphoma. Semin Cancer Biol 39, 32–39. [DOI] [PubMed] [Google Scholar]
- Whyte WA, Orlando DA, Hnisz D, Abraham BJ, Lin CY, Kagey MH, Rahl PB, Lee TI, and Young RA (2013). Master transcription factors and mediator establish super-enhancers at key cell identity genes. Cell 153, 307–319. [DOI] [PMC free article] [PubMed] [Google Scholar]
- Wood CD, Veenstra H, Khasnis S, Gunnell A, Webb HM, Shannon-Lowe C, Andrews S, Osborne CS, and West MJ (2016). MYC activation and BCL2L11 silencing by a tumour virus through the large-scale reconfiguration of enhancer-promoter hubs. Elife 5. [DOI] [PMC free article] [PubMed] [Google Scholar]
- Zhao B, Barrera LA, Ersing I, Willox B, Schmidt SC, Greenfeld H, Zhou H, Mollo SB, Shi TT, Takasaki K, et al. (2014). The NF-kappaB genomic landscape in lymphoblastoid B cells. Cell Rep 8, 1595–1606. [DOI] [PMC free article] [PubMed] [Google Scholar]
- Zhao B, Marshall DR, and Sample CE (1996). A conserved domain of the Epstein-Barr virus nuclear antigens 3A and 3C binds to a discrete domain of Jkappa. Journal of virology 70, 4228–4236. [DOI] [PMC free article] [PubMed] [Google Scholar]
- Zhou H, Schmidt SC, Jiang S, Willox B, Bernhardt K, Liang J, Johannsen EC, Kharchenko P, Gewurz BE, Kieff E, et al. (2015). Epstein-Barr virus oncoprotein super-enhancers control B cell growth. Cell Host Microbe 17, 205–216. [DOI] [PMC free article] [PubMed] [Google Scholar]
Associated Data
This section collects any data citations, data availability statements, or supplementary materials included in this article.
Supplementary Materials
Data Availability Statement
All RNA-seq datasets have been deposited to NIH GEO Omnibus, accession #GSE93681.