Abstract
Objective:
To evaluate whether mandibular setback surgery (MSS) for Class III patients would produce gradients of three-dimensional (3D) soft tissue changes in the vertical and transverse aspects.
Materials and Methods:
The samples consisted of 26 Class III patients treated with MSS using bilateral sagittal split ramus osteotomy. Lateral cephalograms and 3D facial scan images were taken before and 6 months after MSS, and changes in landmarks and variables were measured using a Rapidform 2006. Paired and independent t-tests were performed for statistical analysis.
Results:
Landmarks in the upper lip and mouth corner (cheilion, Ch) moved backward and downward (respectively, cupid bow point, 1.0 mm and 0.3 mm, P < .001 and P < .01; alar curvature-Ch midpoint, 0.6 mm and 0.3 mm, both P < .001; Ch, 3.4 mm and 0.8 mm, both P < .001). However, landmarks in stomion (Stm), lower lip, and chin moved backward (Stm, 1.6 mm; labrale inferius [Li], 6.9 mm; LLBP, 6.9 mm; B′, 6.7 mm; Pog′, 6.7 mm; Me′, 6.6 mm; P < .001, respectively). Width and height of upper and lower lip were not altered significantly except for a decrease of lower vermilion height (Stm-Li, 1.7 mm, P < .001). Chin height (B′-Me′) was decreased because of backward and upward movement of Me′ (3.1 mm, P < .001). Although upper lip projection angle and Stm-transverse projection angle became acute (ChRt-Ls-ChLt, 5.7°; ChRt-Stm-ChLt, 6.4°, both P < .001) because of the greater backward movement of Ch than Stm, lower lip projection angle and Stm-vertical projection angle became obtuse (ChRt-Li-ChLt, 10.8°; Ls-Stm-Li, 23.5°, both P < .001) because of the larger backward movement of Li than labrale superius (Ls).
Conclusions:
Three-dimensional soft tissue changes in Class III patients after MSS exhibited increased gradients from upper lip and lower lip to chin as well as from Stm to Ch.
Keywords: Three-dimensional evaluation, Facial scanning images, Class III malocclusion, Soft tissue change gradients, Mandibular setback surgery
INTRODUCTION
One important goal of orthodontic treatment and orthognathic surgery is the improvement of facial esthetics.1,2 Conventional lateral cephalometric analysis can estimate soft tissue changes at the midsagittal area. However, patients usually evaluate their own soft tissue esthetics on the basis of how they look in a frontal view. Therefore, three-dimensional (3D) imaging methods, such as 3D computed tomography3–6 and 3D facial scan images (3D-FSIs),7–12 are used to analyze and evaluate the soft tissues of the entire face.
To predict soft tissue changes of the face more precisely after two-jaw surgery, alterations in the lower third of the face that are affected by mandibular surgery should be estimated first. Moreover, in skeletal Class III malocclusion patients, soft tissue changes after mandibular setback surgery (MSS) have been reported not only in the lower lip and chin areas but also in the upper lip and paranasal areas.6,12 However, changes in the lip and mouth corner are more difficult to predict than change in the chin. Also, few studies have investigated the 3D gradient changes in the lips and chin after MSS. In addition, although Soncul and Bamber9 reported backward and downward movement of the lower lip and backward movement of B′ and Pog′ after MSS in a 3D-FSI study, they did not include the angulation change in the lips.
Therefore, the purpose of this study was to evaluate the 3D linear and angular changes of the lips and chin after MSS in skeletal Class III patients using 3D-FSI. The null hypothesis was that 3D soft tissue changes in Class III patients after MSS would not exhibit increased gradients from the upper lip and the lower lip to the chin and from the midline (Stm) to the lateral area (cheilion).
MATERIALS AND METHODS
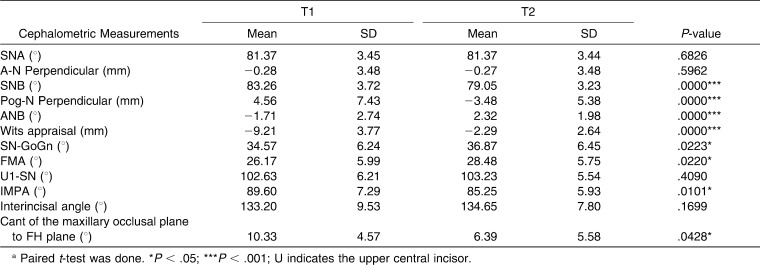
The samples consisted of 26 Class III patients (eight males and 18 females, mean age = 25.0 ± 6.0 years, range = 18.5 to 33.2 years) without severe facial asymmetry (less than 3 mm of chin deviation from the facial midline at Pog′). They had undergone MSS with bilateral sagittal split ramus osteotomy (mean amount of setback at point B = 8.0 ± 4.1 mm) by a single surgeon (Table 1). Approval for this study was granted by the Institutional Review Board of the Seoul University Medical Center (IRB No. GR0791).
Table 1.
Comparison of the Cephalometric Measurements Before (T1) and Six Months After Mandibular Setback Surgery (T2)a
Lateral cephalograms were taken immediately both before (T1) and 6 months after MSS (T2) with centric occlusion, reposed lip, and natural head position.13 Cephalometric tracing and measurements were performed by a single operator using the V-Ceph program (Osstem, Seoul, Korea).
The 3D-FSIs were taken at T1 and T2 from three different horizontal angles (the front side and the right and left sides at an angle of 45°) and from two different vertical angles (the upper and lower sides at an angle of 30° in the midline) to scan the entire face without shadows. Patients sat wearing a hair band, with centric occlusion, reposed lips, and natural head position.13 OptoTOP-SE (Breuckmann, Meersburg, Germany; white-light scanner; 30–40 µm accuracy according to the manufacturer, scanning time <3 seconds) was used by a single operator. The 3D-FSIs were reconstructed using Rapidform 2006 and Rapidform XO scanning software (Inus Technology Inc, Seoul, Korea).
A period lasting 6 months after MSS was chosen as the T2 stage because adequate stabilization of the facial soft tissue is expected to occur during this period, and any subsequent changes should be small enough to be neglibile.14
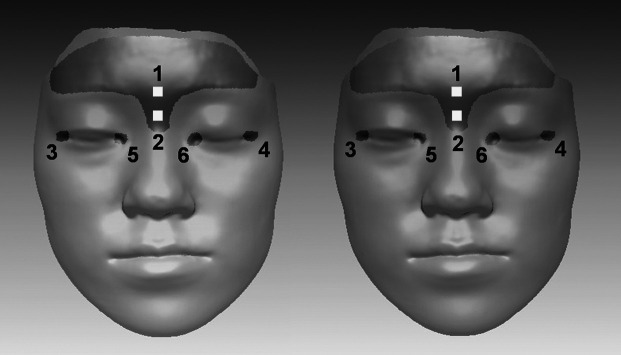
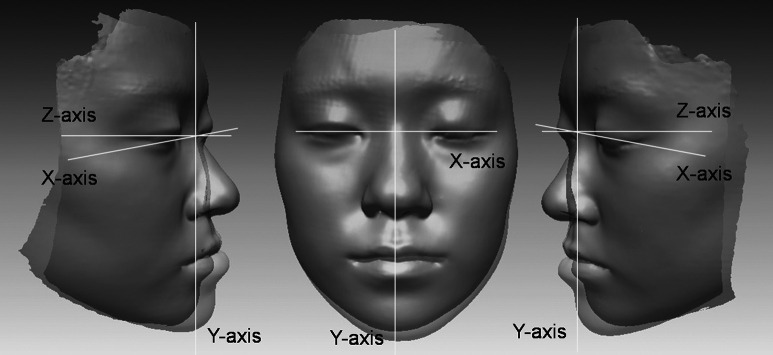
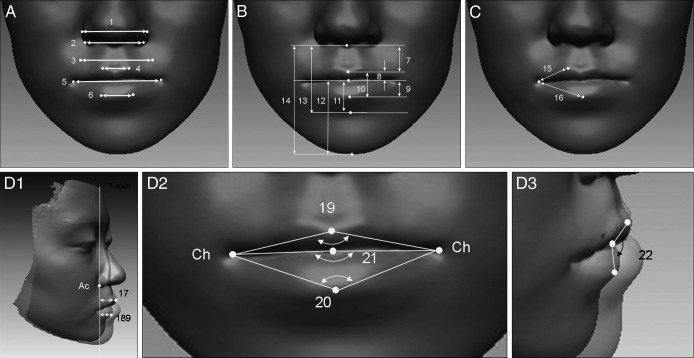
Landmarks for the superimposition of T1 and T2 images and the reference axes6,9,11,15,16 are defined in Figures 1 and 2, respectively. The extent and direction of changes in the landmarks and variables during T1–T2 stages (Figures 3 and 4) were measured by a single operator using Rapidform 2006 software (Inus Co, Seoul, Korea).
Figure 1.
References used to superimpose T1 (yellow) and T2 (green): Forehead area (1, glabella, the most prominent midline point between the eyebrows), nasion area (2, soft tissue nasion, the corresponding soft tissue point of the frontonasal suture), exocanthion (3/4, The point at the outer commissure of the eye fissure), and endocanthion (5/6, the point at the inner commissure of the eye fissure).
Figure 2.
Reference axes established on the original point (nasion): A midsagittal line (Y coordinate: vertical axis), a parallel line to the floor (Z coordinate: anteroposterior axis), and a parallel line to a line connecting both exocanthions (X coordinate: transverse axis).
Figure 3.
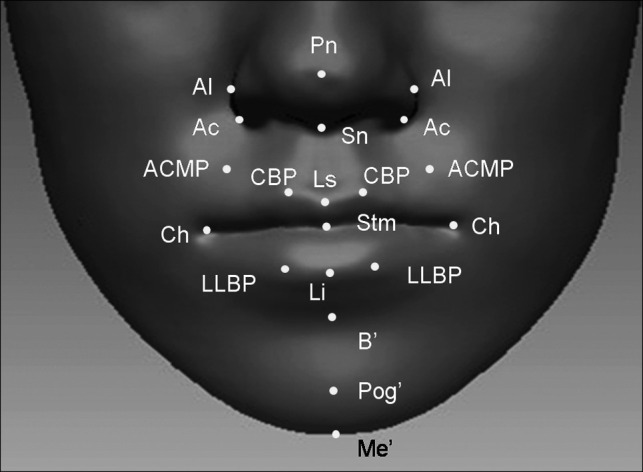
Soft tissue landmarks. Nose-related: pronasale (Pn, the most protruded point of the soft tissue nose); subnasale (Sn, the midpoint of the angle at the columella base where the lower border of the nasal septum and the surface of the upper lip meet); nasal ala (Al, the most lateral point on each alar contour); alar curvature point (Ac, the most lateral point in the curved base line of each ala, indicating the facial insertion of the nasal wingbase). Upper lip-related: labrale superius (Ls, the midpoint of the upper vermilion line); cupid bow point (CBP, the most elevated point of the philtrum on the upper vermilion border line); alar curvature-cheillion midpoint (ACMP, the midpoint between ala curvature and cheilion). Lower lip-related: Labrale inferius (Li, the midpoint of the lower vermilion line); lower lip bow point (LLBP, the breakpoint on the lower vermilion border line). Stomion-related: stomion (Stm, the point at the midline of labial fissure between gently closed lips); cheilion (Ch, the point located at each labial commissure). Chin-related: soft tissue B point (B′, the deepest point on the facial midline, between the lower lip and chin); soft tissue pogonion (Pog′, the most anterior midpoint of the chin); soft tissue menton (Me′, the lowest median landmark on the lower border of the mandible).
Figure 4.
Variables. (A) Width of the nose and lips: 1. AlRt-AlLt (mm), 2. AcRt-AcLt (mm), 3. ACMPRt-ACMPLt (mm), 4. CBPRt-CBPLt (mm), 5. ChRt-ChLt (mm), 6. LLBPRt-LLBPLt (mm). (B) Height of the lips and chin: 7. Sn-Ls (mm), 8. Ls-Stm (mm), 9. Stm-Li (mm), 10. Ls-Li (mm), 11. Stm-B′ (mm), 12. Stm-Me′ (mm), 13. Sn-B′ (mm), 14. Sn-Me′ (mm). (C) Vermilion border length: 15. Ch-CBP (mm), 16. Ch-Li (mm). (D) Lip projection: 17. Ls-Ac perp (mm), 18. Li-Ac perp (mm), 19. ChRt–Ls-ChLt (°); 20. ChRt–Li-ChLt (°), 21. ChRt–Stm-ChLt (°), 22. Ls–Stm–Li (°).
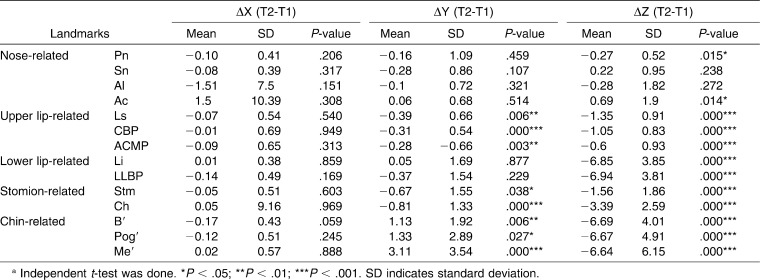
Four weeks after the first digitization of the landmarks, 30 3D-FSIs were selected randomly and the landmarks were redigitized by a single operator. Because paired t-tests showed that there were no significant differences in the values between the first and second sets of the x, y, and z coordinates (Table 2), the first set of measurements was used in this study. Because there was no statistical significant difference in the soft tissue changes between males and females, the samples were mixed for statistical analyses. Paired t-tests and independent t-tests were performed for statistical analysis.
Table 2.
Results of Reliability Test for Landmark Digitizationa
RESULTS
Changes of the X, Y, and Z Coordinates of Landmarks After MSS (Table 3)
Table 3.
Change of the X, Y, and Z Coordinates of Landmark (mm) After Mandibular Setback Surgerya
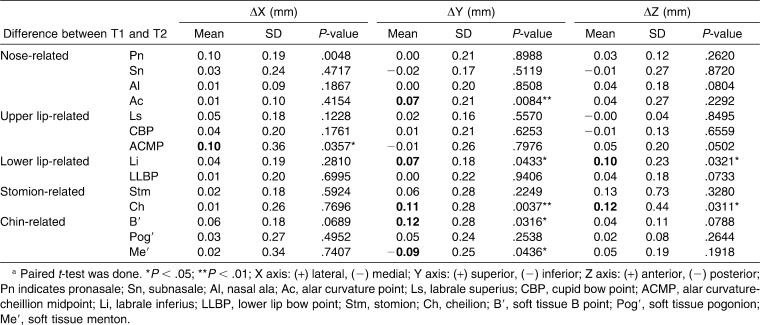
Landmarks of the nose, mouth, and lips did not show any significant changes in position in the X-axis (transverse direction). However, in the Y- axis (vertical direction) and Z-axis (anteroposterior direction), there were significant changes in the positions of the landmarks with different patterns. For example, alar curvature point (Ac) in the nose moved forward (0.7 mm, P < .05) and labrale superius (Ls) in the upper lip moved backward (1.4 mm, P < .001). Most of the landmarks of the upper lip and mouth corner moved backward and downward (alar curvature-cheilion midpoint [ACMP], 0.6 mm and 0.3 mm, both P < .001; cupid bow point [CBP], 1.0 mm and 0.3 mm, P < .001 and P < .01; cheilion [Ch], 3.4 mm and 0.8 mm, both P < .001). However, landmarks of the lower lips and Stm moved backward only (labrale inferius [Li], 6.9 mm; Stm, 1.6 mm; respectively, P < .001). In the chin, B′, Pog′, and Me′ moved backward (6.6 mm, 6.7 mm, 6.6 mm, respectively, P < .001) and upward (Me′, 3.1 mm, P < .001).
Changes in the Width of the Nose and Lips After MSS
Although the nasal width decreased, there was no significant difference observed. In addition, the widths of the mouth and lips did not exhibit any significant change (Table 4).
Table 4.
Changes in Width of the Nose and Lips After Mandibular Setback Surgerya
Changes in the Height of the Lips and Chin After MSS
Although lower vermilion height was decreased (Stm-Li, 1.7 mm, P < .001), upper lip height, upper vermilion height, and total vermilion height (Sn-Ls, Ls-Stms, and Ls-Li) did not change significantly (Table 5).
Table 5.
Changes in Height of the Lips and Shin after Mandibular Setback Surgerya
For the height of the chin and lower anterior face, there were significant decreases in Stm-Me′ (3.8 mm, P < .001) and Sn-Me′ (3.4 mm, P < .001). Therefore, the lower part of the chin decreased (symphysis height, B′-Me′) and not the lower lip height (Sn-B′ and Stm-B′, P > .05).
Changes in the Vermilion Border Length After MSS (Table 6)
Table 6.
Changes in the Vermilion Border Length After Mandibular Setback Surgerya
Changes in the vermilion border length after MSS are shown in Table 6. Upper vermilion border length increased (Ch-CBP, 1.1 mm, P < .05) because of the backward and downward movement of Ch (3.4 mm, 0.8 mm, respectively, P < .001, Table 3). However, lower vermilion border length decreased (Ch-Li, 1.7 mm, P < .001) because of the greater backward movement of Li than Ch (6.9 mm vs 3.4 mm, Table 3).
Changes in the Lip Projection After MSS
Changes in lip projection after MSS are shown in Table 7. Upper lip projection length and angle both decreased (Ls-Ac, 2.0 mm, ChRt-Ls-ChLt, 5.7°, both P < .001) because of the greater backward movement of Ch than Ls (3.4 mm vs 1.4 mm, Table 3). Although lower lip projection length decreased (Li-Ac, 7.6 mm), lower lip projection angle became obtuse (ChRt-Li-ChLt, 10.8°, both P < .001) because of the greater backward movement of Li than Ch (6.9 mm vs 3.4 mm, Table 3).
Table 7.
Changes in the Lip Projection After Mandibular Setback Surgerya
Although upper lip projection angle and Stm-transverse projection angle became acute (ChRt-Ls-ChLt, 5.7°; ChRt-Stm-ChLt, 6.4°, both P < .001) because of the increased backward movement of Ch relative to Stm, lower lip projection angle and Stm-vertical projection angle (ChRt-Li-ChLt, 10.8°; Ls-Stm-Li, 23.5°, both P < .001) both became obtuse because of the increased backward movement of Li and Stm relative to Ls (6.9 mm and 1.6 mm vs 1.4 mm, Table 3).
DISCUSSION
Changes of the X, Y, and Z Coordinate of Landmarks After MSS
The finding that MSS did not produce significant changes in landmark positions in the transverse direction (Table 3) seems to be due to the selection criteria for the samples, which included less than 3 mm of chin deviation from the facial midline at Pog′.
Although the mean amount of setback at point B in the samples was 8.0 mm, the upper lip (Ls) and Stm moved backward by 17.5%–20% (1.4 mm and 1.6 mm), the mouth corner (Ch) by 42.5% (3.4 mm), the lower lip (Li) by 86.2% (6.9 mm), and the soft tissue chin (B′ and Pog′) by 82.5%–83.4% (6.6 mm and 6.7 mm) with an increasing gradient pattern (Table 3). Therefore, soft tissue changes after MSS were more greatly expressed in the lower lip and chin than in the upper lip and mouth corner. These results were in accordance with the results of two-dimensional cephalometric studies17–19 and 3D computed tomography studies.6,20,21 In addition, the lips and mouth corners moved backward after MSS with an increasing gradient from the midline to the lateral area (Table 3). McCance et al.3 reported similar results with greater changes in the lateral areas than in the midline of the chin and mentalis regions after MSS. These findings suggest that the upper lip (Ls), Stm, and mouth corner are under the influence of muscle and soft tissue as well as positional change of the mandible in patients with MSS.
The movement patterns of landmarks differed for the upper lip/mouth corner and the lower lip/Stm. Because of the backward movement of the lower lip and Stm (Li, 6.9 mm; Stm, 1.6 mm; P < .001; Table 3), the upper lip and mouth corner moved backward and downward (ACMP, 0.6 mm and 0.3 mm, both P < .001; CBP, 1.0 mm and 0.3 mm, P < .001 and P < .01; Ch, 3.4 mm and 0.8 mm, both P < .001, Table 3). These results suggest that because the maxillary hard tissues were not changed in 3D coordinates by MSS, soft tissue change in the upper lip most likely occurred because of the postoperative orthodontic treatment, continuity of the orbicularis oris muscle and soft tissue tension.6
Changes in the Width of the Nose and Lips After MSS
Although nasal width slightly decreased (AlRt-AlLt and AcRt-AcLt, P > .05, Table 4), Ac in the nose moved forward (0.7 mm, P < .05, Table 3) in spite of no actual maxillary advancement, which is similar to results reported by Jung et al.6 These findings suggest that MSS can alter the nose indirectly through the continuity of the orbicularis oris muscle and soft tissue tension.
The fact that the widths of the lips and mouth corners did not significantly change after MSS implies that muscle tonicity might not be changed within a short period of time.6
Changes in the Heights of the Lips and Chin
Heights of the upper lip, upper vermilion, and total vermilion did not change significantly (Sn-Ls, Ls-Stms, and Ls-Li, respectively; P > .05; Table 5). These results are in accordance with Jung et al.,6 who reported that the lip heights were not significantly changed after MSS. The position of the lower lip in Class III patients before surgery was affected by the position of the lower incisors. However, after MSS, the position of the lower lip would be influenced by the position of the upper incisors. In addition, lower lip tension could be reduced after MSS and eventually resulted in decrease of the lower lip height and lower vermilion height (Stm-Li, 1.7 mm, P < .001, Table 5), which is consistent with Gjørup and Athanasiou.18
Significant decreases in Stm-Me′ (3.8 mm, P < .001, Table 5) and Sn-Me′ (3.4 mm, P < .001, Table 5), not lower lip height (Sn-B′ and Stm-B′, P > .05, Table 5), seems to be attributable to MSS along with the maxillary occlusal plane, resulting in backward and upward movement of the chin.20,22 Therefore, MSS and/or vertical reduction genioplasty can potentially reduce the chin height rather than the lower lip height.
However, the vertical change of the soft tissue after surgery is still difficult to predict. Robinson et al.17 and Jung et al.6 reported that changes in the soft tissue did not closely follow those in the hard tissue in the vertical plane compared with the anteroposterior and transverse planes.
Changes in the Vermilion Border Length After MSS
Opposing changes of upper and lower vermilion border length (Ch-CBP, 1.1 mm increase, P < .05; Ch-Li, 1.7 mm decrease, P < .001, Table 6) seem to be attributable to different amounts of backward movement between CBP, Ch, and Li (1.1 mm, 3.4 mm, and 6.9 mm, respectively; Table 3). In addition, after MSS, there is a possibility of decrease in lower lip tension, which would allow for replacement of the upper lip over the lower lip and eventual opposing change in the vermilion border length.
Changes in the Lip Projection After MSS
Similar to changes in vermilion length, opposing changes of upper lip projection angle, Stm-transverse projection angle and lower lip projection angle (ChRt-Ls-ChLt, 5.7° decrease; ChRt-Stm-ChLt, 6.4° decrease vs ChRt-Li-ChLt, 10.8° increase, respectively; P < .001; Table 7) appeared to result from different amounts and movement patterns between Ls, Stm, Ch, and Li (1.3 mm backward movement, 1.6 mm backward movement, 3.4 mm backward and 0.8 mm downward movements, and 6.9 mm backward movement, respectively; Table 3). These results are in accordance with Jung et al.6 Before MSS, soft tissue stretching of the chin in the prognathic mandible can pull the upper and lower lips downward. When normal lip posture is achieved after MSS, normal convexity of the upper and lower lips can be restored. In other words, after MSS, the upper lip becomes acute and the lower lip becomes obtuse in the horizontal plane, which normalizes the lip posture and establishes a better environment for appropriate lip sealing. Compared with the amounts of backward movement of Ls, Stm, and Li and Ch (1.3 mm, 1.6 mm, and 6.9 mm, vs 3.4 mm, Table 3), 3D soft tissue changes in Class III patients after MSS occurred more in the mouth corner (Ch) than in the midline of lips (Ls, Stm, and Li) with an increasing gradient.
Because there was more backward movement of Li than Ls (6.9 mm vs 1.4 mm, Table 3), Stm-vertical projection angle (Ls-Stm-Li, 23.5°, P < .001, Table 7) became obtuse. The positions of upper and lower lips were affected by the position of lower incisors in Class III patients before MSS. However, after MSS, the upper and lower lips were under influence of the upper incisors. Therefore, there was a significant increase in Stm-vertical PA.
CONCLUSION
The null hypothesis was rejected.
The 3D soft tissue changes in Class III patients after MSS did exhibit increased gradients from the upper lip and the lower lip to the chin and from the midline (Stm) to the lateral area (Ch).
REFERENCES
- 1.Burstone C. J, James R. B, Legan H, Murphy G. A, Norton L. A. Cephalometrics for orthognathic surgery. J Oral Surg. 1978;36:269–277. [PubMed] [Google Scholar]
- 2.Arnett G. W, Jelic J. S, Kim J, Cummings D. R, Beress A, Worley C. M, Jr, Chung B, Bergman R. Soft tissue cephalometric analysis: diagnosis and treatment planning of dentofacial deformity. Am J Orthod Dentofacial Orthop. 1999;116:239–253. doi: 10.1016/s0889-5406(99)70234-9. [DOI] [PubMed] [Google Scholar]
- 3.McCance A. M, Moss J. P, Fright W. R, James D. R, Linney A. D. A three dimensional analysis of soft and hard tissue changes following bimaxillary orthognathic surgery in skeletal III patients. Br J Oral Maxillofac Surg. 1992;30:305–312. doi: 10.1016/0266-4356(92)90180-q. [DOI] [PubMed] [Google Scholar]
- 4.Cavalcanti M. G, Rocha S. S, Vannier M. W. Craniofacial measurements based on 3D-CT volume rendering: implications for clinical applications. Dentomaxillofac Radiol. 2004;33:170–176. doi: 10.1259/dmfr/13603271. [DOI] [PubMed] [Google Scholar]
- 5.Cevidanes L. H, Bailey L. J, Tucker S. F, Styner M. A, Mol A, Phillips C. L, Proffit W. R, Turvey T. Three-dimensional cone-beam computed tomography for assessment of mandibular changes after orthognathic surgery. Am J Orthod Dentofacial Orthop. 2007;131:44–50. doi: 10.1016/j.ajodo.2005.03.029. [DOI] [PMC free article] [PubMed] [Google Scholar]
- 6.Jung Y. J, Kim M. J, Baek S. H. Hard and soft tissue changes after correction of mandibular prognathism and facial asymmetry by mandibular setback surgery: three-dimensional analysis using computerized tomography. Oral Surg Oral Med Oral Pathol Oral Radiol Endod. 2009;107:763.e8–771.e8. doi: 10.1016/j.tripleo.2008.12.026. [DOI] [PubMed] [Google Scholar]
- 7.Kusnoto B, Evans C. A. Reliability of a 3D surface laser scanner for orthodontic applications. Am J Orthod Dentofacial Orthop. 2002;122:342–348. doi: 10.1067/mod.2002.128219. [DOI] [PubMed] [Google Scholar]
- 8.Da Silveira A. C, Daw J. L, Jr, Kusnoto B, Evans C, Cohen M. Craniofacial applications of three-dimensional laser surface scanning. J Craniofac Surg. 2003;14:449–456. doi: 10.1097/00001665-200307000-00009. [DOI] [PubMed] [Google Scholar]
- 9.Soncul M, Bamber M. A. Evaluation of facial soft tissue changes with optical surface scan after surgical correction of class III deformities. J Oral Maxillofac Surg. 2004;62:1331–1340. doi: 10.1016/j.joms.2004.04.019. [DOI] [PubMed] [Google Scholar]
- 10.Kau C. H, Richmond S, Zhurov A. I, Knox J, Chestnutt I, Hartles F, Playle R. Reliability of measuring facial morphology with a 3-dimensional laser scanning system. Am J Orthod Dentofacial Orthop. 2005;128:424–430. doi: 10.1016/j.ajodo.2004.06.037. [DOI] [PubMed] [Google Scholar]
- 11.Baik H. S, Jeon J. M, Lee H. J. Facial soft-tissue analysis of Korean adults with normal occlusion using a 3-dimensional laser scanner. Am J Orthod Dentofacial Orthop. 2007;131:759–766. doi: 10.1016/j.ajodo.2005.08.038. [DOI] [PubMed] [Google Scholar]
- 12.Kim M. J, Lee D. Y, Lim Y. K, Baek S. H. Three-dimensional evaluation of soft tissue changes after mandibular setback surgery in class III malocclusion patients according to extent of mandibular setback, vertical skeletal pattern, and genioplasty. Oral Surg Oral Med Oral Pathol Oral Radiol Endod. In press doi: 10.1016/j.tripleo.2010.01.002. [DOI] [PubMed] [Google Scholar]
- 13.Solow B, Tallgren A. Natural head position in standing subjects. Acta Odontol Scand. 1971;29:591–607. doi: 10.3109/00016357109026337. [DOI] [PubMed] [Google Scholar]
- 14.Kau C. H, Cronin A. J, Richmond S. A three-dimensional evaluation of postoperative swelling following orthognathic surgery at 6 months. Plast Reconstr Surg. 2007;119:2192–2199. doi: 10.1097/01.prs.0000260707.99001.79. [DOI] [PubMed] [Google Scholar]
- 15.Kau C. H, Richmond S, Savio C, Mallorie C. Measuring adult facial morphology in three dimensions. Angle Orthod. 2006;76:773–778. doi: 10.1043/0003-3219(2006)076[0773:MAFMIT]2.0.CO;2. [DOI] [PubMed] [Google Scholar]
- 16.Miller L, Morris D. O, Berry E. Visualizing three-dimensional facial soft tissue changes following orthognathic surgery. Eur J Orthod. 2007;29:14–20. doi: 10.1093/ejo/cjl037. [DOI] [PubMed] [Google Scholar]
- 17.Robinson S. W, Speidel T. M, Isaacson R. J, Worms F. W. Soft tissue profile change produced by reduction of mandibular prognathism. Angle Orthod. 1972;42:227–235. doi: 10.1043/0003-3219(1972)042<0227:STPCPB>2.0.CO;2. [DOI] [PubMed] [Google Scholar]
- 18.Gjørup H, Athanasiou A. E. Soft-tissue and dentoskeletal profile changes associated with mandibular setback osteotomy. Am J Orthod Dentofacial Orthop. 1991;100:312–323. doi: 10.1016/0889-5406(91)70068-8. [DOI] [PubMed] [Google Scholar]
- 19.Hu J, Wang D, Luo S, Chen Y. Differences in soft tissue profile changes following mandibular setback in Chinese men and women. J Oral Maxillofac Surg. 1999;57:1182–1186. doi: 10.1016/s0278-2391(99)90481-0. [DOI] [PubMed] [Google Scholar]
- 20.Kim N. K, Lee C, Kang S. H, Park J. W, Kim M. J, Chang Y. I. A three-dimensional analysis of soft and hard tissue changes after a mandibular setback surgery. Comput Methods Programs Biomed. 2006;83:178–187. doi: 10.1016/j.cmpb.2006.06.009. [DOI] [PubMed] [Google Scholar]
- 21.Kim K. L, Kim S. S, Son W. S, Park S. B. Soft tissue changes associated with advancement genioplasty in skeletal class III individuals receiving mandibular set-back surgery. Korean J Orthod. 2008;38:104–120. [Google Scholar]
- 22.Alves P. V, Mazucheli J, Vogel C. J, Bolognese A. M. How the lower face soft tissue changes after mandibular advancement or setback. J Craniofac Surg. 2008;19:593–598. doi: 10.1097/SCS.0b013e31816aaa79. [DOI] [PubMed] [Google Scholar]


