

Abstract
Background
Pregnancy hyperglycaemia without meeting gestational diabetes mellitus (GDM) diagnostic criteria affects a significant proportion of pregnant women each year. It is associated with a range of adverse pregnancy outcomes. Although intensive management for women with GDM has been proven beneficial for women and their babies, there is little known about the effects of treating women with hyperglycaemia who do not meet diagnostic criteria for GDM and type 2 diabetes (T2DM).
Objectives
To assess the effects of different types of management strategies for pregnant women with hyperglycaemia not meeting diagnostic criteria for GDM and T2DM (referred as borderline GDM in this review).
Search methods
We searched the Cochrane Pregnancy and Childbirth Group’s Trials Register (30 September 2011).
Selection criteria
Randomised and cluster‐randomised trials comparing alternative management strategies for women with borderline GDM.
Data collection and analysis
Two review authors independently assessed study eligibility, extracted data and assessed risk of bias of included studies. Data were checked for accuracy.
Main results
We included four trials involving 543 women and their babies (but only data from 521 women and their babies is included in our analyses). Three of the four included studies had moderate to high risk of bias and one study was at low to moderate risk of bias. Babies born to women receiving management for borderline GDM (generally dietary counselling and metabolic monitoring) were less likely to be macrosomic (birthweight greater than 4000 g) (three trials, 438 infants, risk ratio (RR) 0.38, 95% confidence interval (CI) 0.19 to 0.74) or large‐for‐gestational (LGA) age (three trials, 438 infants, RR 0.37, 95% CI 0.20 to 0.66) when compared with those born to women in the routine care group. There were no significant differences in rates of caesarean section (three trials, 509 women, RR 0.93, 95% CI 0.68 to 1.27) and operative vaginal birth (one trial, 83 women, RR 1.37, 95% CI 0.20 to 9.27) between the two groups.
Authors' conclusions
This review found interventions including providing dietary advice and blood glucose level monitoring for women with pregnancy hyperglycaemia not meeting GDM and T2DM diagnostic criteria helped reduce the number of macrosomic and LGA babies without increasing caesarean section and operative vaginal birth rates. It is important to notice that the results of this review were based on four small randomised trials with moderate to high risk of bias without follow‐up outcomes for both women and their babies.
Keywords: Female; Humans; Infant, Newborn; Pregnancy; Blood Glucose; Blood Glucose/analysis; Cesarean Section; Cesarean Section/statistics & numerical data; Diabetes Mellitus, Type 2; Diabetes Mellitus, Type 2/blood; Diabetes Mellitus, Type 2/diagnosis; Diabetes, Gestational; Diabetes, Gestational/blood; Diabetes, Gestational/diagnosis; Fetal Macrosomia; Fetal Macrosomia/prevention & control; Glucose Tolerance Test; Hyperglycemia; Hyperglycemia/diet therapy; Hyperglycemia/therapy; Hypoglycemic Agents; Hypoglycemic Agents/therapeutic use; Infant, Postmature; Insulin; Insulin/therapeutic use; Patient Education as Topic; Pregnancy Complications; Pregnancy Complications/blood; Pregnancy Complications/diet therapy; Pregnancy Complications/therapy; Pregnant Women; Publication Bias; Randomized Controlled Trials as Topic
Plain language summary
Management of pregnant women with borderline gestational diabetes mellitus
Gestational diabetes mellitus (GDM) is usually said to be any degree of glucose intolerance or high blood glucose level (hyperglycaemia) that is first recognised during pregnancy. Yet no immediately obvious cut‐off points can be labelled as abnormal. It is unclear when treatment should be provided to normalise the blood glucose, as the relationship between increased hyperglycaemia and adverse pregnancy outcomes appears to be continuous. Pre‐eclampsia in the mother, birthweight greater than 4000 g (macrosomia), birth trauma with large‐for‐gestational age (LGA) babies, and a future risk of obesity and diabetes in the mothers and babies are all associated with hyperglycaemia during pregnancy. Intensive management involving lifestyle interventions and metabolic monitoring for women with GDM has been proven beneficial for women and their babies.
This review found dietary advice or counselling and blood glucose level monitoring for women with borderline GDM helped reduce the number of macrosomic and LGA babies. A single trial found that the interventions led to more inductions of labour. The interventions did not increase the risk of caesarean sections, operative vaginal births or women's weight gain in pregnancy. These findings were based on four small randomised controlled trials (involving 543 women). The trials were of moderate to high risk of bias and only data from 521 women and their babies is included in our analyses. Until additional evidence from large well designed randomised trials becomes available, current evidence is insufficient to make conclusive recommendations for the management of women with pregnancy high blood glucose concentrations not meeting GDM (or type 2 diabetes) diagnostic criteria.
Background
Description of the condition
Introduction and definition of pregnancy hyperglycaemia meeting and without meeting GDM diagnostic criteria
Gestational diabetes mellitus (GDM) is usually defined as 'any degree of glucose intolerance or any severity of hyperglycaemia (high blood glucose level) with onset or first recognition during pregnancy' (Metzger 1998; WHO 1999). Therefore, GDM may include previously undetected type 1 (T1DM) or type 2 (T2DM) diabetes or diabetes presenting only during pregnancy (Metzger 1998).
Screening for GDM is usually by either a universal screening procedure (all pregnant women are screened for GDM) or a selective risk‐related procedure (only pregnant women with one or more risk factors for GDM are screened) (ADA 2009). Regardless of which policy is used for screening, the diagnosis of GDM is usually based on either a 75‐gram two‐hour oral glucose tolerance test (OGTT) or a 100‐gram three‐hour OGTT (ADA 2009;Hoffman 1998;IADPSG 2010; NICE 2008; WHO 1999). However, different health bodies recommend slightly different criteria for GDM diagnosis in regard to OGTT, which means different populations of women are labelled as having GDM in different parts of the world (IADPSG 2010). Moreover, the recommendations on GDM diagnostic criteria have changed over time, sometimes due to the changing understanding about the effects of hyperglycaemia on pregnancy outcomes (Coustan 2010).
Some women have glucose concentrations that do not meet diagnostic criteria for GDM, but which are toward the upper end of the recommended normal range. As for women with GDM, these women are at increased risk of adverse pregnancy outcomes. Interventions lowering blood glucose concentrations may be beneficial for them.
Aetiology of pregnancy hyperglycaemia
Insulin, secreted by pancreatic beta cells in response to increasing blood glucose concentrations, helps to maintain normal concentrations. Either inadequate insulin secretion (such as in T1DM) or insulin resistance (defined as insulin acting less effectively in promoting glucose uptake) (such as in T2DM or GDM) can result in hyperglycaemia.
Insulin resistance increases with advancing gestation (Clapp 2006). Hormones secreted from the placenta, including tumour necrosis factor‐alpha (TNF‐α), placental lactogen, placental growth hormone, cortisol and progesterone are thought to be the likely triggers of these physiological changes (Clapp 2006; Devlieger 2008). Increasing insulin resistance in pregnancy, especially during the third trimester, helps to meet the increased nutrient requirement for fetal development and promotes fetal growth by increasing maternal glucose supply (Devlieger 2008). Hyperglycaemia during pregnancy occurs when the insulin secretion is inadequate for the degree of insulin resistance (Clapp 2006).
Epidemiology of pregnancy hyperglycaemia
The prevalence of GDM is rising worldwide with 1% to 14% of pregnancies being affected (Bottalico 2007; Dabelea 2005; Ferrara 2007; Ragnarsdottir 2010). In low‐risk populations, the estimated GDM prevalence is 1.4% to 2.8% (Mulla 2010); in higher risk populations, the estimated prevalence is 3.3% to 6.1% and in some high‐risk populations, the prevalence may be higher than 10% (Mulla 2010).
Few data are available on the prevalence of pregnancy hyperglycaemia which does not meet GDM diagnostic criteria. Data from Australian studies suggest that in addition to the 5.5% to 8.8% women with GDM, a further 7% of all pregnant women have hyperglycaemia not meeting GDM diagnostic criteria each year (normal 75‐gram OGTT was defined as fasting blood glucose less than 5.5 mmol/L, and two‐hour blood glucose less than 7.8 mmol/L) (Dodd 2007; Ju 2008). Results from a US study indicated the prevalence of pregnancy hyperglycaemia without meeting GDM diagnostic criteria was about 8.8% (normal 100‐gram OGTT was defined as fasting glucose less than 5.6 mmol/L (100 mg/dL); one‐hour glucose less than 10.6 mmol/L (190 mg/dL); two‐hour glucose less than 9.2 (165 mg/dL); three‐hour glucose less than 8.1 (145 mg/dL) (Stamilio 2004).
Risk factors for pregnancy hyperglycaemia
There are a range of known risk factors for hyperglycaemic disorders during pregnancy. Advanced maternal age and maternal overweight/obesity are among the most common risk factors (Morisset 2010). Women with some specific ethnicities are at higher risk of developing pregnancy hyperglycaemia; these include African‐American, Asian‐American, Native American, African, Hispanic, Asian, Pacific Islander, and Indigenous Australian (ADA 2009; Ben‐Haroush 2004; Hoffman 1998; Petry 2010). Other risk factors include: history of having a macrosomic (birthweight 4000 g or more) infant, history of GDM, family history of diabetes mellitus, maternal high or low birthweight, high parity, polycystic ovarian syndrome and cigarette smoking (Cypryk 2008; Petry 2010; Solomon 1997). Diet and lifestyle factors, such as low fibre and high glycaemic load diet and physical inactivity, are also associated with an increased risk of pregnancy hyperglycaemia (Chasan‐Taber 2008; Zhang 2006).
Clinical outcomes for women with pregnancy hyperglycaemia
Pregnancy hyperglycaemia affects both mothers and their babies. The effects of maternal hyperglycaemia on the pregnancy outcomes do not occur at specific thresholds but are increased on a continuum with increasing hyperglycaemia (Metzger 2008).
1) Maternal outcomes related to pregnancy hyperglycaemia
For women with pregnancy hyperglycaemia, there is an increased risk of developing pre‐eclampsia and an increased use of induction of labour (Anderberg 2010; Crowther 2005; Dodd 2007; Ju 2008; Landon 2009; Metzger 2008; Sermer 1998). The risk of having caesarean section is also increased (Dodd 2007; Landon 2009; Metzger 2008; Sermer 1998). Due to the risk of having a large‐for‐gestational‐age (LGA) or macrosomic baby, mothers are at higher risk of cephalopelvic disproportion, uterine rupture, shoulder dystocia and perineal lacerations (Jastrow 2010). Evidence from a systematic review showed hyperglycaemia in pregnancy was highly predictive for the later development of diabetes, with more than 50% of women with GDM developing type 2 diabetes mellitus within 10 years of the index pregnancy (Kim 2002).
There are a range of known health risks associated with pregnancy hyperglycaemia without meeting GDM diagnostic criteria. A large multicentre and multiethnic cohort study (HAPO study) of 25,505 women assessed the effect of maternal hyperglycaemia on pregnancy outcomes (Metzger 2008). This study found a significant, continuous association between maternal glucose concentrations below those for a diagnosis of GDM and caesarean section and pre‐eclampsia (Metzger 2008). Similarly, data from 16,975 women who gave birth at a tertiary Australian hospital from 1993 to 2003 showed that women with borderline GDM had increased risk of pre‐eclampsia and caesarean section, and their infants were at increased risk of hypoglycaemia and hyperbilirubinaemia compared with women having normal glucose tolerance and their babies (Dodd 2007). Borderline GDM was defined as a positive OGCT (blood glucose 7.8 mmol/L or more; one hour after a 50 g glucose load) and a normal 75 g OGTT (fasting blood glucose less than 5.5 mmol/L and two‐hour blood glucose less than 7.8 mmol/L) (Dodd 2007). Another Australian study that recruited 1804 primiparous women from four different states assessed the effect of borderline GDM (blood glucose 7.8 mmol/L or more one hour after a 50 g glucose load) and a normal 75 g OGTT (fasting blood glucose less than 5.5 mmol/L and two‐hour blood glucose less than 7.8 mmol/L) on pregnancy outcomes (Ju 2008). Women with borderline GDM were at increased risk of a serious maternal outcome, pregnancy hypertension and caesarean section (Ju 2008).
2) Neonatal, infant and later outcomes related to pregnancy hyperglycaemia
Any degree of maternal hyperglycaemia, whether meeting GDM diagnostic criteria or not, exposes the fetus to an intrauterine environment of increased concentrations of glucose through transplacental passage (Reece 2009). As maternal insulin does not cross the placenta from the mother to fetus, the fetus is forced to increase its own insulin secretion (Reece 2009). Excessive insulin produced by the fetus may lead to fetal over‐growth, known as LGA; or a birthweight of 4000 g or more (Ju 2008; Metzger 2008; Reece 2009). Birthweight of 4000 g or more, known as macrosomia, complicates about 50% of pregnancies with GDM, which includes women with optimal glycaemic control through interventions (Catalano 2003). Moreover, babies born to women with pregnancy hyperglycaemia have significantly greater skinfold measures and fat mass compared with infants of women with normal glucose tolerance (Catalano 2003; McFarland 1998; Vohr 1997).
Being a LGA fetus or macrosomic infant is a surrogate for many of the complications associated with pregnancy hyperglycaemia (Esakoff 2009; Metzger 2008). Babies who are LGA or macrosomic are at increased risk of injury during birth, such as shoulder dystocia, perinatal asphyxia, bone fractures and nerve palsies (Henriksen 2008; Langer 2005; Metzger 2008).
After birth, babies of women with hyperglycaemic disorders are at higher risk of having other neonatal complications such as respiratory distress syndrome, hypoglycaemia, hyperbilirubinaemia (increased levels of bilirubin in the blood), cardiomyopathy (the deterioration of the function of the myocardium), hypocalcaemia, hypomagnesaemia, polycythaemia, hyperviscosity and admission to neonatal nursery (Ju 2008; Metzger 2008; Reece 2009; Soler 1978).
In the longer term, children born to mothers with hyperglycaemia are at increased risk of being overweight or obese in childhood and adulthood regardless of their birthweight, developing T1DM and T2DM and having impaired intellectual achievement (Harder 2009; Mulla 2010; Petitt 1985; Rizzo 1997; Whincup 2008; Yogev 2009).
At every age measured, the offspring of women with GDM are heavier (adjusted for height) and higher adiposity than the offspring of women with normal glycaemia during pregnancy (Pettitt 1983; Petitt 1985; Vohr 1997; Vohr 1999). In addition, there is a positive trend for increasing childhood obesity at age of five to seven years across the range of increasing maternal hyperglycaemia during pregnancy, which remained after adjustment for maternal weight gain, maternal age, parity, ethnicity and birthweight (Hillier 2007).
Infants born LGA are also at increased risk of developing the metabolic syndrome (a cluster of risk factors defined by the occurrence of three of the following: obesity, hypertension, hypertriglyceridaemia and low high‐density lipoprotein cholesterol concentration) in childhood, adolescence and adulthood (Barker 1994; Guerrero‐Romero 2010; Harder 2009). Childhood development of the metabolic syndrome predicts adult T2DM at 25 to 30 years of age (Morrison 2008). These health problems continue across generations (Mulla 2010; Petitt 1985). Evidence also shows LGA and macrosomia may be associated with increased risk of developmental delay (Ornoy 2005; Rizzo 1997; Slining 2010) and premenopausal breast cancer (Forman 2005).
Description of the intervention
Treatment for pregnancy hyperglycaemia
The primary aims of treatment for pregnancy hyperglycaemia are to optimise glycaemic control and improve pregnancy outcomes (Alwan 2009). Management includes any or all of: diet and exercise advice, use of oral glucose‐lowering agents (e.g. metformin, glyburide), administration of insulin, fetal surveillance (e.g. doppler umbilical blood flow measurement, cardiotocograph and ultrasonography) and maternal glucose monitoring (Hoffman 1998; Metzger 2007).
Providing dietary and exercise advice is usually recommended as the primary therapeutic strategy for women with GDM to achieve acceptable glycaemic control (ACOG 2001; Hoffman 1998; NICE 2008). Evidence from randomised controlled trials had suggested that diet and exercise interventions were effective in improving pregnancy outcomes for women with pregnancy hyperglycaemia (Bonomo 2005;Crowther 2005; Landon 2009).
If these interventions alone are not enough to achieve good maternal glycaemic control, insulin therapy may be indicated (ACOG 2001; Hoffman 1998; NICE 2008). Oral hypoglycaemics such as glyburide and metformin have been used as alternatives to insulin therapy (Alwan 2009; Silva 2010; Simmons 2004). As a part of management for GDM, maternal glucose monitoring is always used for guiding treatment and ultrasonography helps to guide management of birth (ACOG 2001; Hoffman 1998).
A Cochrane review assessed the effect of these management interventions for women with GDM on maternal and infant outcomes (Alwan 2009), and found such management was effective and beneficial for women with GDM and their infants (Alwan 2009). Similar findings were reported in another systematic review on the effects of treatment in women with GDM (Horvath 2010). What is uncertain is whether these interventions are beneficial for women with a lower degree of pregnancy hyperglycaemia (Landon 2010; Sacks 2009).
Why it is important to do this review
Pregnancy hyperglycaemia without meeting GDM diagnostic criteria affects a significant proportion of pregnant women (Dodd 2007; Ju 2008; Rumbold 2006; Stamilio 2004). Hyperglycaemia during pregnancy is associated with adverse pregnancy outcomes including macrosomia, respiratory distress syndrome and future development of obesity and T1DM or T2DM in the offspring (Dabelea 2000; Dabelea 2007; Harder 2009; Hillier 2007;Metzger 2008; Silverman 1995) and pre‐eclampsia, birth trauma, and development of type 2 diabetes in the mother (Kim 2002; Metzger 2008). The relationship between increased hyperglycaemia and the adverse pregnancy outcomes appears to be continuous (Metzger 2008; Mulla 2010). There are no immediately obvious cut‐off points which can be labelled as abnormal to diagnose GDM (Metzger 2008; Mulla 2010). It is therefore unclear at what degree of pregnancy hyperglycaemia 'treatment' should be provided to normalise blood glucose.
Although intensive management of GDM has been proven beneficial for women with GDM and their babies (Alwan 2009; Crowther 2005; Horvath 2010; Landon 2009), there is little known about the effects of managing women with hyperglycaemia who do not meet diagnostic criteria for GDM and T2DM. This review aims to provide reliable evidence to guide the best care for women with pregnancy hyperglycaemia not meeting GDM diagnostic criteria.
Objectives
To assess the effects of different types of management strategies for pregnant women with hyperglycaemia not meeting diagnostic criteria for gestational diabetes mellitus (GDM) and type 2 diabetes (referred to as borderline GDM in this review).
Methods
Criteria for considering studies for this review
Types of studies
All published randomised controlled trials (RCTs) and cluster‐randomised trials comparing alternative management strategies for women with borderline gestational diabetes mellitus (GDM). We intended to include published abstracts for RCTs and cluster‐RCTs if relevant outcome data were available. We planned to exclude quasi‐RCTs and crossover trials.
Types of participants
Pregnant women with hyperglycaemia who do not meet the diagnostic criteria for GDM. Diagnostic criteria for GDM based on oral glucose tolerance test results are defined variously by individual trialists according to local health authorities and professional organisations.
Women were eligible regardless of gestation, age, parity or plurality.
Women with pre‐existing diabetes mellitus and previously treated GDM were not eligible.
We intended to included trials that included pregnant women with normal glycaemia, GDM or pre‐existing diabetes mellitus if we could extract subgroup data for women with hyperglycaemia not meeting diagnostic criteria separately.
Types of interventions
We planned to include any form of management for women with pregnancy hyperglycaemia not meeting GDM diagnostic criteria above routine antenatal care in the review. These included any type of dietary advice (standard or individualised), exercise and lifestyle advice (standard or individualised) and drug treatment including insulin and oral drugs.
One type of intervention compared with standard antenatal care. These included: any type of dietary advice (standard or individualised) compared with standard antenatal care; any type of exercise advice (standard or individualised) compared with standard antenatal care; drug treatment compared with standard antenatal care. Multiple forms of intervention compared with standard care, i.e. diet and exercise advice compared with standard antenatal care; diet and exercise advice and drug treatment compared with standard antenatal care. Two forms of management would be compared against each other, i.e. diet and exercise advice compared with drug treatment. Two or more types of the same form of management could be compared against each other, i.e. standard dietary advice compared with individualised dietary advice; standard exercise advice compared with individualised exercise advice; different types of dietary advice could be compared with each other; insulin treatment could be compared with oral drug treatment.
Types of outcome measures
Primary outcomes
Fetal/neonatal outcomes
Fetal/neonatal mortality;
LGA (birthweight greater than or equal to 90th percentile for gestational age);
macrosomia (birthweight greater than 4000 g or greater than 4500 g as defined by authors).
Maternal outcomes
Mode of birth (normal vaginal birth, operative vaginal birth, caesarean section).
Secondary outcomes
Fetal/neonatal outcomes
Neonatal hypoglycaemia requiring treatment (variously defined by authors of individual trials);
gestational age at birth;
preterm birth (less than 37 weeks' gestation);
birthweight;
small‐for‐gestational age;
shoulder dystocia;
bone fracture;
nerve palsy;
respiratory distress syndrome;
use of assisted ventilation;
hyperbilirubinaemia requiring treatment;
Apgar scores (less than seven at five minutes);
Apgar scores (less than four at five minutes);
Ponderal index*;
skinfold thickness measurements.
* a measure of leanness of a person calculated as a relationship between mass and height; can provide valid results even for very short and very tall persons.
Childhood outcomes
Weight;
height;
body mass index (BMI);
fat mass/fat‐free mass;
skinfold thickness measurements;
blood pressure;
impaired glucose tolerance (as defined by author(s));
type 1 diabetes;
type 2 diabetes;
insulin sensitivity (as defined by author(s));
dyslipidaemia or metabolic syndrome;
childhood neurodisability;
educational achievement.
Adulthood
Weight;
height;
BMI;
fat mass/fat‐free mass;
skinfold thickness measurements;
blood pressure;
impaired glucose tolerance (as defined by author(s));
development of type 1 diabetes;
development of type 2 diabetes;
insulin sensitivity (as defined by author(s));
dyslipidaemia or metabolic syndrome;
educational achievement.
Maternal outcomes
Perinatal
Pre‐eclampsia;
insulin or oral hypoglycaemic agent required for hyperglycaemia;
weight gain during pregnancy (according to IOM 2009 pregnancy weight gain guidelines);
induction of labour;
augmentation of labour;
perineal trauma;
postpartum haemorrhage;
postpartum infection;
adherence to treatment;
women’s sense of well‐being and quality of life (as defined by author(s));
women’s view of intervention.
Long term
Postnatal weight retention;
BMI;
gestational diabetes in subsequent pregnancy;
development of type 2 diabetes mellitus;
development of type 1 diabetes mellitus;
impaired glucose tolerance (as defined by author(s));
insulin sensitivity (as defined by author(s)).
Health services cost
Number of hospital visits/antenatal visits for mother;
dietitian visits;
medical physician visits;
cost for blood glucose monitoring during pregnancy;
costs to families in relation to the management provided;
length of postnatal stay (mother);
admission to neonatal nursery/neonatal intensive care unit;
length of postnatal stay (baby);
cost of maternal care;
cost of offspring care.
Search methods for identification of studies
Electronic searches
We contacted the Trials Search Co‐ordinator to search the Cochrane Pregnancy and Childbirth Group’s Trials Register (30 September 2011).
The Cochrane Pregnancy and Childbirth Group’s Trials Register is maintained by the Trials Search Co‐ordinator and contains trials identified from:
quarterly searches of the Cochrane Central Register of Controlled Trials (CENTRAL);
weekly searches of MEDLINE;
weekly searches of EMBASE;
handsearches of 30 journals and the proceedings of major conferences;
weekly current awareness alerts for a further 44 journals plus monthly BioMed Central email alerts.
Details of the search strategies for CENTRAL, MEDLINE and EMBASE, the list of handsearched journals and conference proceedings, and the list of journals reviewed via the current awareness service can be found in the ‘Specialized Register’ section within the editorial information about the Cochrane Pregnancy and Childbirth Group.
Trials identified through the searching activities described above are each assigned to a review topic (or topics). The Trials Search Co‐ordinator searches the register for each review using the topic list rather than keywords.
We did not apply any language restrictions.
Data collection and analysis
Selection of studies
Two review authors independently assessed for inclusion all the potential studies we identified as a result of the search strategy. We resolved disagreements through discussion and consulted a third author as necessary.
Data extraction and management
We designed a form to extract data. For eligible studies, at least two review authors extracted the data using the agreed form. We resolved discrepancies through discussion. We entered data into Review Manager software (RevMan 2011) and checked for accuracy.
When information regarding any of the above was unclear, we attempted to contact authors of the original reports to provide further details.
Assessment of risk of bias in included studies
Two review authors independently assessed risk of bias for each study using the criteria outlined in the Cochrane Handbook for Systematic Reviews of Interventions (Higgins 2011). We resolved any disagreement by discussion or by involving a third assessor.
(1) Sequence generation (checking for possible selection bias)
We described for each included study the method used to generate the allocation sequence in sufficient detail to allow an assessment of whether it should produce comparable groups.
We assessed the method as:
low risk of bias (any truly random process, e.g. random number table; computer random number generator);
high risk of bias (any non‐random process, e.g. odd or even date of birth; hospital or clinic record number); or
unclear risk of bias.
(2) Allocation concealment (checking for possible selection bias)
We described for each included study the method used to conceal the allocation sequence and determine whether intervention allocation could have been foreseen in advance of, or during recruitment, or changed after assignment.
We assessed the methods as:
low risk of bias (e.g. telephone or central randomisation; consecutively numbered sealed opaque envelopes);
high risk of bias (open random allocation; unsealed or non‐opaque envelopes, alternation; date of birth);
unclear risk of bias.
(3.1) Blinding of participants and personnel (checking for possible performance bias)
We described for each included study the methods used, if any, to blind study participants and personnel from knowledge of which intervention a participant received. We considered that studies are at low risk of bias if they were blinded, or if we judged that the lack of blinding would be unlikely to affect results. We assessed blinding separately for different outcomes or classes of outcomes.
We assessed the methods as:
low, high or unclear risk of bias for participants;
low, high or unclear risk of bias for personnel.
(3.2) Blinding of outcome assessment (checking for possible detection bias)
We described for each included study the methods used, if any, to blind outcome assessors from knowledge of which intervention a participant received. We assessed blinding separately for different outcomes or classes of outcomes.
We assessed methods used to blind outcome assessment as:
low, high or unclear risk of bias.
(4) Incomplete outcome data (checking for possible attrition bias through withdrawals, dropouts, protocol deviations)
We described for each included study, and for each outcome or class of outcomes, the completeness of data including attrition and exclusions from the analysis. We stated whether attrition and exclusions were reported, the numbers included in the analysis at each stage (compared with the total randomised participants), reasons for attrition or exclusion where reported, and whether missing data were balanced across groups or were related to outcomes. Where sufficient information was reported, or could be supplied by the trial authors, we re‐included missing data in the analyses which we undertook.
We assessed methods as:
low risk of bias (e.g. no missing outcome data; missing outcome data balanced across groups);
high risk of bias (e.g. numbers or reasons for missing data imbalanced across groups; ‘as treated’ analysis done with substantial departure of intervention received from that assigned at randomisation);
unclear risk of bias.
(5) Selective reporting bias
We described for each included study how we investigated the possibility of selective outcome reporting bias and what we found.
We assessed the methods as:
low risk of bias (where it was clear that all of the study’s pre‐specified outcomes and all expected outcomes of interest to the review had been reported);
high risk of bias (where not all the study’s pre‐specified outcomes had been reported; one or more reported primary outcomes were not pre‐specified; outcomes of interest were reported incompletely and so could not be used; study fails to include results of a key outcome that would have been expected to have been reported);
unclear risk of bias.
(6) Other sources of bias
We described for each included study any important concerns we had about other possible sources of bias.
We assessed whether each study was free of other problems that could put it at risk of bias:
low risk of other bias;
high risk of other bias;
unclear whether there is risk of other bias.
(7) Overall risk of bias
We made explicit judgements about whether studies were at high risk of bias, according to the criteria given in the Handbook (Higgins 2011). With reference to (1) to (6) above, we assessed the likely magnitude and direction of the bias and whether we considered it was likely to impact on the findings. We planned to explore the impact of the level of bias through undertaking sensitivity analyses ‐ seeSensitivity analysis.
Measures of treatment effect
Dichotomous data
For dichotomous data, we presented results as summary risk ratio with 95% confidence intervals.
Continuous data
For continuous data, we used the mean difference if outcomes were measured in the same way between trials. We used the standardised mean difference to combine trials that measured the same outcome, but used different methods.
Unit of analysis issues
Cluster‐randomised trials
We did not identify any cluster‐randomised trials for inclusion. However, if we identify cluster‐randomised trial in future updates of this review, we will include them in the analyses along with individually randomised trials. We will adjust their sample sizes using the methods described in the Handbook using an estimate of the intracluster correlation co‐efficient (ICC) derived from the trial (if possible), from a similar trial or from a study of a similar population. If we use ICCs from other sources, we will report this and conduct sensitivity analyses to investigate the effect of variation in the ICC. If we identify both cluster‐randomised trials and individually‐randomised trials, we plan to synthesise the relevant information. We will consider it reasonable to combine the results from both if there is little heterogeneity between the study designs and the interaction between the effect of intervention and the choice of randomisation unit is considered to be unlikely.
We will also acknowledge heterogeneity in the randomisation unit and perform a sensitivity analysis to investigate the effects of the randomisation unit.
Dealing with missing data
For included studies, we noted levels of attrition. We explored the impact of including studies with high levels of missing data in the overall assessment of treatment effect by using sensitivity analysis.
For all outcomes, we carried out analyses, as far as possible, on an intention‐to‐treat basis, i.e. we attempted to include all participants randomised to each group in the analyses, and all participants will be analysed in the group to which they were allocated, regardless of whether or not they received the allocated intervention. The denominator for each outcome in each trial would be the number randomised minus any participants whose outcomes were known to be missing.
Assessment of heterogeneity
We assessed statistical heterogeneity in each meta‐analysis using the T², I² and Chi² statistics. We regarded heterogeneity as substantial if I² was greater than 30% and either T² was greater than zero, or there was a low P value (less than 0.10) in the Chi² test for heterogeneity.
Assessment of reporting biases
In future updates of this review, if there are 10 or more studies in the meta‐analysis we will investigate reporting biases (such as publication bias) using funnel plots. We will assess funnel plot asymmetry visually, and use formal tests for funnel plot asymmetry. For continuous outcomes we will use the test proposed by Egger 1997, and for dichotomous outcomes we will use the test proposed by Harbord 2006. If we detect asymmetry in any of these tests or by a visual assessment, we will perform exploratory analyses to investigate it.
Data synthesis
We carried out statistical analysis using the Review Manager software (RevMan 2011). We used fixed‐effect meta‐analysis for combining data where it was reasonable to assume that studies were estimating the same underlying treatment effect: i.e. where trials were examining the same intervention, and the trials’ populations and methods were judged sufficiently similar. If there was clinical heterogeneity sufficient to expect that the underlying treatment effects differ between trials, or if substantial statistical heterogeneity was detected, we used random‐effects meta‐analysis to produce an overall summary if an average treatment effect across trials was considered clinically meaningful. We treated the random‐effects summary as the average range of possible treatment effects and we discussed the clinical implications of treatment effects differing between trials. If the average treatment effect was not clinically meaningful we would not combine trials.
When we used random‐effects analyses, we have presented the results as the average treatment effect with its 95% confidence interval, and the estimates of T² and I².
Subgroup analysis and investigation of heterogeneity
If we identified substantial heterogeneity, we would have investigated it using subgroup analyses and sensitivity analyses. We planned to consider whether an overall summary was meaningful, and if it was, use random‐effects analysis to produce it.
Different types of treatment, ways of delivering treatment, variations in the severity of hyperglycaemia and maternal characteristics may have significant effects on pregnancy outcomes. We planned to carry out the following subgroup analyses, but there were not enough trials included to conduct these subgroup analyses.
1. Maternal characteristics
Maternal age
35 years of age or more compared with below 35 years of age.
Maternal body mass index (BMI) at or before trial entry
BMI ranges of 18.5 to 24.9 kg/m² compared with less than 18.5 kg/m²;
BMI ranges of 18.5 to 24.9 kg/m² compared with 25 to 29.9 kg/m²;
BMI ranges of 18.5 to 24.9 kg/m² compared with 30 kg/m² to 39.9 kg/m²;
BMI ranges of 18.5 to 24.9 kg/m² compared with 40 kg/m² or more.
-
Ethnicity
High‐risk ethnic group compared with low risk ethnic group.
-
Parity
Parity of 0 compared with 1‐2;
parity of 0 compared with 3 or more.
2. Severity of hyperglycaemia at OGTT diagnostic testing (diagnostic criteria are defined variously by individual trials)
All blood glucose values below diagnostic cut‐off points for GDM compared with one or more values above cut‐off points in diagnostic testing;
one blood glucose value above diagnostic cut‐off points for GDM compared with two values above cut‐off points in diagnostic testing.
3. Types of treatment
Dietary advice (standard dietary advice compared with individualised dietary advice);
exercise/lifestyle intervention (standard exercise/lifestyle intervention compared with individualised exercise/lifestyle intervention);
oral hypoglycaemics compared with insulin;
different types of hypoglycaemics (one type of hypoglycaemics compared with another);
different insulin regimens (one insulin regimen compared with another regimen);
one form of treatment (e.g. dietary advice alone) compared with multiple forms of treatment (e.g. dietary and exercise advice).
4. Ways of delivering treatment
Group intervention compared with individual intervention;
face‐to‐face intervention compared with non‐face‐to‐face intervention (e.g. phone counselling, information package, etc.).
We planned to use primary outcomes in subgroup analyses.
We planned to assess differences between subgroups by interaction tests where possible.
Sensitivity analysis
We planned to carry out sensitivity analysis to explore the effects of trial quality assessed by allocation concealment and other risk of bias components, by omitting studies rated as inadequate for these components. We planned to restrict this to the primary outcomes.
Results
Description of studies
Results of the search
We identified a total of 35 trials through the search of the PCG Trials Register. Following application of eligibility criteria, 24 trials were not relevant to this review due to the different study population (e.g. women with gestational diabetes mellitus (GDM), or women with normal pregnancy). We included four trials (Bevier 1999; Bonomo 2005; Grant 2011; Langer 1989) and excluded seven trials (Bung 1993; Dunne 2001; Ford 1997; Li 1987; Li 1999; Maresh 1983; Yang 2003). One trial was ongoing (Crowther 2007) and we will consider it for inclusion in the next update. We identified another ongoing trial through contacting one of the trial investigators (Wolever 2011 [pers comm]); we will also consider it for inclusion in next update. SeeCharacteristics of included studies; Characteristics of excluded studies; Characteristics of ongoing studies.
Included studies
We have included four trials (involving 543 women) in this review (Bevier 1999; Bonomo 2005; Grant 2011; Langer 1989) but data from only 521 women and their babies is included in our analyses
Two of the four included studies were from the United States (Bevier 1999; Langer 1989) and one each was from Canada (Grant 2011) and Italy (Bonomo 2005).
Participants
We have included a total of 543 women in this review, and included 521 women in the data analysis. The majority of women (94%) in Bevier 1999's study were white or of Hispanic ethnicity. One‐third of women were black, Hispanic or white in Langer 1989's study. Bonomo 2005 included only Caucasian women. Women in Grant 2011's study were from diverse ethnicities of south east Asian, Indian, Caucasian, east Asian, Caribbean, mixed and Hispanic.
Bevier 1999 and Bonomo 2005 included women with a positive 50‐gram one‐hour GCT but a normal 100‐gram three‐hour OGTT. Langer 1989 included women with a positive GCT and only one abnormal value on their 100‐gram three‐hour OGTT. Grant 2011 included women with a positive GCT and only one abnormal value on 75‐gram two‐hour OGTT.
The National Diabetes Data Group GDM diagnostic criteria were used in Bevier 1999 and Langer 1989. Bonomo 2005 used Carpenter and Coustan's criteria and Grant 2011 used Canadian Diabetes Association (CDA) criteria (details are included in Characteristics of included studies).
Intervention and comparison
Bevier 1999 compared dietary counselling, home glucose monitoring and clinic random glucose check, weekly home glucose monitoring diary review with clinic random blood glucose check only. Insulin therapy was considered for women in both groups in Bevier 1999. In Bonomo 2005, interventions included dietary counselling with follow‐ups to assess compliance, fortnightly checking of two‐hour postprandial blood glucose, HbA1c and fructosamine at clinic, and daily urine test for ketone bodies at home; women in the control group followed standard care with no diet or pharmacological treatment (Bonomo 2005). All participants in Grant 2011's study received diet counselling, but women in the intervention group were asked to select their starch choices from an exchange list of low glycaemic index (GI) foods, while women in the control group were asked to select their starch choices from an exchange list of intermediate‐ and high‐GI foods, which reflected the typical dietary intake of the local population.
In Langer 1989, interventions included capillary blood glucose monitoring seven times a day, diet counselling and insulin therapy when diet alone was not able to achieve the blood glucose target of 95 mg/dl (5.3 mmol/L); women in the control group received routine diet with baseline capillary blood glucose monitoring for four weeks (Langer 1989).
Outcome
All the four included studies focused on perinatal health related outcomes for women and their babies (Bevier 1999; Bonomo 2005; Grant 2011Langer 1989). None of the included studies included longer term outcomes for mothers and their babies.
See the Characteristics of included studies table for more details.
Excluded studies
We excluded three trials which were not randomised controlled trials (Li 1987; Li 1999; Maresh 1983). Two trials included women with pregnancy hyperglycaemia who had reached the diagnostic criteria for GDM (Ford 1997; Yang 2003). One trial used fasting plasma glucose values for pregnancy hyperglycaemia diagnosis instead of using OGTT, which did not meet the inclusion criteria for this review (Bung 1993). We excluded one trial as there were no published or unpublished data available (Dunne 2001).
Risk of bias in included studies
Three of the four included studies were at moderate to high risk of bias and one study (Grant 2011) was at low to moderate risk of bias. See Figure 1 and Figure 2.
1.
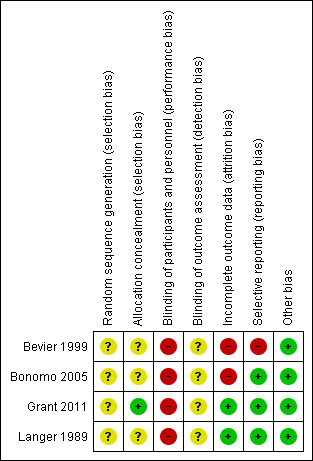
Risk of bias summary: review authors' judgements about each risk of bias item for each included study.
2.
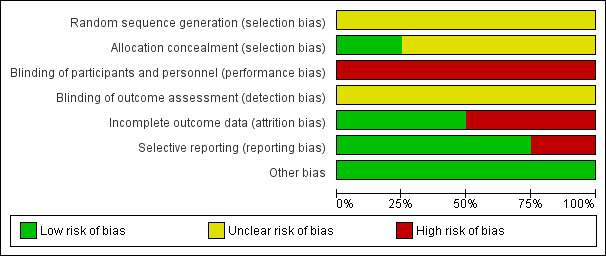
Risk of bias graph: review authors' judgements about each risk of bias item presented as percentages across all included studies.
Allocation
Three trials reported that women were randomly allocated to intervention and control groups, without information on the method of randomisation and allocation concealment (Bevier 1999; Bonomo 2005; Langer 1989). One trial (Grant 2011) used numbered, sealed, opaque envelopes to allocate women to groups, and blocks were used in sequence generation; the randomisation order in this study was generated by one of the investigators who was not involved in recruitment.
Blinding
Grant 2011 described the trial as an "open‐label" pilot study. Bonomo 2005 reported that all women and the attending physicians were informed of the results of the GCT and OGTT. Women in this trial were unlikely to be blinded; however, it was unclear about whether research personnel were blinded or not. No information on whether research personnel were blinded or not in Bevier 1999 and Langer 1989; and it is unlikely that participants were blinded in these two trials.
None of the trials reported on whether outcome assessors were blinded (Bevier 1999; Bonomo 2005; Grant 2011; Langer 1989).
Incomplete outcome data
A total of 20 women (19.4%) were excluded post randomisation in Bevier 1999's study. Five women (four in control group, one in experimental group) were excluded due to requiring insulin treatment; another 14 women were excluded due to poor compliance for diet and home blood glucose monitoring (HBGM) in the intervention group or receiving diet counselling and/or HBGM instruction in the control group; one woman was excluded due to therapeutic abortion (Bevier 1999).
In Bonomo 2005, there were six women (2%) in the intervention group lost to follow‐up, and nine women (3%) in the intervention group and six (2%) in the control group were excluded post‐randomisation due to a diagnosis of GDM during re‐evaluation at 30 to 34 weeks' gestation (Bonomo 2005).
There were no losses to follow‐up or post‐randomisation exclusions reported in Grant 2011 and Langer 1989.
Selective reporting
In Bevier 1999, macrosomia was not clearly defined and the rate of macrosomia was unclear. There was no obvious risk of selective reporting in Bonomo 2005, Grant 2011 and Langer 1989.
Other potential sources of bias
No obvious risk of other potential sources of bias for the included studies was apparent (Bevier 1999; Bonomo 2005; Grant 2011; Langer 1989).
Effects of interventions
Intensive management versus routine care
Primary outcomes
Fetal or neonatal mortality was not reported in Bevier 1999, Bonomo 2005 or Langer 1989. Grant 2011 reported that there were no fetal or neonatal deaths.
Macrosomia and LGA were reported as outcomes in all four included trials. Babies born to women in the intervention group were less likely to be LGA (three trials, 438 infants, risk ratio (RR) 0.37, 95% confidence intervals (CI) 0.20 to 0.66) (Analysis 1.1) or macrosomic (three trials, 438 infants, RR 0.38, 95% CI 0.19 to 0.74) (Analysis 1.2) when compared with those born to women in the routine care group. The overall results gave the number needed to treat of 12 (95% CI 9 to 28) for macrosomia and 10 (95% CI 7 to 17) for LGA. One trial reported results for a combined outcome of LGA or macrosomia (Bevier 1999), which suggested a significantly lower incidence of either LGA or macrosomia in the intervention group when compared with routine care group (one trial, 83 infants, RR 0.11, 95% CI 0.02 to 0.84) (Analysis 1.3).
1.1. Analysis.
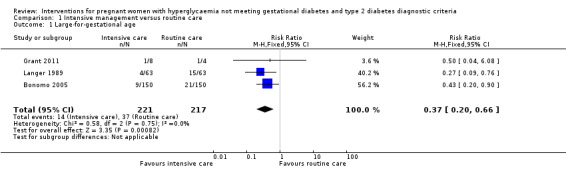
Comparison 1 Intensive management versus routine care, Outcome 1 Large‐for‐gestational age.
1.2. Analysis.
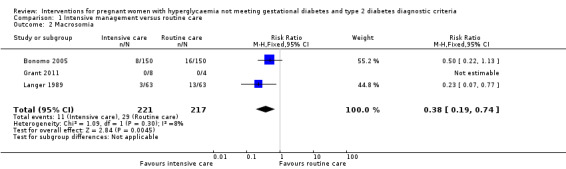
Comparison 1 Intensive management versus routine care, Outcome 2 Macrosomia.
1.3. Analysis.
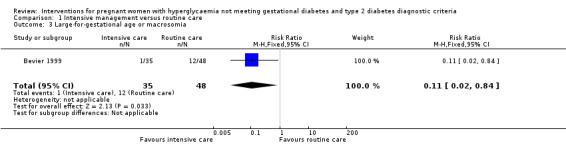
Comparison 1 Intensive management versus routine care, Outcome 3 Large‐for‐gestational age or macrosomia.
Macrosomia was defined as birthweight at least 4000 g in Bonomo 2005 and Grant 2011. Langer 1989 reported 82% of the LGA babies were macrosomic, but the definition of macrosomia was not stated in the published paper. LGA was defined as birthweight ≥ 90th percentile in Bonomo 2005 and Langer 1989;Grant 2011 defined LGA as more than 90th percentile for sex and gestational age. In Bevier 1999, macrosomia and LGA were not clearly defined, and the results were reported as a combination of macrosomia and LGA.
For maternal primary outcomes, there were no significant differences between treatment groups in rates of caesarean section (three trials, 509 women, RR 0.93, 95% CI 0.68 to 1.27) (Analysis 1.4) or operative vaginal birth (one trial, 83 women, RR 1.37, 95% CI 0.20 to 9.27) (Analysis 1.5).
1.4. Analysis.
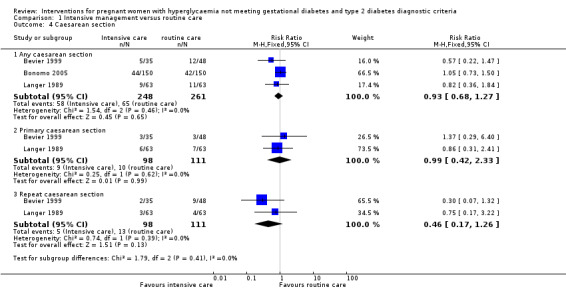
Comparison 1 Intensive management versus routine care, Outcome 4 Caesarean section.
1.5. Analysis.
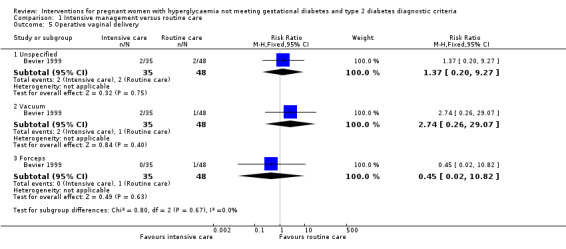
Comparison 1 Intensive management versus routine care, Outcome 5 Operative vaginal delivery.
Secondary outcomes
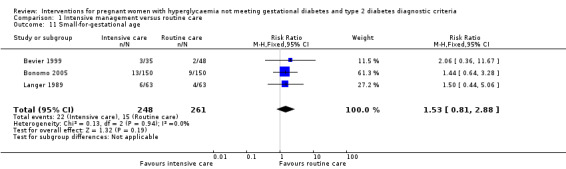
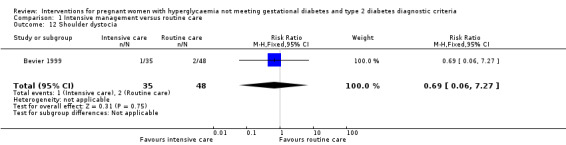
Babies born to women in the intervention group had slightly, but statistically significant, lower birthweight when compared with those born to women in the routine care group (four trials, 521 infants, mean difference (MD) ‐117.33 gram, 95% CI ‐198.72 to ‐35.94) (Analysis 1.6). Results from one trial also suggested that babies in the intervention group had slightly lower Ponderal Index when compared with babies in the routine care group (one trial, 300 infants, MD ‐0.09; 95% CI ‐0.16 to ‐0.02) (Bonomo 2005) (Analysis 1.7). No significant differences were seen in preterm birth (two trials, 138 infants, RR 1.00; 95% CI 0.26 to 3.82) (Analysis 1.8) or gestational age at birth (four trials, 521 infants, MD ‐0.18; 95% CI ‐0.43 to 0.07) (Analysis 1.9). There was no significant difference between the two groups in terms of admission to neonatal intensive care unit (two trials, 426 infants; RR 0.64; 95% CI 0.29 to 1.45) (Analysis 1.10), small for gestational age (three trials, 509 infants, RR 1.53; 95% CI 0.81 to 2.88) (Analysis 1.11) and shoulder dystocia (one trial, 83 infants, RR 0.69; 95% CI 0.06 to 7.27) (Analysis 1.12).
1.6. Analysis.
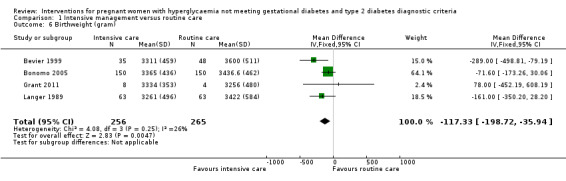
Comparison 1 Intensive management versus routine care, Outcome 6 Birthweight (gram).
1.7. Analysis.
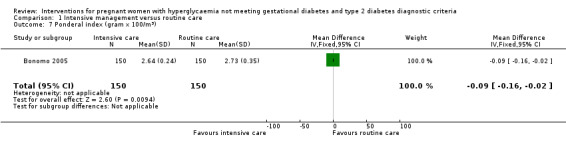
Comparison 1 Intensive management versus routine care, Outcome 7 Ponderal index (gram x 100/m3).
1.8. Analysis.
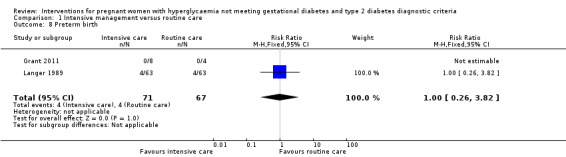
Comparison 1 Intensive management versus routine care, Outcome 8 Preterm birth.
1.9. Analysis.
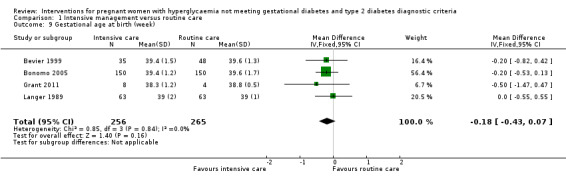
Comparison 1 Intensive management versus routine care, Outcome 9 Gestational age at birth (week).
1.10. Analysis.
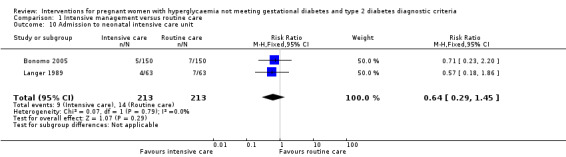
Comparison 1 Intensive management versus routine care, Outcome 10 Admission to neonatal intensive care unit.
1.11. Analysis.
Comparison 1 Intensive management versus routine care, Outcome 11 Small‐for‐gestational age.
1.12. Analysis.
Comparison 1 Intensive management versus routine care, Outcome 12 Shoulder dystocia.
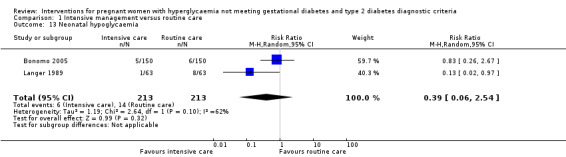
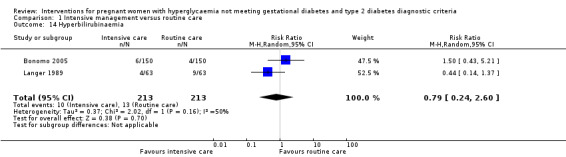
Two studies reported data on neonatal hypoglycaemia and hyperbilirubinaemia (Bonomo 2005; Langer 1989). Bonomo 2005 defined neonatal hypoglycaemia as BGL below 1.7 mmol/L in any two consecutive measurements and defined hyperbilirubinaemia as plasma bilirubin at least 205 μmol/l; while Langer 1989 defined neonatal hypoglycaemia as BGL below 1.94 mmol/L and defined hyperbilirubinaemia as plasma bilirubin at least 670 μmol/l. Substantial heterogeneity was detected for neonatal hypoglycaemia (I² = 62%, T² = 1.19) and hyperbilirubinaemia (I² = 50%, T² = 0.37), hence a random‐effects meta‐analysis was used for each outcome. There was no significant difference seen in the incidences of hypoglycaemia (two trials, 426 infants, RR 0.39; 95% CI 0.06 to 2.54) (Analysis 1.13) and hyperbilirubinaemia (two trials, 426 infants, RR 0.79; 95% CI 0.24 to 2.60) (Analysis 1.14).
1.13. Analysis.
Comparison 1 Intensive management versus routine care, Outcome 13 Neonatal hypoglycaemia.
1.14. Analysis.
Comparison 1 Intensive management versus routine care, Outcome 14 Hyperbilirubinaemia.
There were no data reported on other fetal or neonatal secondary outcomes, and no data reported on childhood or adulthood outcomes.
For maternal secondary outcomes, women receiving interventions were more likely to have their labour induced when compared with women receiving routine care (one trial, 83 women, RR 17.69; 95% CI 1.03 to 304.09) (Analysis 1.15). Two studies reported data on maternal weight gain; however, there was no definition on maternal weight gain given (Bonomo 2005; Langer 1989). No significant difference was seen in weight gain during pregnancy (two trials, 426 women, MD ‐0.63 kg; 95% CI ‐3.07 to 1.81, I²= 83%, T² = 2.60) (Analysis 1.16). Insulin or oral hypoglycaemic agent required for hyperglycaemia was reported in Grant 2011 with data available from 12 women, and there was no statistically significant difference between two groups (RR 1.00; 95% CI 0.30 to 3.32) (Analysis 1.17). Pre‐eclampsia was only reported in Bevier 1999, and no significant difference was seen between two groups (83 women, RR 2.74; 95% CI 0.26 to 29.07) (Analysis 1.18). There were no data available on other maternal perinatal secondary outcomes and women's longer term health outcomes.
1.15. Analysis.
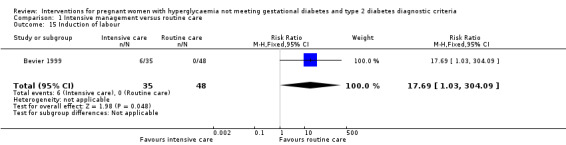
Comparison 1 Intensive management versus routine care, Outcome 15 Induction of labour.
1.16. Analysis.
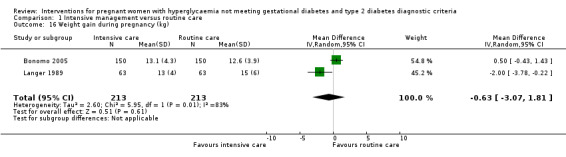
Comparison 1 Intensive management versus routine care, Outcome 16 Weight gain during pregnancy (kg).
1.17. Analysis.
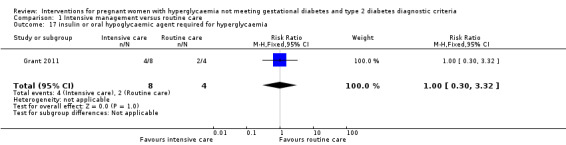
Comparison 1 Intensive management versus routine care, Outcome 17 insulin or oral hypoglycaemic agent required for hyperglycaemia.
1.18. Analysis.
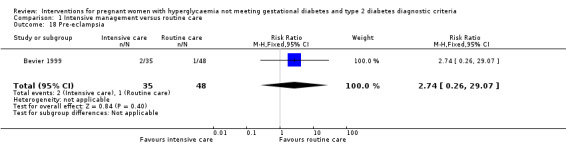
Comparison 1 Intensive management versus routine care, Outcome 18 Pre‐eclampsia.
No trials reported data on health service cost.
Subgroup analyses and sensitivity analyses
Due to the small number of studies included and limited data available, no subgroup analyses and sensitivity analyses were conducted.
Discussion
Summary of main results
In this review, we found that interventions including diet counselling, blood glucose monitoring and insulin therapy for pregnant women with hyperglycaemia not meeting gestational diabetes and type 2 diabetes diagnostic criteria significantly reduced the numbers of macrosomic and LGA babies. However, these benefits may be associated with an increased use of induction of labour for the mother, possibly due to awareness of the diagnosis of pregnancy hyperglycaemia by the attending health professionals.
Overall completeness and applicability of evidence
The evidence for pregnant women with hyperglycaemia not meeting gestational diabetes and type 2 diabetes diagnostic criteria is very incomplete.
The primary outcome of fetal/neonatal mortality was reported in only one pilot study (Grant 2011). There were no data available for maternal and child longer term outcomes and health service cost. With some reported secondary outcomes, including pre‐eclampsia, insulin or oral hypoglycaemic agent required for hyperglycaemia, operative vaginal birth, induction of labour, shoulder dystocia, and ponderal index, evidence was based on data from a single trial.
Due to the small number of studies, moderate to high risk of bias of the included studies and small numbers of participants, the applicability of the current available evidence was limited. We have included only four small trials, with a total of 521 women and their babies in this review. All the four included trials were conducted in Western countries ‐ Canada, Italy, and the United States.
Quality of the evidence
Three of the four included studies had moderate to high risk of bias (Bevier 1999; Bonomo 2005; Langer 1989). One study was with low risk of bias, but it accounted for limited weight in data analysis due to the small sample size of 12 women and babies.
Potential biases in the review process
The definition of the eligible population for this review may be a potential source of bias. We defined the review population as women with pregnancy hyperglycaemia not meeting gestational diabetes mellitus (GDM) and T2DM diagnostic criteria, and diagnostic criteria were defined by each individual trial. Due to the inconsistencies existing in GDM diagnosis around the world, we have included women with various degrees of pregnancy hyperglycaemia and may have included some women who could be diagnosed with GDM when using a different set of criteria.
Two of the four included trials had high risk of bias in incomplete outcome data (Bevier 1999; Bonomo 2005), which may have introduced attrition bias.
Agreements and disagreements with other studies or reviews
This review found that managing women with pregnancy hyperglycaemia not meeting GDM and T2DM diagnotic criteria was effective in reducing fetal overgrowth, without increasing the risks of instrumental birth, preterm birth, small‐for‐gestational age or admission to neonatal intensive care unit. These findings were inconsistent with results from large, well‐designed randomised controlled trials (Crowther 2005; Landon 2009) and another Cochrane review on treatment for women with GDM (Alwan 2009).
The difference in caesarean section rate was not statistically different between the two groups in this review. Similar findings were reported in the Cochrane review (Alwan 2009) and in Crowther 2005. However, a significantly decreased caesarean section rate was found in women treated for GDM in Landon 2009.
In this review, data from a single trial suggested no statistically significant difference in the rate of pre‐eclampsia between women in the two groups (Bevier 1999). Different findings were reported form the previous Cochrane review (Alwan 2009) and the large randomised controlled trials on treatment for women with GDM (Crowther 2005; Landon 2009), where a reduction in the risk of pre‐eclampsia was found by managing women with GDM. The disagreement may result from the limited data included in this review for this outcome measure.
Authors' conclusions
Implications for practice.
This review found interventions for women with pregnancy hyperglycaemia not meeting GDM and T2DM diagnostic criteria helped reduce the number of macrosomic and LGA babies. It is important to note that the results of this review were based on four small randomised trials with moderate to high risk of bias without follow‐up outcomes for women or their babies. Until additional evidence from large well designed randomised trials becomes available, current evidence is insufficient to make conclusive suggestions on management for women with pregnancy hyperglycaemia not meeting GDM and T2DM diagnostic criteria.
Implications for research.
Further larger trials with sufficient power to assess the effects of lifestyle intervention and metabolic monitoring on maternal and infant health outcomes are needed. Outcomes such as longer term health outcomes for women and their babies after being managed for pregnancy hyperglycaemia during pregnancy and health service cost should be included.
What's new
| Date | Event | Description |
|---|---|---|
| 18 April 2012 | Amended | Corrected typographical error in Agreements and disagreements with other studies or reviews. |
Acknowledgements
Thanks to Professor Thomas Wolever for providing additional information and subgroup data.
As part of the pre‐publication editorial process, this review has been commented on by three peers (an editor and two referees who are external to the editorial team) and the Group's Statistical Adviser.
Data and analyses
Comparison 1. Intensive management versus routine care.
| Outcome or subgroup title | No. of studies | No. of participants | Statistical method | Effect size |
|---|---|---|---|---|
| 1 Large‐for‐gestational age | 3 | 438 | Risk Ratio (M‐H, Fixed, 95% CI) | 0.37 [0.20, 0.66] |
| 2 Macrosomia | 3 | 438 | Risk Ratio (M‐H, Fixed, 95% CI) | 0.38 [0.19, 0.74] |
| 3 Large‐for‐gestational age or macrosomia | 1 | 83 | Risk Ratio (M‐H, Fixed, 95% CI) | 0.11 [0.02, 0.84] |
| 4 Caesarean section | 3 | Risk Ratio (M‐H, Fixed, 95% CI) | Subtotals only | |
| 4.1 Any caesarean section | 3 | 509 | Risk Ratio (M‐H, Fixed, 95% CI) | 0.93 [0.68, 1.27] |
| 4.2 Primary caesarean section | 2 | 209 | Risk Ratio (M‐H, Fixed, 95% CI) | 0.99 [0.42, 2.33] |
| 4.3 Repeat caesarean section | 2 | 209 | Risk Ratio (M‐H, Fixed, 95% CI) | 0.46 [0.17, 1.26] |
| 5 Operative vaginal delivery | 1 | Risk Ratio (M‐H, Fixed, 95% CI) | Subtotals only | |
| 5.1 Unspecified | 1 | 83 | Risk Ratio (M‐H, Fixed, 95% CI) | 1.37 [0.20, 9.27] |
| 5.2 Vacuum | 1 | 83 | Risk Ratio (M‐H, Fixed, 95% CI) | 2.74 [0.26, 29.07] |
| 5.3 Forceps | 1 | 83 | Risk Ratio (M‐H, Fixed, 95% CI) | 0.45 [0.02, 10.82] |
| 6 Birthweight (gram) | 4 | 521 | Mean Difference (IV, Fixed, 95% CI) | ‐117.33 [‐198.72, ‐35.94] |
| 7 Ponderal index (gram x 100/m3) | 1 | 300 | Mean Difference (IV, Fixed, 95% CI) | ‐0.09 [‐0.16, ‐0.02] |
| 8 Preterm birth | 2 | 138 | Risk Ratio (M‐H, Fixed, 95% CI) | 1.0 [0.26, 3.82] |
| 9 Gestational age at birth (week) | 4 | 521 | Mean Difference (IV, Fixed, 95% CI) | ‐0.18 [‐0.43, 0.07] |
| 10 Admission to neonatal intensive care unit | 2 | 426 | Risk Ratio (M‐H, Fixed, 95% CI) | 0.64 [0.29, 1.45] |
| 11 Small‐for‐gestational age | 3 | 509 | Risk Ratio (M‐H, Fixed, 95% CI) | 1.53 [0.81, 2.88] |
| 12 Shoulder dystocia | 1 | 83 | Risk Ratio (M‐H, Fixed, 95% CI) | 0.69 [0.06, 7.27] |
| 13 Neonatal hypoglycaemia | 2 | 426 | Risk Ratio (M‐H, Random, 95% CI) | 0.39 [0.06, 2.54] |
| 14 Hyperbilirubinaemia | 2 | 426 | Risk Ratio (M‐H, Random, 95% CI) | 0.79 [0.24, 2.60] |
| 15 Induction of labour | 1 | 83 | Risk Ratio (M‐H, Fixed, 95% CI) | 17.69 [1.03, 304.09] |
| 16 Weight gain during pregnancy (kg) | 2 | 426 | Mean Difference (IV, Random, 95% CI) | ‐0.63 [‐3.07, 1.81] |
| 17 insulin or oral hypoglycaemic agent required for hyperglycaemia | 1 | 12 | Risk Ratio (M‐H, Fixed, 95% CI) | 1.0 [0.30, 3.32] |
| 18 Pre‐eclampsia | 1 | 83 | Risk Ratio (M‐H, Fixed, 95% CI) | 2.74 [0.26, 29.07] |
Characteristics of studies
Characteristics of included studies [ordered by study ID]
Bevier 1999.
| Methods | Randomised controlled trial. | |
| Participants | 103 women with a positive 50 g 1‐hour GCT (> 140 mg/dl) but a negative 100 g 3‐hour OGTT according to the National Diabetes Data Group (NDDG) criteria (see notes). Exclusion criteria: women with evidence of hypertension, collagen disease, chronic renal disease, cardiac or pulmonary disease, Rh sensitisation, or a history of preterm labor or SGA infants. Setting: Santa Barbara, California, USA. |
|
| Interventions |
|
|
| Outcomes | Maternal HbA1c level, pre‐eclampsia, mode of birth, delivery complications (shoulder dystocia, tight nuchal cord, meconium, prolonged labor phase, abnormal fetal heart rate), gestational age at birth, Apgar score at 1 min and 5 min, birthweight, infant haemoglobin, glucose, haematocrit, morbidities, and congenital anomalies. | |
| Notes |
|
|
| Risk of bias | ||
| Bias | Authors' judgement | Support for judgement |
| Random sequence generation (selection bias) | Unclear risk | Described as women were randomly assigned to either experimental or control groups. |
| Allocation concealment (selection bias) | Unclear risk | No information was given on allocation concealment. |
| Blinding of participants and personnel (performance bias) All outcomes | High risk | Prenatal care and deliveries were performed by six obstetricians who were not blinded to the mothers treatment group. Participants were unlikely to be blinded. |
| Blinding of outcome assessment (detection bias) All outcomes | Unclear risk | No information on whether outcome assessors were blinded or not. |
| Incomplete outcome data (attrition bias) All outcomes | High risk |
|
| Selective reporting (reporting bias) | High risk | There was no clear definition on macrosomia. Published data on macrosomia was unclear, and cannot be included in the meta‐analysis of macrosomia. |
| Other bias | Low risk | No obvious risk of other bias. |
Bonomo 2005.
| Methods | Randomised controlled trial. | |
| Participants | 300 Caucasian women with singleton pregnancies, with a positive 50 gram 1‐hour GCT test (≥ 7.8 mmol/l) followed by a normal 100‐gram OGTT according to Carpenter and Coustan's criteria (see notes). Women with one abnormal value at the 100‐gram OGTT or fulfilling Carpenter and Coustan's diagnostic criteria for GDM were excluded. Setting: The Diabetic and Pregnancy Centre of Niguarda Ca’Granda‘ Hospital in Milan, Italy. |
|
| Interventions |
|
|
| Outcomes | Maternal: caesarean section; infant: gestational age at delivery, birthweight, macrosomia (birthweight ≥ 4000 g), LGA (birthweight ≥ 90th centile), SGA (birthweight ≤ 10th centile), ponderal index, hypoglycaemia (any of 2 consecutive blood glucose values < 1.7 mmol/l), hyperbilirubinaemia (plasma values ≥ 205 µmol/l), polycythaemia (haematocrit > 60%), 5‐min Apgar score < 7, admission to neonatal intensive care unit. | |
| Notes |
|
|
| Risk of bias | ||
| Bias | Authors' judgement | Support for judgement |
| Random sequence generation (selection bias) | Unclear risk | Described as randomly assigned to 1 of the 2 study groups, no other information available. |
| Allocation concealment (selection bias) | Unclear risk | No information was given on allocation concealment. |
| Blinding of participants and personnel (performance bias) All outcomes | High risk | All women, and the attending physicians were informed of the results of the GCT and OGTT. It is unclear whether research personnel are blinded from knowledge of group allocation; participants were unlikely to be blinded. |
| Blinding of outcome assessment (detection bias) All outcomes | Unclear risk | No information on whether the outcome assessors were blinded or not. |
| Incomplete outcome data (attrition bias) All outcomes | High risk | Losses to follow‐up (2%): 6 women in the intervention group loss to follow‐up. Post‐randomisation exclusion (5%): 9 women in intervention group and 6 in the control group were excluded due to the diagnosis of GDM at 30‐34 weeks' gestation. All those women were described as "replaced". |
| Selective reporting (reporting bias) | Low risk | No obvious risk of selective reporting. |
| Other bias | Low risk | No obvious risk of other bias. |
Grant 2011.
| Methods | Randomised controlled pilot study. | |
| Participants | 12 pregnant women 18‐45 years of age, diagnosed with impaired glucose tolerance of pregnancy (IGTP) according to Canadian Diabetes Association (CDA) criteria, and who had been referred to the Diabetes in Pregnancy Clinic (DIP), St. Michael's Hospital, Canada. Exclusion criteria: presence of a multiple pregnancy or an acute or chronic illness affecting carbohydrate metabolism; presence of type 1 or type 2 diabetes prior to the current pregnancy; use of insulin treatment prior to providing consent; greater than 34 weeks' gestation; and unable to communicate in English with no translator available. |
|
| Interventions |
|
|
| Outcomes | Primary: fasting serum glucose and HbA1c levels at baseline and 4 weeks; self‐monitored blood glucose level (SMBG) from baseline to week 8. Secondary: serum glucose level, insulin, lipids and C‐reactive protein at baseline and 4 weeks after intervention, maternal dietary intake, physical activity (time, type and duration), birthweight, use of insulin, macrosomia (birthweight ≥ 4000 g), LGA (> 90th percentile population specific), SGA (< 10th percentile population specific). |
|
| Notes |
|
|
| Risk of bias | ||
| Bias | Authors' judgement | Support for judgement |
| Random sequence generation (selection bias) | Unclear risk | Randomisation order was created by 1 of the investigators who was not involved in recruitment. It is unclear how the sequence was generated, but it is likely to be computer‐generated sequence. |
| Allocation concealment (selection bias) | Low risk | Sealed, numbered, opaque envelopes were used, and various block sizes in randomisation were used. |
| Blinding of participants and personnel (performance bias) All outcomes | High risk | Described as an "open‐label" pilot study. |
| Blinding of outcome assessment (detection bias) All outcomes | Unclear risk | No information on whether outcome assessors were blinded. |
| Incomplete outcome data (attrition bias) All outcomes | Low risk | 2 women in the control group withdrew after randomisation, reasons given. |
| Selective reporting (reporting bias) | Low risk | No obvious risk of selective reporting. |
| Other bias | Low risk | There is no obvious risk of other bias. |
Langer 1989.
| Methods | Randomised controlled trial. | |
| Participants | 126 women with a positive 50 g 1‐hour GCT (≥130 mg/dl) and with one abnormal value in 100 g 3‐hour OGTT according to NDDG criteria. Setting: Bronx, New York, USA. |
|
| Interventions |
|
|
| Outcomes | Maternal: gestational age at delivery, weight gain, caesarean section; hypertensive disorders. Infant: birthweight, LGA (birthweight ≥ 90th Centile); SGA (birthweight ≤ 10th centile); preterm birth (< 37 weeks' gestation); hypoglycaemia (BGL < 35 mg/dl or 1.94 mmol/l); hyperbilirubinaemia (bilirubin > 12 mg/dl); hypocalcaemia (calcium < 7.5 mg/dl); polycythemia (central venous hematocrit > 62%); admission to neonatal intensive care unit; respiratory distress syndrome. |
|
| Notes |
|
|
| Risk of bias | ||
| Bias | Authors' judgement | Support for judgement |
| Random sequence generation (selection bias) | Unclear risk | Described as “randomised into treated and untreated groups.” |
| Allocation concealment (selection bias) | Unclear risk | No information was given on allocation concealment. |
| Blinding of participants and personnel (performance bias) All outcomes | High risk | It is unlikely to blind study participants. No information on whether research personnel was blinded or not. |
| Blinding of outcome assessment (detection bias) All outcomes | Unclear risk | No information about whether outcome assessors were blinded. |
| Incomplete outcome data (attrition bias) All outcomes | Low risk | No loss to follow‐up or post randomisation exclusion. |
| Selective reporting (reporting bias) | Low risk | No obvious risk of selective reporting. |
| Other bias | Low risk | No obvious risk of other bias. |
ACOG: American Congress of Obstetricians and Gynecologists ( formerly the American College of Obstetricians and Gynecologists) ADA: American Diabetes Association BGL: blood glucose level GCT: glucose challenge test GDM: gestational diabetes mellitus GI: glycaemic index IGTP: impaired glucose tolerance of pregnancy LGA: large for gestational age NDDG: National Diabetes Data Group OGTT: oral glucose tolerance test
Characteristics of excluded studies [ordered by study ID]
| Study | Reason for exclusion |
|---|---|
| Bung 1993 | Diagnosis of "disturbed carbohydrate metabolism during pregnancy" was based on fasting plasma glucose values but not on OGTT results. |
| Dunne 2001 | No published or unpublished data available. |
| Ford 1997 | Participants were women with GDM as defined by WHO 1980 criteria (2‐hour BGL between 8 mmol/L and 11 mmol/L in 75‐gram OGTT). |
| Li 1987 | Participants were women with GDM according to NDDG criteria and group allocation is based on alternation. |
| Li 1999 | Not a randomised trial, group allocation is based on alternation. |
| Maresh 1983 | Not a randomised trial, group allocation by alternation. |
| Yang 2003 | Participants were women with GDM according to WHO criteria (2‐hour BGL between 7.8 and 11.1 mmol/L in 75‐gram OGTT). |
BGL: blood glucose level GDM: gestational diabetes mellitus NDDG: National Diabetes Data Group OGTT: oral glucose tolerance test
Characteristics of ongoing studies [ordered by study ID]
Crowther 2007.
| Trial name or title | Investigation of dietary and lifestyle advice for women with borderline gestational glucose intolerance (IDEAL study). |
| Methods | Randomised clinical trial. |
| Participants | Pregnant women with a singleton pregnancy, with a positive 50 g OGCT (1‐h BGL ≥ 7.8 mmol/L) and a normal 2‐h 75 g OGTT (fasting BGL < 5.5 mmol/L and 2‐h BGL < 7.8 mmol/L). |
| Interventions | Lifestyle counselling (individualised diet and exercise advice from a registered dietitian based on published recommendations of the Dietitians Association of Australia), BGL monitoring and insulin therapy if necessary. |
| Outcomes | LGA, death or serious health outcome for the infant, other causes of infant morbidity (e.g. macrosomia, SGA, neonatal hypoglycaemia requiring treatment, shoulder dystocia, nerve palsy, bone fracture, preterm birth, Apgar score < 7 at 5 minutes), serious or adverse health outcomes for the women (e.g. maternal death, pre‐eclampsia, caesarean birth, induction of labour, antepartum/ postpartum haemorrhage, weight gain ≥10 kg in pregnancy, need for antenatal hospitalisation ), maternal psychological outcomes and health status, use of hospital services and health costs. |
| Starting date | 2008. |
| Contact information | Caroline.crowther@adelaide.edu.au |
| Notes |
Wolever 2011 [pers comm].
| Trial name or title | |
| Methods | Randomised clinical trial. |
| Participants | Women with GDM and IGTP. |
| Interventions | Low‐glycaemic index diet will be compared with control diet (intermediate‐ and high‐glycaemic index diet). |
| Outcomes | Primary: fasting serum glucose and HbA1c levels at baseline and 4 weeks; self‐monitored blood glucose level from baseline to week 8. |
| Starting date | Not yet recruiting. |
| Contact information | Thomas.wolever@utoronto.ca |
| Notes |
BGL: blood glucose level GDM: gestational diabetes mellitus IGTP: impaired glucose tolerance of pregnancy LGA: large for gestational age OGTT: oral glucose tolerance test SGA: small for gestational age
Differences between protocol and review
A combined outcome of 'large‐for‐gestational age or macrosomia' was added in the review.
Contributions of authors
Shanshan Han wrote drafts of the protocol and review, with Caroline Crowther and Philippa Middleton contributing to data extraction, and commenting on and editing to all drafts.
Sources of support
Internal sources
ARCH, Robinson Institute, The University of Adelaide, Australia.
External sources
Australian Department of Health and Ageing, Australia.
Declarations of interest
None known.
Edited (no change to conclusions)
References
References to studies included in this review
Bevier 1999 {published data only}
- Bevier WC, Fischer R, Jovanovic L. Treatment of women with an abnormal glucose challenge test (but a normal oral glucose tolerance test) decreases the prevalence of macrosomia. American Journal of Perinatology 1999;16:269‐75. [DOI] [PubMed] [Google Scholar]
Bonomo 2005 {published data only}
- Bonomo M, Corica D, Mion E, Gonçalves D, Motta G, Merati R, et al. Evaluating the therapeutic approach in pregnancies complicated by borderline glucose intolerance: a randomized clinical trial. Diabetic Medicine 2005;22(11):1536‐41. [DOI] [PubMed] [Google Scholar]
Grant 2011 {published data only}
- Grant SM, Wolever TMS, O'Connor DL, Nisenbaum R, Josse RG. Effect of a low glycaemic index diet on blood glucose in women with gestational hyperglycaemia. Diabetes Research and Clinical Practice 2011;91(1):15‐22. [DOI] [PubMed] [Google Scholar]
Langer 1989 {published data only}
- Langer O, Anyaegbunam A, Brustman L, Divon M. A prospective randomized study: management of women with one abnormal value (OGTT) reduces adverse outcome in pregnancy. Proceedings of 9th Annual Meeting of the Society of Perinatal Obstetricians; 1989 Feb 1‐4; New Orleans, Louisiana, USA. 1989:11.
- Langer O, Anyaegbunam A, Brustman L, Divon M. Management of women with one abnormal oral glucose tolerance test value reduces adverse outcome in pregnancy. American Journal of Obstetrics and Gynecology 1989;161:593‐9. [DOI] [PubMed] [Google Scholar]
References to studies excluded from this review
Bung 1993 {published data only}
- Bung P, Artal R, Khodiguian N. Regular exercise therapy in disturbed carbohydrate metabolism during pregnancy ‐ results of a prospective randomised longitudinal study. Geburtshilfe und Frauenheilkunde 1993;53:188‐93. [DOI] [PubMed] [Google Scholar]
Dunne 2001 {published data only}
- Dunne FP. Randomized trial of twice daily versus four times daily insulin regimens for the treatment of gestational diabetes and gestationally acquired impaired glucose tolerance. National Research Register (www.nrr.nhs.uk) (accessed 2001).
Ford 1997 {published data only}
- Ford FA, Bruce CB, Fraser RB. Preliminary report of a randomised trial of dietary advice in women with mild abnormalities of glucose tolerance in pregnancy. Personal communication 1997.
Li 1987 {published data only}
- Li DFH, Wong VCW, O'Hoy KMKY, Yeung CY, Ma HK. Is treatment needed for mild impairment of glucose tolerance in pregnancy? A randomized controlled trial. British Journal of Obstetrics and Gynaecology 1987;94:851‐4. [DOI] [PubMed] [Google Scholar]
Li 1999 {published data only}
- Li P, Yang H, Dong Y. Treating women with gestational impaired glucose tolerance reduces adverse outcome of pregnancy. Chung‐Hua Fu Chan Ko Tsa Chih [Chinese Journal of Obstetrics & Gynecology] 1999;34(8):462‐4. [PubMed] [Google Scholar]
Maresh 1983 {published data only}
- Maresh M, Alderson C, Beard RW, Bloxham B, Elkeles RS, Gillmer MDG. Comparison of insulin against diet treatment in the management of abnormal carbohydrate tolerance in pregnancy. Nutrition in pregnancy. Proceedings of 10th Study Group of the RCOG; 1983. London: RCOG, 1983:255‐67.
Yang 2003 {published data only}
- Yang X, Hsu‐Hage B, Dong L, Shao P, Wang H, Tian H, et al. Intensive diabetes management may improve pregnancy outcomes in Chinese gravidas with impaired glucose tolerance. Diabetes Care 2003;26:254‐5. [DOI] [PubMed] [Google Scholar]
References to ongoing studies
Crowther 2007 {published data only}
- Crowther C. Dietary and lifestyle advice for women with borderline gestational glucose intolerance. Australian Clinical Trials Registry (www.actr.org.au) (accessed 21 June 2007) 2007.
Wolever 2011 [pers comm] {unpublished data only}
- Wolever T. Low‐glycaemic index diet compared with control diet (intermediate‐ and high‐glycaemic index diet. Email to S Han May 2011.
Additional references
ACOG 2001
- American College of Obstetricians and Gynecologists Committee on Practice Bulletins‐‐Obstetrics. ACOG Practice Bulletin. Clinical management guidelines for obstetrician‐gynecologists. Number 30, September 2001 (replaces Technical Bulletin Number 200, December 1994). Gestational diabetes. Obstetrics & Gynecology 2001;98(3):525‐38. [PubMed] [Google Scholar]
ADA 2009
- American Diabetes Association. Diagnosis and classification of diabetes mellitus. Diabetes Care 2009;32(Suppl 1):S62‐S67. [DOI] [PMC free article] [PubMed] [Google Scholar]
Alwan 2009
- Alwan N, Tuffnell DJ, West J. Treatments for gestational diabetes. Cochrane Database of Systematic Reviews 2009, Issue 3. [DOI: 10.1002/14651858.CD003395.pub2] [DOI] [PMC free article] [PubMed] [Google Scholar]
Anderberg 2010
- Anderberg E, Källén K, Berntorp K. The impact of gestational diabetes mellitus on pregnancy outcome comparing different cut‐off criteria for abnormal glucose tolerance. Acta Obstetricia et Gynecologica Scandinavica 2010;89(12):1532‐7. [DOI] [PubMed] [Google Scholar]
Barker 1994
- Barker D. Mothers, Babies and Diseases in Later Life. London: BMJ Publishing Group, 1994. [Google Scholar]
Ben‐Haroush 2004
- Ben‐Haroush A, Yogev Y, Hod M. Epidemiology of gestational diabetes mellitus and its association with Type 2 diabetes. Diabetic Medicine 2004;21(2):103‐13. [DOI] [PubMed] [Google Scholar]
Bottalico 2007
- Bottalico JN. Recurrent gestational diabetes: risk factors, diagnosis, management, and implications. Seminars in Perinatology 2007;31(3):176‐84. [DOI] [PubMed] [Google Scholar]
Catalano 2003
- Catalano PM, Thomas A, Huston‐Presley L, Amini SB. Increased fetal adiposity: a very sensitive marker of abnormal in utero development. American Journal of Obstetrics and Gynecology 2003;189(6):1698‐704. [DOI] [PubMed] [Google Scholar]
Chasan‐Taber 2008
- Chasan‐Taber L, Schmidt MD, Pekow P, Sternfeld B, Manson JE, Solomon CG, et al. Physical activity and gestational diabetes mellitus among Hispanic women. Journal of Women's Health 2008;17(6):999‐1008. [DOI] [PubMed] [Google Scholar]
Clapp 2006
- Clapp JF. Effects of diet and exercise on insulin resistance during pregnancy. Metabolic Syndrome and Related Disorders 2006;4(2):84‐90. [DOI] [PubMed] [Google Scholar]
Coustan 2010
- Coustan DR, Lowe LP, Metzger BE, Dyer AR, International Association of Diabetes and Pregnancy Study Groups. The Hyperglycemia and Adverse Pregnancy Outcome (HAPO) study: paving the way for new diagnostic criteria for gestational diabetes mellitus. American Journal of Obstetrics and Gynecology 2010;202(6):654 e1‐6. [DOI] [PMC free article] [PubMed] [Google Scholar]
Crowther 2005
- Crowther CA, Hiller JE, Moss JR, McPhee AJ, Jeffries WS, Robinson JS, Australian Carbohydrate Intolerance Study in Pregnant Women (ACHOIS) Trial Group. Effect of treatment of gestational diabetes mellitus on pregnancy outcomes. New England Journal of Medicine 2005;352(24):2477‐86. [DOI] [PubMed] [Google Scholar]
Cypryk 2008
- Cypryk K, Szymczak W, Czupryniak L, Sobczak M, Lewinski A. Gestational diabetes mellitus ‐ an analysis of risk factors. Endokrynologia Polska (Warszawa) 2008;59(5):393‐97. [PubMed] [Google Scholar]
Dabelea 2000
- Dabelea D, Knowler WC, Pettitt DJ. Effect of diabetes in pregnancy on offspring: follow‐up research in the Pima Indians. Journal of Maternal‐Fetal Medicine 2000;9(1):83‐8. [DOI] [PubMed] [Google Scholar]
Dabelea 2005
- Dabelea D, Snell‐Bergeon JK, Hartsfield CL, Bischoff KJ, Hamman RF, McDuffie RS, Kaiser Permanente of Colorado GDM Screening Program. Increasing prevalence of gestational diabetes mellitus (GDM) over time and by birth cohort: Kaiser Permanente of Colorado GDM Screening Program. Diabetes Care 2005;28(3):579‐84. [DOI] [PubMed] [Google Scholar]
Dabelea 2007
- Dabelea D. The predisposition to obesity and diabetes in offspring of diabetic mothers. Diabetes Care 2007;30(Suppl 2):S169‐S174. [DOI] [PubMed] [Google Scholar]
Devlieger 2008
- Devlieger R, Casteels K, Assche FA. Reduced adaptation of the pancreatic B cells during pregnancy is the major causal factor for gestational diabetes: current knowledge and metabolic effects on the offspring. Acta Obstetricia et Gynecologica Scandinavica 2008;87(12):1266‐70. [DOI] [PubMed] [Google Scholar]
Dodd 2007
- Dodd JM, Crowther CA, Antoniou G, Baghurst P, Robinson JS. Screening for gestational diabetes: the effect of varying blood glucose definitions in the prediction of adverse maternal and infant health outcomes. Australian and New Zealand Journal of Obstetrics and Gynaecology 2007;47(4):307‐12. [DOI] [PubMed] [Google Scholar]
Egger 1997
- Egger M, Davey Smith G, Schneider M, Minder C. Bias in meta‐analysis detected by a simple, graphical test. BMJ 1997;315(7109):629‐34. [DOI] [PMC free article] [PubMed] [Google Scholar]
Esakoff 2009
- Esakoff TF, Cheng YW, Sparks TN, Caughey AB. The association between birthweight 4000g or greater and perinatal outcomes in patients with and without gestational diabetes mellitus. American Journal of Obstetrics and Gynecology 2009;200(6):672.e1‐672.e4. [DOI] [PubMed] [Google Scholar]
Ferrara 2007
- Ferrara A. Increasing prevalence of gestational diabetes mellitus: a public health perspective. Diabetes Care 2007;30(Suppl 2):S141‐S146. [DOI] [PubMed] [Google Scholar]
Forman 2005
- Forman MR, Cantwell MM, Ronckers C, Zhang Y. Through the looking glass at early‐life exposures and breast cancer risk. Cancer Investigation 2005;23(7):609‐24. [DOI] [PubMed] [Google Scholar]
Guerrero‐Romero 2010
- Guerrero‐Romero F, Aradillas‐García C, Simental‐Mendia LE, Monreal‐Escalante E, Cruz Mendoza E, Rodríguez‐Moran M. Birth weight, family history of diabetes, and metabolic syndrome in children and adolescents. Journal of Pediatrics 2010;156(5):719‐23. [DOI] [PubMed] [Google Scholar]
Harbord 2006
- Harbord RM, Egger M, Sterne JA. A modified test for small‐study effects in meta‐analyses of controlled trials with binary endpoints. Statistics in Medicine 2006;25(20):3443‐57. [DOI] [PubMed] [Google Scholar]
Harder 2009
- Harder T, Roepke K, Diller N, Stechling Y, Dudenhausen JW, Plagemann A. Birth weight, early weight gain, and subsequent risk of type 1 diabetes: systematic review and meta‐analysis. American Journal of Epidemiology 2009;169(12):1428‐36. [DOI] [PubMed] [Google Scholar]
Henriksen 2008
- Henriksen T. The macrosomic fetus: a challenge in current obstetrics. Acta Obstetricia et Gynecologica Scandinavica 2008;87(2):134‐45. [DOI] [PubMed] [Google Scholar]
Higgins 2011
- Higgins JPT, Green S, editors. Cochrane Handbook for Systematic Reviews of Interventions Version 5.1.0 [updated March 2011 ]. The Cochrane Collaboration, 2011. Available from www.cochrane‐handbook.org.
Hillier 2007
- Hillier TA, Pedula KL, Schmidt MM, Mullen JA, Charles MA, Pettitt DJ. Childhood obesity and metabolic imprinting: the ongoing effects of maternal hyperglycemia. Diabetes Care 2007;30(9):2287‐92. [DOI] [PubMed] [Google Scholar]
Hoffman 1998
- Hoffman L, Nolan C, Wilson JD, Oats JJ, Simmons D. Gestational diabetes mellitus‐‐management guidelines. The Australasian Diabetes in Pregnancy Society. Medical Journal of Australia 1998;169(2):93‐7. [DOI] [PubMed] [Google Scholar]
Horvath 2010
- Horvath K, Koch K, Jeitler K, Matyas E, Bender R, Bastian H, et al. Effects of treatment in women with gestational diabetes mellitus: systematic review and meta‐analysis. BMJ 2010;340:c1395. [DOI: 10.1136/bmj.c1395; PUBMED: 20360215] [DOI] [PMC free article] [PubMed] [Google Scholar]
IADPSG 2010
- International Association of Diabetes and Pregnancy Study Groups Consensus Panel, Metzger BE, Gabbe SG, Persson B, Buchanan TA, Catalano PA, Damm P, et al. International association of diabetes and pregnancy study groups recommendations on the diagnosis and classification of hyperglycaemia in pregnancy. Diabetes Care 2010;33(3):676‐82. [DOI] [PMC free article] [PubMed] [Google Scholar]
IOM 2009
- Rasmussen KM, Yaktine AL, Institute of Medicine (US) and National Research Council (US) Committee to Reexamine IOM Pregnancy Weight Guidelines. Weight Gain During Pregnancy: Reexamining the Guidelines. Washington, DC: National Academies Press, 2009. [PubMed] [Google Scholar]
Jastrow 2010
- Jastrow N, Roberge S, Gauthier RJ, Laroche L, Duperron L, Brassard N, et al. Effect of birth weight on adverse obstetric outcomes in vaginal birth after cesarean delivery. Obstetrics & Gynecology 2010;115(2 Pt 1):338‐43. [DOI] [PubMed] [Google Scholar]
Ju 2008
- Ju H, Rumbold AR, Willson KJ, Crowther CA. Borderline gestational diabetes mellitus and pregnancy outcomes. BMC Pregnancy and Childbirth 2008;8:31. [DOI: 10.1186/1471-2393-8-31] [DOI] [PMC free article] [PubMed] [Google Scholar]
Kim 2002
- Kim C, Newton KM, Knopp RH. Gestational diabetes and the incidence of type 2 diabetes: a systematic review. Diabetes Care 2002;25:1862‐8. [DOI] [PubMed] [Google Scholar]
Landon 2009
- Landon MB, Spong CY, Thom E, Carpenter MW, Ramin SM, Casey B, et al. A multicenter, randomised trial of treatment for mild gestational diabetes. New England Journal of Medicine 2009;361(14):1339‐48. [DOI] [PMC free article] [PubMed] [Google Scholar]
Landon 2010
- Landon MB. Is there a benefit to the treatment of mild gestational diabetes mellitus?. American Journal of Obstetrics and Gynecology 2010;202(6):649‐53. [DOI] [PubMed] [Google Scholar]
Langer 2005
- Langer O, Yogev Y, Most O, Xenakis EM. Gestational diabetes: the consequences of not treating. American Journal of Obstetrics and Gynecology 2005;192(4):989‐97. [DOI] [PubMed] [Google Scholar]
McFarland 1998
- McFarland MB, Trylovich CG, Langer O. Anthropometric differences in macrosomic infants of diabetic and nondiabetic mothers. Journal of Maternal‐Fetal Medicine 1998;7(6):292‐5. [DOI] [PubMed] [Google Scholar]
Metzger 1998
- Metzger BE, Coustan DR. Summary and recommendations of fourth international workshop‐conference on gestational diabetes mellitus. Diabetes Care 1998;21(Suppl 2):B161‐B167. [PubMed] [Google Scholar]
Metzger 2007
- Metzger BE, Buchanan TA, Coustan DR, Leiva A, Dunger DB, Hadden DR, et al. Summary and recommendations of the Fifth International Workshop‐Conference on Gestational Diabetes Mellitus. Diabetes Care 2007;30(Suppl 2):S251‐S260. [DOI] [PubMed] [Google Scholar]
Metzger 2008
- HAPO Study Cooperative Research Group, Metzger BE, Lowe LP, Dyer AR, Trimble ER, Chaovarindr U, Coustan DR, et al. Hyperglycemia and adverse pregnancy outcomes. New England Journal of Medicine 2008;358(19):1991‐2002. [DOI] [PubMed] [Google Scholar]
Morisset 2010
- Morisset AS, St‐Yves A, Veillette J, Weisnagel SJ, Tchernof A, Robitaille J. Prevention of gestational diabetes mellitus: a review of studies on weight management. Diabetes/Metabolism Research and Reviews 2010;26(1):17‐25. [DOI] [PubMed] [Google Scholar]
Morrison 2008
- Morrison JA, Friedman LA, Wang P, Glueck CJ. Metabolic syndrome in childhood predicts adult metabolic syndrome and type 2 diabetes mellitus 25 to 30 years later. Journal of Pediatrics 2008;152(2):201‐6. [DOI] [PubMed] [Google Scholar]
Mulla 2010
- Mulla WR, Henry TQ, Homko CJ. Gestational diabetes screening after HAPO: has anything changed?. Current Diabetes Reports 2010;10(3):224‐8. [DOI] [PubMed] [Google Scholar]
NICE 2008
- National Institute for Health and Clinical Excellence (NICE). Diabetes in pregnancy: management of diabetes and its complications from pre‐conception to the postnatal period. NICE clinical guideline 63. London: NICE, 2008. [Google Scholar]
Ornoy 2005
- Ornoy A. Growth and neurodevelopmental outcome of children born to mothers with pregestational and gestational diabetes. Pediatric Endocrinology Reviews 2005;3(2):104‐13. [PubMed] [Google Scholar]
Petitt 1985
- Petitt DJ, Bennett PH, Knowler WC, Baird HR, Aleck KA. Gestational diabetes mellitus and impaired glucose tolerance during pregnancy. Long‐term effects on obesity and glucose tolerance in the offspring. Diabetes 1985;34(Suppl 2):119‐22. [DOI] [PubMed] [Google Scholar]
Petry 2010
- Petry CJ. Gestational diabetes: risk factors and recent advances in its genetics and treatment. British Journal of Nutrition 2010;104(6):775‐87. [DOI] [PubMed] [Google Scholar]
Pettitt 1983
- Pettitt DJ, Baird HR, Aleck KA, Bennett PH, Knowler WC. Excessive obesity in offspring of Pima Indian women with diabetes during pregnancy. New England Journal of Medicine 1983;308(5):242‐5. [DOI] [PubMed] [Google Scholar]
Ragnarsdottir 2010
- Ragnarsdottir LH, Conroy S. Development of macrosomia resulting from gestational diabetes mellitus: physiology and social determinants of health. Advances in Neonatal Care 2010;10(1):7‐12. [DOI] [PubMed] [Google Scholar]
Reece 2009
- Reece EA, Leguizamón G, Wiznitzer A. Gestational diabetes: the need for a common ground. Lancet 2009;373(9677):1789‐97. [DOI] [PubMed] [Google Scholar]
RevMan 2011 [Computer program]
- The Nordic Cochrane Centre, The Cochrane Collaboration. Review Manager (RevMan). Version 5.1. Copenhagen: The Nordic Cochrane Centre, The Cochrane Collaboration, 2011.
Rizzo 1997
- Rizzo TA, Metzger BE, Dooley SL, Cho NH. Early malnutrition and child neurobehavioral development: insights from the study of children of diabetic mothers. Child Development 1997;68(1):26‐38. [PubMed] [Google Scholar]
Rumbold 2006
- Rumbold AR, Crowther CA, Haslam RR, Dekker GA, Robinson JS, ACTS Study Group. Vitamins C and E and the risks of preeclampsia and perinatal complications. New England Journal of Medicine 2006;354(17):1796‐806. [DOI] [PubMed] [Google Scholar]
Sacks 2009
- Sacks DA. Gestational diabetes ‐ whom do we treat?. New England Journal of Medicine 2009;361(14):1396‐8. [DOI] [PubMed] [Google Scholar]
Sermer 1998
- Sermer M, Naylor CD, Farine D, Kenshole AB, Ritchie JW, Gare DJ, et al. The Toronto Tri‐Hospital Gestational Diabetes Project: a preliminary review. Diabetes Care 1998;21(Suppl 2):B33‐B42. [PubMed] [Google Scholar]
Silva 2010
- Silva JC, Pacheco C, Bizato J, Souza BV, Ribeiro TE, Bertini AM. Metformin compared with glyburide for the management of gestational diabetes. International Journal of Gynecology & Obstetrics 2010;111(1):37‐40. [DOI] [PubMed] [Google Scholar]
Silverman 1995
- Silverman BL, Metzger BE, Cho NH, Loeb CA. Impaired glucose tolerance in adolescent offspring of diabetic mothers. Relationship to fetal hyperinsulinism. Diabetes Care 1995;18(5):611‐7. [DOI] [PubMed] [Google Scholar]
Simmons 2004
- Simmons D, Walters BN, Rowan JA, McIntyre HD. Metformin therapy and diabetes in pregnancy. Medical Journal of Australia 2004;180(9):462‐4. [PubMed] [Google Scholar]
Slining 2010
- Slining M, Adair LS, Goldman BD, Borja JB, Bentley M. Infant overweight is associated with delayed motor development. Journal of Pediatrics 2010;157(1):20‐5. [DOI] [PMC free article] [PubMed] [Google Scholar]
Soler 1978
- Soler NG, Soler SM, Malins JM. Neonatal morbidity among infants of diabetic mothers. Diabetes Care 1978;1(6):340‐50. [DOI] [PubMed] [Google Scholar]
Solomon 1997
- Solomon CG, Willett WC, Carey VJ, Rich‐Edwards J, Hunter DJ, Colditz GA, et al. A prospective study of pregravid determinants of gestational diabetes mellitus. JAMA 1997;278(13):1078‐83. [PubMed] [Google Scholar]
Stamilio 2004
- Stamilio DM, Olsen T, Ratcliffe S, Sehdev HM, Macones GA. False‐positive 1‐hour glucose challenge test and adverse perinatal outcomes. Obstetrics & Gynecology 2004;103(1):148‐56. [DOI] [PubMed] [Google Scholar]
Vohr 1997
- Vohr BR, McGarvey ST. Growth patterns of large‐for‐gestational‐age and appropriate‐for‐gestational‐age infants of gestational diabetic mothers and control mothers at age 1 year. Diabetes Care 1997;20(7):1066‐72. [DOI] [PubMed] [Google Scholar]
Vohr 1999
- Vohr BR, McGarvey ST, Tucker R. Effects of maternal gestational diabetes on offspring adiposity at 4‐7 years of age. Diabetes Care 1999;22(8):1284‐91. [DOI] [PubMed] [Google Scholar]
Whincup 2008
- Whincup PH, Kaye SJ, Owen CG, Huxley R, Cook DG, Anazawa S, et al. Birth weight and risk of type 2 diabetes: a systematic review. JAMA 2008;300(24):2886‐97. [DOI] [PubMed] [Google Scholar]
WHO 1999
- World Health Organization. Definition, Diagnosis and Classification of Diabetes Mellitus and its Complications. Report of a WHO Consultation. Part 1. Geneva: WHO, 1999. [Google Scholar]
Yogev 2009
- Yogev Y, Visser GH. Obesity, gestational diabetes and pregnancy outcome. Seminars in Fetal and Neonatal Medicine 2009;14(2):77‐84. [DOI] [PubMed] [Google Scholar]
Zhang 2006
- Zhang C, Liu S, Solomon CG, Hu FB. Dietary fiber intake, dietary glycemic load, and the risk for gestational diabetes mellitus. Diabetes Care 2006;29(10):2223‐30. [DOI] [PubMed] [Google Scholar]