Abstract
Background:
In 2015, the Massachusetts Department of Public Health (MDPH) adopted a Title V maternal and child health priority to “promote health and racial equity by addressing racial justice and reducing disparities.” A survey assessing staff capacity to support this priority identified data collection and use as opportunities for improvement. In response, MDPH initiated a quality improvement project to improve use of data for action to promote racial equity.
Methods:
MDPH conducted value stream mapping to understand existing processes for using data to inform racial equity work. Key informant interviews and a survey of program directors identified challenges to using data to promote racial equity. MDPH used a cause-and-effect diagram to identify and organize challenges to using data to inform racial equity work and better understand opportunities for improvement and potential solutions.
Results:
Key informants highlighted the need to consider structural factors and historical and community contexts when interpreting data. Program directors noted limited staff time, lack of performance metrics, competing priorities, low data quality, and unclear expectations as challenges. To address the identified challenges, the team identified potential solutions and prioritized development and piloting of the MDPH Racial Equity Data Road Map (Road Map).
Conclusions:
The Road Map framework provides strategies for data collection and use that support the direction of actionable data-driven resources to racial inequities. The Road Map is a resource to support programs to authentically engage communities; frame data in the broader contexts that impact health; and design solutions that address root causes. With this starting point, public health systems can work toward creating data-driven programs and policies to improve racial equity.
Keywords: health equity, Lean Six Sigma, quality improvement, racism, root cause analysis, structural racism
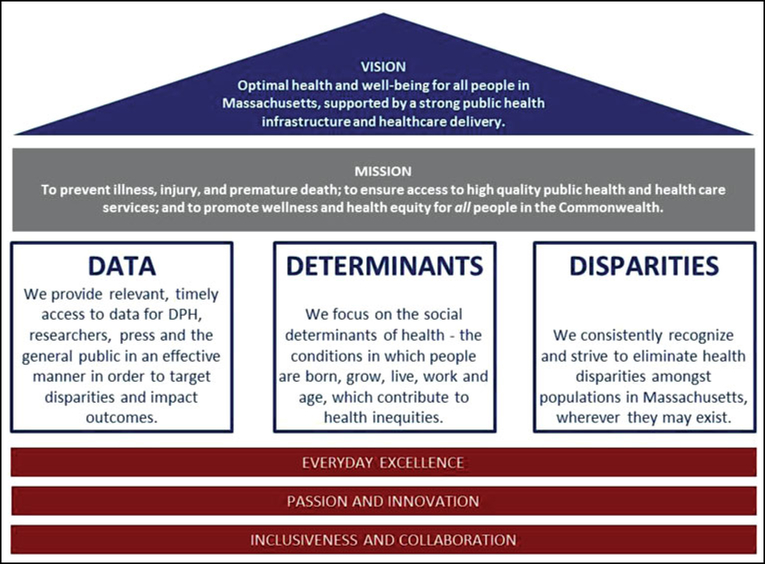
The mission of the Massachusetts Department of Public Health (MDPH) is to ensure that all residents of the Commonwealth achieve their best health. The “MDPH House” (Figure 1) represents the Department’s foundation for the vision of achieving optimal health for all residents. Core drivers of this work include using data effectively, addressing the social determinants of health, and committing to eliminate health inequities. The MDPH House is built on MDPH’s foundational principles of Everyday Excellence, Passion and Innovation, Inclusiveness, and Collaboration to ensure that the MDPH workforce is trained and supported to develop and integrate creative solutions to complex policy issues and population health strategies. MDPH has made an explicit commitment to addressing structural and institutional racism and dismantling systems and policies that advantage White people and oppress Black, Indigenous, and People of Color. This commitment is operationalized through the MDPH Racial Equity Movement. The cross-department Movement responds to the need to improve the public health workforce’s capacity to promote racial equity within MDPH, its programs, and the community. MDPH staff are developing tools and resources to identify and address institutional racism within core elements of public health work, such as community engagement, procurement, and data collection and analysis.
FIGURE 1.
“House” of Massachusetts Department of Public Health
Abbreviation: DPH, Department of Public Health.
In support of the MDPH mission and in response to findings from a comprehensive statewide needs assessment, in 2015, MDPH selected a Title V Maternal and Child Health Services Block Grant1 state priority to “promote health and racial equity across all Maternal and Child Health domains by addressing racial justice and reducing disparities.”Promoting racial equity means creating and reinforcing policies, attitudes, and actions for equitable power, access, opportunities, treatment, and outcomes for all people, regardless of race or ethnicity.2,3 The goal is to improve health outcomes and eliminate inequities between people of different races and ethnicities. In 2017, the state Title V program surveyed staff to assess capacity to support racial equity work. Highlighted as areas for improvement were data collection and use—only 45% of respondents agreed that their program uses data to inform racial equity work and only 16% reported that their program uses benchmarks, metrics, or indicators for measuring success in this work. In response, a team of epidemiologists conducted a quality improvement (QI) project to define and reform the process of using data to promote racial equity. It is critical to examine the role that data can have in perpetuating and failing to address structural racism and health inequities.
In this report, we describe the QI project and the development of a Racial Equity Data Road Map (Road Map) as a framework and resource to assist programs in using data to advance racial equity and end structural racism.
Quality Improvement Project
Defining the problem and identifying improvement opportunities
A team of epidemiologists undertook a QI project to improve how data are used to promote racial equity at MDPH. The team participated in a Lean Six Sigma green belt course conducted by the MDPH Office of Performance Management and Quality Improvement, which used the DMAIC (Define, Measure, Analyze, Improve, Control)4 framework to guide the improvement project. The team first developed a value stream map5 to understand existing processes at MDPH for using data to identify, contextualize, and address racial inequities in health outcomes and start to identify areas for improvement. The team then interviewed MDPH key informants to review and provide feedback on the value stream map and surveyed maternal and child health program directors to identify challenges to using data for action to promote racial equity across programs. The team documented and prioritized potential solutions using a QI tool called a cause-and-effect diagram with the addition of cards (CEDAC).6 These steps are detailed in the following text.
Value stream mapping and key informant interviews
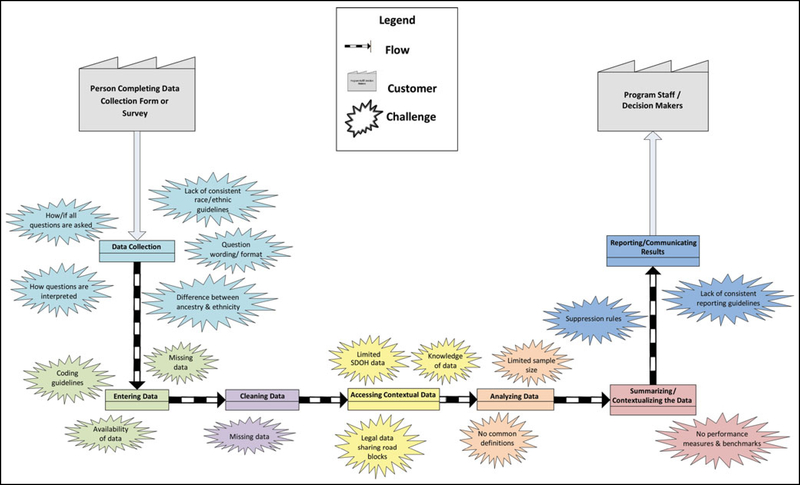
The team visually depicted the existing process of using data to inform racial equity work in a value stream map. The process started with data collection and ended with reporting and communicating results to program staff and decision makers. The team reviewed the entire process to pinpoint problem areas, such as lack of standardization, inefficiencies, and bottlenecks, which were depicted on the value stream map using starburst symbols. The draft value stream map was shared with internal, MDPH subject matter experts during key informant interviews to further identify areas in need of improvement (see final map, Figure 2) and brainstorm potential solutions. Key informants (4 individuals, including the Title V Director and the Director of the Office of Data Translation in the Bureau of Family Health and Nutrition [BFHN], and 5 groups, including the BFHN Racial Equity Steering Team and epidemiologists from BFHN and the Bureau of Community Health and Prevention) highlighted the need to consider structural factors and historical and community contexts when interpreting and sharing data.
FIGURE 2.
Value Stream Map of the Process of Using Data for Racial Equity Work at the Massachusetts Department of Public Health, 2018
Abbreviation: SDOH, social determinants of health.
Survey of program directors
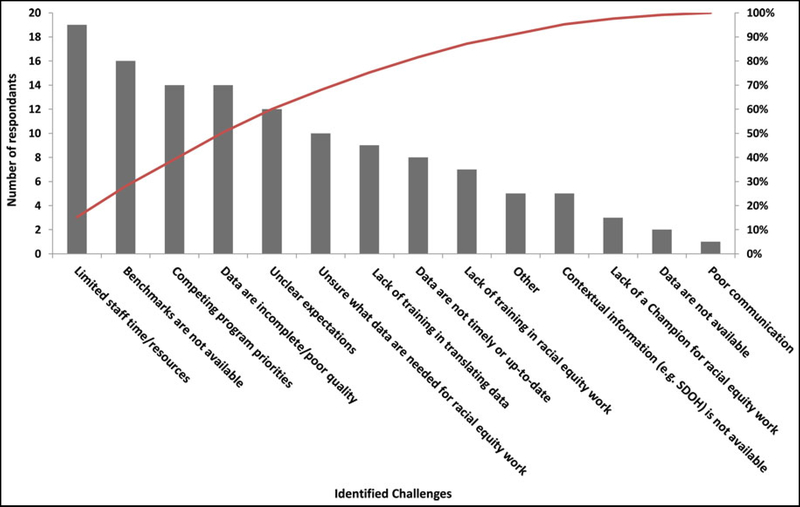
Following the key informant interviews, the team designed a questionnaire and surveyed program directors within BFHN, the lead Bureau for Title V, to uncover barriers or challenges to using data to inform racial equity work. Of 30 program directors, 29 completed the survey (97% response rate). Challenges to using data to inform racial equity work were identified through responses to the following categorical question with 14 response options: “What challenges do you have using data to inform racial equity work in your program? Select all that apply.” Respondents represented programs with access to varying types of data (including data on program reach, enrollment and participation data, program outcomes, etc). The identified challenges were included in a Pareto chart,7 a bar chart that orders categories so that they are ordered from the largest number of occurrences to the smallest in order to identify the most frequently occurring challenges that can be the focus of improvement projects.
Program directors identified several challenges to using data to promote racial equity including limited staff time/resources (95%), lack of benchmarks and performance metrics (80%), competing priorities (70%), incomplete/poor quality data (70%), and unclear expectations (60%) (Figure 3). The Pareto principle7 is a commonly used rule of thumb in QI work, which posits that 80% of the problems in a process can be attributed to 20% of the drivers. However, this was not the case in our analysis, and the Pareto results indicated that the challenges to using data for racial equity work were multiple.
FIGURE 3.
Pareto Chart Summarizing Program Director Survey Responses Regarding Challenges to Using Data to Inform Racial Equity Work in Their Programs at the Massachusetts Department of Public Health, 2018
Abbreviation: SDOH, social determinants of health.
Organizing identified challenges, root causes, and potential solutions
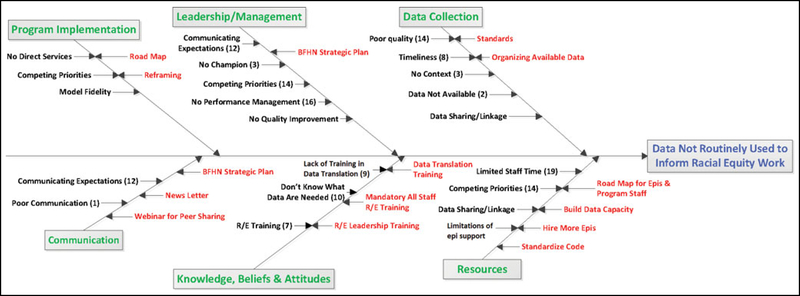
To organize identified challenges to using data to inform racial equity work and better understand opportunities for improvement and map potential solutions, the team used a CEDAC. The challenges identified by key informant interviews and survey respondents were organized into the following emergent themes: program implementation, communication, leadership/management, knowledge/beliefs/attitudes, data collection, and resources. The team then brainstormed ways to address the identified root causes and added them to the final CEDAC (Figure 4). The team prioritized potential solutions that were most feasible to address in an improvement project and decided to develop a collection of guiding questions, tools, and resources organized within a framework (a road map) for using data to inform racial equity work. This solution would address several identified challenges depicted in the Pareto chart including limited staff time/resources, competing priorities, incomplete data, unclear expectations, unsure what data are needed, and lack of training.
FIGURE 4.
Cause and Effect Diagram With the Addition of Cards (CEDAC): Mapping the Challenges and Potential Solutions Identified in Key Informant Interviews and Program Director Survey, Massachusetts Department of Public Health, 2018a,b
Abbreviations: BFHN, Bureau of Family Health and Nutrition; Epi, epidemiologist; R/E, racial equity.
aIf mentioned by more than 1 respondent, the number of times a challenge was mentioned is listed in parentheses. Challenges are listed on the left side of the line for each category and potential solutions are listed on the right side of the line.
bData were obtained through key informant interviews (4 individuals and 5 groups) and a survey of 30 program directors (response rate 97%).
Development of the draft/pilot road map
The purpose of the road map was to provide public health program staff with a framework and resources to overcome barriers and guide the use of data to inform racial equity work. Data for racial equity work vary on the basis of the question a program wants to answer or the issue it wants to address, such as an inequity in a program performance measure or health outcome. The team organized the road map into a series of 7 “stops.” Focusing initially on data related to program performance measures, the first stop was to determine whether the data were complete enough to use with confidence, defined by the team as having less than 10% missing. If not, the team recommended a “continuous quality improvement detour” (CQI detour) to focus on improving the quality of the data before moving forward. If the data were sufficiently complete, the next step was to stratify the data by race and ethnicity to assess inequities in achievement of program performance measures. If inequities were identified,the next step was to determine which inequities were most striking and select one for further exploration. The team recommended using additional data sources to contextualize the environment in which the inequity exists. The next stop was summarization of the identified inequity with contextual information in a data brief, or “Equity Spotlight.” The team recommended sharing the brief with program staff and stakeholders to inform development of interventions to address the inequity that could be implemented through CQI projects and rapid cycle tests of change.
Pilot testing the draft road map
The team piloted the road map with Welcome Family, a home visiting program within the Massachusetts Maternal and Infant Early Childhood Home Visiting Program. Welcome Family is a universal, short-term nurse home visiting program for families with newborns in 5 Massachusetts communities. Welcome Family was well positioned to pilot the road map because it had an established Learning Collaborative, and the community-based Welcome Family programs were well practiced at using program data to identify improvement opportunities and conducting QI projects. The team worked through the road map stops; in collaboration with state-level Welcome Family staff, the team developed Equity Spotlights highlighting racial and ethnic inequities in a program performance measure. Local Welcome Family programs used the Equity Spotlights to engage community stakeholders in root cause analyses to determine what might be driving the observed inequities and then brainstormed potential solutions.
For example, one local Welcome Family program identified lower home visit completion among Hispanic parents of newborns than among non-Hispanic parents. The program first conducted the root cause analysis as a team, focusing on systems and structures—such as community history, cultural beliefs, and staff language capacity—rather than individual behavior as the contributors to inequities in this performance measure. The program then met with other organizations in their community (eg, a grassroots organization serving Latino families) to share what they had brainstormed as a team and seek additional input on the causes of the identified problem and other data or information about community needs and assets that would help contextualize the inequity.
Afterward, the local Welcome Family program used a CEDAC to map the problem statement and identified root causes and began identifying solutions to address the root causes. Instead of attributing low home visit completion to individual behaviors such as the family’s failure to return a phone call to schedule the visit, the program identified factors influenced by structural factors and historical and community contexts such as family legal status, lack of trust in the health care system, or the program’s limited budget for interpreters as potential root causes for differences in home visiting completion, limiting the ability of the program to reach this population. This pilot project led to a decision by MDPH to increase the annual budgets of all 5 local Welcome Family programs to include funding specifically for interpreter services and translation.
Expanding and Sharing the Work
At the conclusion of the Lean Six Sigma green belt course, the team had developed an outline of the Road Map and completed the short-term pilot with Welcome Family. Next, the team engaged others from MDPH, including staff from the Offices of Health Equity and Performance Management and Quality Improvement, and epidemiologists from other bureaus with experience in racial equity work, to join an implementation team (the Racial Equity Strategic Pathway Implementation Team, RESPIT). The goal was further refining and expanding the Road Map and incorporating lessons learned from the Welcome Family pilot.
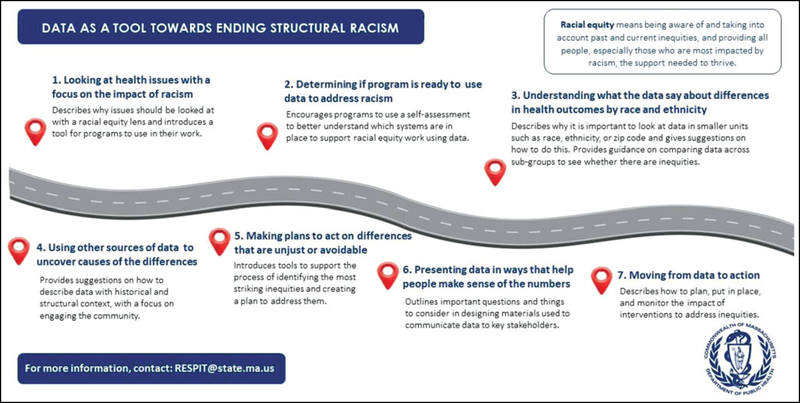
RESPIT met biweekly for 2 years, compiling a glossary of foundational racial equity terms and phrases, developing a program data readiness assessment, and gathering tools that could be used by programs in their own racial equity work, including tools developed by staff within MDPH as part of the Racial Equity Movement and other equity-adapted versions of commonly used QI tools (eg, the Model for Improvement8 and SMARTIE aims9). RESPIT’s product was The Racial Equity Data Road Map: Data as a Tool Toward Ending Structural Racism (the “Road Map”) that is divided into 7 sections detailing how programs, organizations, and institutions can collect, analyze, and use data through a racial equity lens (Figure 5). The 7 sections are as follows: (1) looking at health issues with a focus on the impact of racism; (2) determining whether the program is ready to use data to address racism; (3) understanding what the data say about differences in health outcomes by race and ethnicity; (4) using other sources of data to uncover causes of the differences; (5) making plans to act on differences that are unjust or avoidable; (6) presenting data in ways that help people make sense of the numbers; and (7) moving from data to action.
FIGURE 5.
Racial Equity Data Road Map One-Page Graphic Overview
Used with permission.
The Road Map is adaptable to the structure of a particular program or the health issue being addressed. It is not a checklist or one-size-fits-all approach. Instead, it is a living document that outlines several steps for using data as a tool toward ending structural racism. As such, while sections are presented linearly, they do not need to be followed sequentially and the Road Map does not need to be used in its entirety to effect change. Instead, users of the Road Map can move through the document at the pace and manner that make the most sense for the program or issue being addressed, taking into consideration funding requirements, approval processes, and decision-making structures as needed.
Discussion and Conclusion
The development and implementation of the Road Map are examples of MDPH staff operationalizing the core values and foundational principles depicted in the “MDPH House.” MDPH staff, informed by data from the survey of Title V staff, identified a need to improve how programs use data to achieve the Department’s mission of achieving optimal health for all residents. MDPH staff embarked on a focused QI project to improve the use of data to inform racial equity work in MDPH programs and expanded this into the development of a resource with broad applicability that can be used by other jurisdictions and organizations to guide how they use data to inform their own racial equity efforts. With the Road Map as a starting point, public health agencies can create data-driven programs and policies to improve health equity.
The Road Map was developed to address many of the challenges to using data to inform racial equity work that were identified during the Lean Six Sigma project, but it does not address all of them. Programs interested in using the Road Map will each have differing knowledge, resources, and capacity to collect and use data to promote racial equity. The Program Data Readiness Assessment in Section 2 of the Road Map is intended to help programs assess their ability to collect and use data to promote racial equity and identify gaps in knowledge, resources, and capacity related to data readiness. This section of the Road Map also presents transition tools that programs can use to build readiness for data-driven racial equity work and maximize efficiency and effectiveness while they use the Road Map.
Implementing the Road Map in its entirety by completing all 7 sections could be a difficult undertaking for many programs. While the sections are presented in a way that we hope is easy to follow, there is no set order in which they must be followed. Instead, users of the Road Map can move through the document at the pace and in the manner that make the most sense for the program or issue being addressed, taking into consideration funding requirements, approval processes, and decision-making structures as needed. The Road Map offers a flexible framework for programs to take concrete steps toward addressing the root causes of racial inequities and achieve measurable outcomes, as was demonstrated by the Welcome Family program that was able to secure funding for translation services as a result of their work using the Road Map.
The Road Map is a living document that will be updated on the basis of feedback from its users. Information and lessons learned from the Welcome Family pilot experience informed the development of the first version of the Road Map. As additional programs, both internal and external to MDPH, implement the Road Map, we plan to update and refine for future versions.
The Road Map is a compilation of tools and strategies within a framework that helps bring together data and narrative to better address persistent health and racial inequities. While the Road Map was originally crafted to meet the needs of epidemiologists and data analysts in a public health setting, anyone interested in using data to inform action can use it to inform their practice. Health equity, and specifically racial equity, can be achieved, but our current practices need to be reassessed. The Road Map can serve as a guide for that reassessment, offering data as a tool to translate data to action and achieve sustainable outcomes.
Implications for Policy & Practice.
The Road Map can be used to disrupt the status quo, face racial inequities head on, and inform data-to-action approaches to test new ideas that may finally lead to all people having the opportunity to reach their full potential for health and well-being.
The Road Map can guide public health programs to authentically engage the community; frame data in the historical and structural contexts that impact health; communicate that inequities are unfair, unjust, and preventable; and design solutions that address the root causes of these issues.
There will be a continuing need to refine and build upon what is included in the Road Map as the practice of using data to inform racial equity practice evolves.
The Road Map can be accessed at: https://www.mass.gov/service-details/racial-equity-data-road-map.
Acknowledgments
The authors offer special thanks to the RESPIT members: Beatriz Acevedo, Stefanie Albert, Elizabeth Beatriz, Lindsay Kephart, Megan Young, Nicole Kitten, Kira Landauer, and Elizabeth Wolff. The authors also thank the following people for their support and contributions: Elaine Fitzgerald-Lewis, Alison Mehlman, Craig Andrade, Karin Downs, Hafsatou Diop, Emily Lu, Tim Nielsen, Lara Jackson, Ryan Walker, Kate Hamdan, Melanie Jetter, Emma Posner, Heather Catledge, Rodrigo Monterey, and Joia Crear-Perry.
The findings and conclusions in this presentation are those of the authors and do not necessarily represent the official position of the Massachusetts Department of Public Health or the Centers for Disease Control and Prevention.
Footnotes
The authors have no conflicts of interest.
Contributor Information
Susan E. Manning, Massachusetts Department of Public Health, Boston, Massachusetts; Maternal and Child Health Epidemiology Team, Centers for Disease Control and Prevention, Atlanta, Georgia.
Antonia M. Blinn, Massachusetts Department of Public Health, Boston, Massachusetts.
Sabrina C. Selk, Massachusetts Department of Public Health, Boston, Massachusetts.
Christine F. Silva, Massachusetts Department of Public Health, Boston, Massachusetts.
Katie Stetler, Massachusetts Department of Public Health, Boston, Massachusetts.
Sarah L. Stone, Massachusetts Department of Public Health, Boston, Massachusetts.
Mahsa M. Yazdy, Massachusetts Department of Public Health, Boston, Massachusetts.
Monica Bharel, Massachusetts Department of Public Health, Boston, Massachusetts.
References
- 1.Health Resources Services Administration. Title V Maternal and Child Health Services Block Grant Program. https://mchb.hrsa.gov/maternal-child-health-initiatives/title-v-maternal-and-child-health-services-block-grant-program. Accessed May 12, 2021. [Google Scholar]
- 2.Local and regional government alliance on race and equity. Racial equity: getting to results. https://www.racialequityalliance.org/wp-content/uploads/2017/09/GARE_GettingtoEquity_July2017_PUBLISH.pdf. Accessed May 24, 2021.
- 3.Bailey ZD, Kreiger N, Agenor M, Graves J, Linos N, Bassett MT. Structural racism and health inequities in the USA: evidence and interventions. Lancet. 2017;389(10077):1453–1463. [DOI] [PubMed] [Google Scholar]
- 4.iSixSigma. What is DMAIC? https://www.isixsigma.com/new-to-sixsigma/dmaic/what-dmaic. Accessed April 6, 2021.
- 5.iSixSigma. Value stream mapping. https://www.isixsigma.com/dictionary/value-stream-mapping. Accessed April 6, 2021.
- 6.Lean Six Sigma Definition. CEDAC. https://www.leansixsigmadefinition.com/glossary/cedac. Accessed April 25, 2021. [Google Scholar]
- 7.iSixSigma. Paretochart.https://www.isixsigma.com/tools-templates/graphical-analysis-charts/pareto-chart-bar-chart-histogram-and-pareto-principle-8020-rule. Accessed on May 26, 2021.
- 8.Institute for Healthcare Improvement. How to improve. http://www.ihi.org/resources/Pages/HowtoImprove/default.aspx. Accessed May 12, 2021.
- 9.The Management Center. SMARTIE Goals worksheet. https://www.managementcenter.org/resources/smartie-goals-worksheet/#:~:text=SMARTIE%20stands%20for%20Strategic%2C%20Measurable,by%20tangible%20and%20actionable%20steps. Accessed May 12, 2021.


