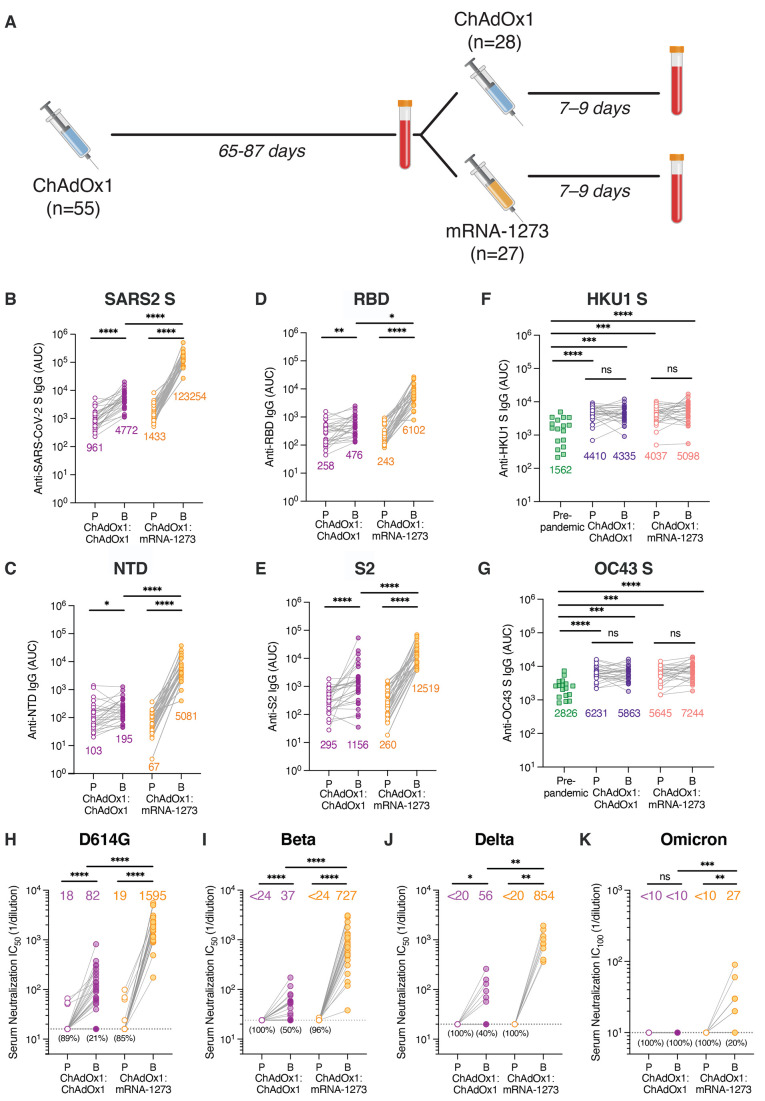
Fig. 1. Serum binding and neutralizing activity following homologous and heterologous prime-boost vaccination.
(A) Immunization and blood draw schedule. (B to G) Serum IgG binding to recombinant SARS-CoV-2 S (1:1 mixture of WT S and S-2P antigens) (B), NTD (C), RBD (D), prefusion-stabilized S2 (E), HKU1 S (F), and OC43 S (G), as assessed by ELISA. Binding of pre-pandemic donor sera (n = 17) is shown for comparison in F-G. Geometric mean AUC values are shown below data points. (H to J) Serum neutralizing activity against authentic SARS-CoV-2 D614G (H) and Beta/B.1.351 (I) measured by plaque reduction assay (n = 27-28 donors from each cohort), Delta/B.1.617.2 (J) measured by cytopathic effect (CPE)-based colorimetric microneutralization assay (n = 10 donors from each cohort). Plotted values represent 50% serum neutralizing titers. Values below the dotted line indicate the percentage of samples with serum neutralizing titers below the limit of detection. (K) Serum neutralizing activity against authentic Omicron/B.1.1.529/BA.1 measured by 100% CPE inhibition (n = 10 donors from each cohort). Values below the dotted line indicate the percentage of samples with serum neutralizing titers below the limit of detection. Statistical comparisons between prime and boost were determined by Wilcoxon pair-matched rank sum test. Statistical comparisons across groups were determined by two-tailed Mann Whitney U test with Bonferroni correction [(B) to (E)] and (H) to (K)] or two-sided Kruskal Wallis test by ranks with subsequent Dunn's multiple comparisons [(F) and (G)]. *P < 0.05, **P < 0.01, ***P < 0.001, ****P<0.0001. P, Prime; B, Boost; AUC; area under the curve; LOD, limit of detection; ns, non-significant. All data are representative of at least two independent experiments.

