

Abstract
Background:
The prevalence of hepatitis B surface antigen is estimated to be 6.7% in the South African population and in April 1995 the nation introduced universal hepatitis B virus (HBV) vaccination for newborns and infants. We studied the temporal association of this program with HBV prevalence in young blood donors and the contemporary HBV incidence and residual risk of transfusion-transmitted HBV infection (TT-HBV).
Methods:
We used blood donation data from January 2011 to December 2019. Estimation of HBV prevalence donations made by first-time blood donors were analyzed by birth cohort and covariates. To estimate the incidence and residual risk of TT-HBV, mathematical models used data from both first time and repeat donors.
Results:
HBV prevalence in first-time donors decreased from 0.84% (95% confidence interval [CI] 0.78–0.90) in 2011 to 0.66% (95% CI 0.61–0.70) in 2019. The post-1995 birth cohort had a significantly lower HBV prevalence of 0.14% (95% CI 0.13–0.15) than the pre-1985 birth cohort of 1.29% (95% CI 1.25–1.33) and the odds of HBV infection were reduced in a multivariable model (odds ratio [OR] = 0.28, 95% CI 0.24–0.34). The residual risk of TT-HBV occurring from window-period, occult, and possible vaccine breakthrough infections were estimated at 36.9, 5.8, and 2.2 per million red blood cell transfusions, respectively.
Conclusion:
Donors born after the start of routine HBV immunization had significantly lower prevalence of HBV infection, supporting the effectiveness of the vaccination program. The contemporary residual risk of TT-HBV has decreased and should decline further as more vaccinated young people join the donor pool.
Keywords: donors, hepatitis, infectious disease testing, transfusion-transmitted disease
1 ∣. INTRODUCTION
The population prevalence of hepatitis B surface antigen (HBsAg) is estimated at 6.7% in South Africa.1 The majority of hepatitis B virus (HBV) acquisition in South Africa is between the ages of 0 and 5 years.2
During 2005, South Africa implemented individual donation (ID) nucleic acid testing (NAT) to screen all donations for HBV-DNA in parallel with HBsAg testing. However, HBV transmission through blood remains possible when HBV-DNA is below the level of NAT detection because of an early window-period (WP) or occult HBV infection (OBI). In addition, acute low viremic breakthrough or abortive infections may occur in vaccinated donors.3 So far, two HBV transmission cases have been confirmed in look-back investigations. In 2012, a case of transfusion-transmitted HBV infection (TT-HBV) occurred through RBCs from a donor in the WP with a very low HBV viral load (VL) of 1.6 copies/ml.4 A second case of TT-HBV by RBCs from a donor with OBI and a similar VL was found in 2013.5
In April 1995, South Africa introduced universal HBV vaccination for newborns and infants into the Expanded Program on Immunization.6 A 6-, 10-, and 14-weeks of age schedule was implemented following which the HBsAg seroprevalence declined from 12.8% in 1995 to 3% in 2009 in children younger than 5 years.7 In 2000, it was estimated that there was 88% coverage of vaccination.8 Although for optimal efficacy against vertical HBV transmission, WHO recommend to give the first dose of vaccine within 24 h after birth, this delayed schedule is expected to reduce the prevalence of chronic HBV infection in younger blood donors, as they reach the age of blood donation eligibility.9 At the South African National Blood Service (SANBS), 60% of the blood donated by first-time donors is from 16 to 24 year olds.
In this study, we aimed to assess the prevalence of viremic HBV infection in blood donors born before and after the rollout of the childhood HBV immunization program as well as the residual risk (RR) of TT-HBV. For this purpose, we monitored the rates of different categories of HBV infection over 9 years of ID-NAT screening. We then estimated residual TT risk from the rates of WP, occult, and possible vaccine breakthrough infections by year and age cohorts. In addition, we examined the impact of socio-demographic factors on the HBV infection rates.
2 ∣. METHODS
2.1 ∣. Setting
SANBS collects blood in 8 of the 9 provinces in South Africa. At the time of collection, donor socio-demographic information are collected. Donations with positive test results for HBV are classified as either HBV concordant (both HBsAg and HBV-DNA positive), WP, OBI, or possible vaccine breakthrough infection according to their test results (Figure 1).
FIGURE 1.

Classification of hepatitis B virus (HBV) infection categories by test results with numbers for the period January 2011 to December 2019. aThe unconfirmed window-period-nucleic acid testing (NAT) yields had replicate Ultrio Plus discriminatory HBV NAT reactivity in the plasma bag and had viral load below the quantification limit of the PCR. bThe occult HBV infections do not include NAT yields with detectable anti-hepatitis B surface (HBs). cThe 115 unconfirmed vaccine breakthrough infections, either had no follow-up testing performed or had no rise in anti-HBs titer, or seroconversion to anti-hepatitis B core (HBc) on follow-up. cThe 78 confirmed vaccine breakthrough or abortive infections are made up of donors who had anti-HBs as the sole serology marker on index, 10 of which had a significant increase in anti-HBs titer on follow-up and seroconversion to anti-HBc IgM, 27 that seroconverted to anti-HBc IgG, 16 that had a rise in anti-HBs titer but no seroconversion to anti-HBc and 25 donors who had no follow-up sample but the viral load >100 copies/ml. Four NAT yields could not be classified because anti-HBc testing was not performed
2.2 ∣. Study design and populations
We used data collected from blood donations made between January 2011 and December 2019. To estimate the prevalence of HBV (HBV DNA positive and/or HBsAg positive donations) and to determine socio-demographic associations of being in different stages of HBV infection, we used data collected on donations made by first-time blood donors. To estimate the incidence and the RR of receiving a TT-HBV infection from a WP, occult, and possible vaccine breakthrough HBV infection, we evaluated data collected from both first-time and repeat donors. Research ethics approval was obtained from the SANBS Human Research Ethics Committee (2020/0536).
2.2 ∣. Laboratory testing
SANBS screens all blood donations using third-generation anti-HIV, HBsAg, and anti-HCV chemiluminescent immunoassays (Prism, Abbott, Delkenhein, Germany) in parallel with NAT (Procleix Ultrio (Plus) (Elite), Grifols, Pleasanton, CA). The Prism was replaced by Alinity also supplied by Abbott in December 2018. SANBS screened blood for HBV using the Plus assay from 2011 to 2014 and the Elite assay since 2015.10-12
2.3 ∣. Classification of HBV infections
An extensive confirmation algorithm13 is in place to categorize HBV infections. For NAT positive, HBsAg negative (NAT yield) infections without follow-up sample, the residual plasma bag was used to confirm the infection. NAT yield donations are categorized further by their anti-hepatitis B core (anti-HBc) and anti-hepatitis B surface (anti-HBs) test results as WP, OBI, or putative breakthrough infections (Figure 1). An OBI is defined as the presence of circulating HBV DNA in the absence of detectable HBsAg excluding the window period.14 A possible vaccine breakthrough infection in our study is defined by presence of anti-HBs (>10 mIU/ml) as the sole serologic serum marker in combination with HBV-DNA. Since two-third of these have no follow-up sample, some of these could represent chronic OBI without detectable anti-HBc.15 A vaccine breakthrough infection is confirmed when the anti-HBs titer rises significantly in follow-up with or without later anti-HBc conversion or has a VL >100 copies per ml in the plasma bag with no follow-up.3
2.5 ∣. Statistical analysis
Frequencies were used to estimate the prevalence of different HBV infection stages in first-time donors. First-time donors were stratified into three birth cohort groups; (1) born before 1985, (2) born between 1985 and 1994 and (3) born after 1995 to analyze prevalence of HBV infection categories by both birth cohort effect and age. A bivariate analysis was performed on first-time donors to determine associations with HBV positivity, HBsAg positivity, WP, OBI, and possible vaccine breakthrough infections. Multivariable logistic regression, including birth cohort and age was performed, controlling for demographic factors found significant in the bivariate analysis, to estimate adjusted odds ratio (aOR) and 95% confidence intervals (CI).
RR was estimated by stratifying by first-time and repeat donors and by birth cohort born before and after 1995. The complete dataset of donations from all donors was used to estimate the RR of obtaining a TT-HBV from a WP and possible vaccine breakthrough infection using a combination of the risk-day equivalent model16 and the NAT yield WP ratio model.17 Briefly, The NAT yield WP ratio model uses the NAT yields detected during the pre-HBsAg, NAT detection period (DP), and extrapolates the number of infectious donations that would be donated during the pre-NAT WP using the ratio of the lengths of the two periods. The infectious pre-ID-NAT and pre-HBsAg PRISM WPs expressed in risk-day equivalents were estimated as described before12,18 with the following input parameters: a 50% minimum infectious dose (MID50) of 3.16 (1–10) virions, and 316 (100–1000) virions in 20 ml plasma for a WP NAT yield and possible vaccine break through infection respectively, a viral doubling time of 2.6 days,19,20 95% and 50% limit of detection (LOD) of 41.2 cp/ml and 4.1 cp/ml, respectively, of the Ultrio Plus (Elite) assay21 and an HBsAg PRISM assay seroconversion point of 960 cp/ml.22 The model calculates infectious WPs of 33.5 days for HBsAg PRISM and 13.1 days for Ultrio Plus (Elite) for nonexposed donors.12 For donors with an anti-HBs putative or confirmed breakthrough infection, the model calculates the infectious pre-HBsAg WP as 16 days and the infectious pre-NAT WP as 1.23 days. For this transmission, risk analysis both confirmed and unconfirmed WP and anti-HBs breakthrough infections were included in the calculation (Figure 1). IgM anti-HBc positive donations were classified as being in the second WP and excluded from the WP RR estimates.
We also estimated the RR of HBV transmission from an OBI. Here we used the newly developed model from Weusten et al.23 This model is based on three components; the distribution of the VL in OBI, the probability that the VL will go undetected and the probability that the VL would cause an infection in a recipient. For this model, we use a 100-fold lower MID50 of 316 (100–1000) virions as the infectivity of a viral particle from an OBI is known to be approximately 100-fold less than that of a WP infection.24,25 Of the 1049 OBI reported, 642 (61%) had a titer of anti-HBs greater than 10 mIU/ml and the model assumes that those were not infectious. Of the 142 IgM anti-HBc positives classified as in the 2nd WP, 32 were anti-HBs negative and included in the RR calculations for OBI.
Finally, incidence was estimated by the same stratification as above. Incidence was calculated as NAT yield WP cases/1000 person years (PY) using the NAT yield WP model.26 In this model, PY are estimated using the NAT positive, HBsAg negative DP of 20.4 days.
3 ∣. RESULTS
3.1 ∣. HBV infection rates in all donations
Between January 2011 and December 2019, SANBS collected 7,377,894 whole blood donations of which 5,489,755 (74%) donations were from repeat donors, 935,984 (13%) by lapsed donors (interdonation interval > 365 days) and 952,155 (13%) by first-time donors. There were 1,238,047 (17%) donations from donors who were born after 1995. Of the NAT yield donations 566 (31%), 1049 (58%), and 193 (11%) were classified as WP, OBI, and anti-HBs breakthrough infections, respectively. During the same time-period there were 181,300 apheresis collections of which 5 (0.003%) tested HBV positive and 2 were NAT yield WP infections, all detected in donors born before 1995. Table 1 provides further detail on HBV infection rates by the HBV marker classification and socio-demographics. The rates of all HBV infection categories were lower in younger donors ≤21 years than above this age with the exception of the putative vaccine breakthrough infections which decreased significantly with age.
TABLE 1.
Number of collections and hepatitis B virus (HBV) infections of different categories in blood donations collected from January 2011 to December 2019
| NAT yield cases (*4 NAT yields could not be classified) |
|||||||||||||
|---|---|---|---|---|---|---|---|---|---|---|---|---|---|
| Collections | HBsAg positive | Total | WP | IgM anti-HBca | OBI | Anti-HBs onlyb | |||||||
| N | N | (%) | N | (×:105) | N | (×:105) | N | (×:105) | N | (×:105) | N | (×:105) | |
| Apheresis | 181,300 | 3 | (0.002) | 2 | (1.1) | 2 | (1.1) | ||||||
| Total WB | 7,377,894 | 6742 | (0.09) | 1812 | (24.6) | 566 | (7.7) | 142 | (1.9) | 1049 | (14.2) | 193 | (2.6) |
| Birth cohort | |||||||||||||
| <1985 | 4,343,458 | 3333 | (0.08) | 952 | (21.9) | 195 | (4.5) | 49 | (1.1) | 721 | (16.6) | 34 | (0.8) |
| 1985–1994 | 1,796,389 | 2912 | (0.16) | 599 | (33.3) | 285 | (15.9) | 82 | (4.6) | 288 | (16.0) | 25 | (1.4) |
| 1995–2004 | 1,238,047 | 497 | (0.04) | 261 | (21.1) | 86 | (6.9) | 11 | (0.9) | 40 | (3.20) | 134 | (10.8) |
| Donor type | |||||||||||||
| Repeat | 5,489,755 | 438 | (0.01) | 837 | (15.2) | 328 | (6.0) | 64 | (1.2) | 414 | (7.50) | 93 | (1.7) |
| First time | 952,155 | 6043 | (0.63) | 710 | (74.6) | 142 | (14.9) | 42 | (4.5) | 493 | (51.8) | 73 | (7.7) |
| Lapsed | 935,984 | 261 | (0.03) | 265 | (28.3) | 96 | (10.3) | 36 | (3.8) | 142 | (15.2) | 27 | (2.9) |
| Year | |||||||||||||
| 2011 | 803,016 | 864 | (0.11) | 243 | (30.3) | 84 | (10.5) | 14 | (1.7) | 154 | (19.2) | 5 | (0.6) |
| 2012 | 781,295 | 758 | (0.10) | 197 | (25.2) | 54 | (6.9) | 16 | (2.0) | 127 | (16.3) | 14 | (1.8) |
| 2013 | 798,147 | 810 | (0.10) | 191 | (23.9) | 65 | (8.1) | 20 | (2.5) | 103 | (12.9) | 22 | (2.8) |
| 2014 | 805,456 | 727 | (0.09) | 197 | (24.5) | 60 | (7.4) | 20 | (2.5) | 117 | (14.5) | 20 | (2.5) |
| 2015 | 830,256 | 737 | (0.09) | 206 | (24.8) | 59 | (7.1) | 12 | (1.4) | 126 | (15.2) | 21 | (2.5) |
| 2016 | 812,294 | 661 | (0.08) | 192 | (23.6) | 62 | (7.6) | 16 | (2.0) | 96 | (11.8) | 34 | (4.2) |
| 2017 | 815,876 | 670 | (0.08) | 161 | (19.7) | 57 | (7.0) | 13 | (1.6) | 78 | (9.60) | 26 | (3.2) |
| 2018 | 816,351 | 654 | (0.08) | 198 | (24.3) | 53 | (6.5) | 10 | (1.2) | 124 | (15.2) | 21 | (2.6) |
| 2019 | 915,203 | 861 | (0.09) | 227 | (24.8) | 72 | (7.9) | 21 | (2.3) | 124 | (13.5) | 30 | (3.3) |
| Age | |||||||||||||
| 16–18 | 1,053,749 | 603 | (0.06) | 201 | (19.1) | 72 | (6.8) | 9 | (0.9) | 40 | (3.80) | 87 | (8.3) |
| 19–21 | 565,423 | 577 | (0.10) | 178 | (31.5) | 75 | (13.3) | 19 | (3.4) | 57 | (10.1) | 46 | (8.1) |
| 22–24 | 496,761 | 643 | (0.13) | 193 | (38.9) | 102 | (20.5) | 29 | (5.8) | 76 | (15.3) | 15 | (3.0) |
| 25–27 | 490,869 | 824 | (0.17) | 163 | (33.2) | 64 | (13.0) | 19 | (3.9) | 94 | (19.1) | 5 | (1.0) |
| 28–30 | 470,789 | 826 | (0.18) | 146 | (31.0) | 59 | (12.5) | 15 | (3.2) | 77 | (16.4) | 10 | (2.1) |
| 31–35 | 729,673 | 1144 | (0.16) | 215 | (29.5) | 74 | (10.1) | 18 | (2.5) | 134 | (18.4) | 6 | (0.8) |
| 36–40 | 717,534 | 823 | (0.11) | 192 | (26.8) | 54 | (7.5) | 13 | (1.8) | 130 | (18.1) | 8 | (1.1) |
| 41–50 | 1,391,466 | 928 | (0.07) | 288 | (20.7) | 37 | (2.7) | 10 | (0.7) | 241 | (17.3) | 9 | (0.6) |
| >50 | 1,461,630 | 374 | (0.03) | 236 | (16.1) | 29 | (2.0) | 10 | (0.7) | 200 | (13.7) | 7 | (0.5) |
| Sex | |||||||||||||
| Female | 3,246,943 | 2532 | (0.08) | 784 | (24.1) | 300 | (9.2) | 79 | (2.4) | 363 | (11.2) | 119 | (3.7) |
| Male | 4,130,951 | 4210 | (0.10) | 1028 | (24.9) | 266 | (6.4) | 63 | (1.5) | 686 | (16.6) | 74 | (1.8) |
| Race | |||||||||||||
| White | 4,105,321 | 302 | (0.01) | 179 | (4.40) | 72 | (1.8) | 17 | (0.4) | 88 | (2.10) | 19 | (0.5) |
| Black | 2,238,977 | 5885 | (0.26) | 1470 | (65.7) | 446 | (19.9) | 116 | (5.2) | 857 | (38.3) | 163 | (7.3) |
| Colored | 400,630 | 281 | (0.07) | 79 | (19.7) | 19 | (4.7) | 3 | (0.7) | 57 | (14.2) | 3 | (0.7) |
| Asian | 548,488 | 107 | (0.020) | 50 | (9.10) | 21 | (3.8) | 5 | (0.9) | 22 | (4.00) | 7 | (1.3) |
| Unknown | 84,478 | 167 | (0.20) | 34 | (40.2) | 8 | (9.5) | 1 | (1.2) | 25 | (29.6) | 1 | (1.2) |
| Province | |||||||||||||
| Eastern Cape | 677,529 | 825 | (0.12) | 163 | (24.1) | 39 | (5.8) | 9 | (1.3) | 105 | (15.5) | 18 | (2.7) |
| Free State | 483,985 | 198 | (0.04) | 103 | (21.3) | 35 | (7.2) | 3 | (0.6) | 55 | (11.4) | 13 | (2.7) |
| Gauteng | 3,344,258 | 2461 | (0.07) | 696 | (20.8) | 238 | (7.1) | 69 | (2.1) | 391 | (11.7) | 65 | (1.9) |
| Kwa-Zulu Natal | 1,235,881 | 1823 | (0.15) | 387 | (31.3) | 107 | (8.7) | 29 | (2.3) | 222 | (18.0) | 57 | (4.6) |
| Limpopo | 257,129 | 302 | (0.12) | 81 | (31.5) | 21 | (8.2) | 7 | (2.7) | 57 | (22.2) | 3 | (1.2) |
| Mpumalanga | 728,454 | 841 | (0.12) | 279 | (38.3) | 93 | (12.8) | 21 | (2.9) | 154 | (21.1) | 32 | (4.4) |
| North West | 415,395 | 159 | (0.04) | 59 | (14.2) | 18 | (4.3) | 4 | (1.0) | 38 | (9.10) | 3 | (0.7) |
| Northern Cape | 235,263 | 133 | (0.06) | 44 | (18.7) | 15 | (6.4) | 0 | (0.0) | 27 | (11.5) | 2 | (0.9) |
Abbreviations: HBc, hepatitis B core; HBs, hepatitis B surface; HBsAg, hepatitis B surface antigen; NAT, nucleic acid testing; OBI, occult HBV infection; WB, whole blood.
Late acute early recovery phase.
Both confirmed and unconfirmed abortive or vaccine breakthrough infection.
3.2 ∣. HBV prevalence by demographics and birth cohort in first-time donors
To estimate HBV prevalence, we used first-time blood donors of whom 6753 (0.71%) tested HBV-positive (Table 2). Donors below the age of 21 years comprised 51% (489,314) of the donations and a further 8% (76,531) were from donors between the age of 21 and 24 years. Females made up 56% of all first-time donors. The HBV prevalence (HBsAg and/or HBV-DNA positive) decreased annually from 0.84% (95% CI 0.78%–0.90%) in 2010 to 0.66% (95% CI 0.61%–0.70%) in 2019 (p < .0001). The HBsAg rates steadily decreased each year from 0.75% (95% CI 0.69%–0.80%) in 2011 to 0.59% (95% CI 0.55%–0.63%) in 2019 (p < .0001) (Table 2). Our birth cohort analysis (Figure 2) shows the increase in HBV prevalence at age of first donation up to the age of 35 in all birth cohorts and a decline thereafter in the oldest cohort born before 1985. However, the birth cohort born after 1995 had markedly lower HBV prevalence than the cohorts born before 1995.
TABLE 2.
Bivariate analysis for hepatitis B surface antigen (HBsAg)-positive case and hepatitis B virus (HBV) nucleic acid testing (NAT) yield cases by various demographic variables in first time donors between January 2011 and December 2019
| Total collections N 952,155 |
Total HBV cases |
HBsAg positive |
Window perioda |
OBI |
Anti-HBs only NAT yieldb |
||||||
|---|---|---|---|---|---|---|---|---|---|---|---|
| N 6753 | % (CI) | N 6043 | % (CI) | N 142 | ×:105 (CI) | N 493 | ×:105 (CI) | N 73 | ×:105 (CI) | ||
| Birth cohort | |||||||||||
| <1985 | 262,536 | 3394 | 1.29 (1.25–1.33) | 3038 | 1.16 (1.11–1.19) | 37 | 14.1 (10.2–19.4) | 315 | 120 (107–133) | 3 | 1.1 (0.36–3.54) |
| 1985–1994 | 282,910 | 2781 | 0.98 (0.94–1.02) | 2552 | 0.90 (0.86–0.93) | 64 | 22.6 (17.7–28.9) | 155 | 55 (46–64) | 9 | 3.2 (1.65–6.11) |
| 1995–2004 | 406,709 | 578 | 0.14 (0.13–0.15) | 453 | 0.11 (0.10–0.12) | 41 | 10.1 (7.42–13.6) | 23 | 6 (3.7–8.5) | 61 | 15 (11.6–19.2) |
| Year | |||||||||||
| 2011 | 103,467 | 873 | 0.84 (0.78–0.90) | 773 | 0.75 (0.69–0.80) | 26 | 25.1 (17.1–36.9) | 72 | 70 (55–88) | 2 | 1.9 (0.48–7.72) |
| 2012 | 100,276 | 765 | 0.76 (0.71–0.81) | 681 | 0.68 (0.62–0.73) | 15 | 15.0 (9.01–24.8) | 61 | 61 (47–78) | 6 | 6.0 (2.68–13.3) |
| 2013 | 109,711 | 799 | 0.73 (0.67–0.78) | 719 | 0.66 (0.60–0.70) | 16 | 14.6 (8.93–23.8) | 59 | 54 (42–69) | 5 | 4.6 (1.89–10.9) |
| 2014 | 104,384 | 711 | 0.68 (0.63–0.73) | 633 | 0.61 (0.56–0.65) | 13 | 12.5 (7.23–21.4) | 56 | 54 (41–70) | 9 | 8.8 (4.48–16.5) |
| 2015 | 103,254 | 721 | 0.70 (0.64–0.75) | 651 | 0.63 (0.58–0.68) | 15 | 14.5 (8.75–24.0) | 48 | 47 (35–62) | 7 | 6.8 (3.23–14.2) |
| 2016 | 97,941 | 665 | 0.68 (0.62–0.73) | 599 | 0.61 (0.56–0.66) | 13 | 13.3 (7.70–22.8) | 39 | 40 (29–55) | 14 | 14 (8.46–24.1) |
| 2017 | 99,134 | 662 | 0.67 (0.61–0.72) | 602 | 0.61 (0.56–0.65) | 13 | 13.1 (7.61–22.5) | 39 | 40 (29–54) | 8 | 8.1 (4.03–16.1) |
| 2018 | 99,961 | 676 | 0.68 (0.62–0.72) | 594 | 0.59 (0.54–0.64) | 13 | 13.0 (7.55–22.3) | 60 | 60 (47–77) | 9 | 9.0 (4.68–17.3) |
| 2019 | 134,027 | 881 | 0.66 (0.61–0.70) | 791 | 0.59 (0.55–0.63) | 18 | 13.4 (8.46–21.3) | 59 | 44 (34–57) | 13 | 9.7 (5.63–16.7) |
| Age | |||||||||||
| 16–18 | 388,275 | 668 | 0.17 (0.15–0.18) | 564 | 0.15 (0.13–0.15) | 33 | 8.5 (6.04–11.9) | 25 | 6 (4.4–9.5) | 45 | 12 (8.65–15.5) |
| 19–21 | 101,039 | 551 | 0.55 (0.50–0.59) | 490 | 0.48 (0.44–0.52) | 20 | 19.8 (12.7–30.6) | 27 | 27 (18–39) | 14 | 14 (8.20–23.3) |
| 22–24 | 76,531 | 603 | 0.79 (0.72–0.85) | 531 | 0.69 (0.63–0.75) | 24 | 31.4 (21.0–46.7) | 42 | 55 (41–74) | 6 | 7.8 (3.52–17.4) |
| 25–27 | 70,481 | 797 | 1.13 (1.05–1.21) | 724 | 1.03 (0.95–1.10) | 17 | 24.1 (14.9–38.7) | 54 | 77 (59–100) | 2 | 2.8 (0.70–11.3) |
| 28–30 | 61,087 | 807 | 1.32 (1.23–1.41) | 740 | 1.21 (1.12–1.30) | 14 | 22.9 (13.5–38.6) | 49 | 80 (61–106) | 4 | 6.6 (2.45–17.4) |
| 31–35 | 78,440 | 1145 | 1.46 (1.37–1.54) | 1063 | 1.36 (1.27–1.43) | 18 | 23.0 (14.4–36.4) | 64 | 82 (64–104) | ||
| 36–40 | 57,092 | 828 | 1.45 (1.35–1.55) | 756 | 1.32 (1.23–1.42) | 9 | 15.8 (8.20–30.2) | 62 | 109 (85–139) | 1 | 1.8 (0.24–12.4) |
| 41–50 | 76,648 | 946 | 1.23 (1.15–1.31) | 841 | 1.10 (1.02–1.17) | 4 | 5.2 (1.95–13.9) | 99 | 129 (106–157) | 1 | 1.3 (0.18–9.26) |
| >50 | 42,562 | 408 | 0.96 (0.86–1.05) | 334 | 0.78 (0.70–0.87) | 3 | 7.1 (2.27–21.8) | 71 | 167 (132–210) | ||
| Sex | |||||||||||
| Female | 535,548 | 2669 | 0.50 (0.47–0.51) | 2314 | 0.43 (0.41–0.45) | 101 | 18.9 (15.5–22.9) | 202 | 38 (33–43) | 50 | 9.3 (7.07–12.3) |
| Male | 416,607 | 4084 | 0.98 (0.95–1.01) | 3729 | 0.90 (0.86–0.92) | 41 | 9.8 (7.24–13.3) | 291 | 70 (62–78) | 23 | 5.5 (3.66–8.30) |
| Race | |||||||||||
| Asian | 66,570 | 85 | 0.13 (0.10–0.15) | 77 | 0.12 (0.09–0.14) | 2 | 3.0 (0.75–12.0) | 5 | 8 (3.1–18) | 1 | 1.5 (0.21–10.6) |
| Black | 524,158 | 6040 | 1.15 (1.12–1.18) | 5402 | 1.03 (1.00–1.05) | 129 | 24.6 (20.7–29.2) | 436 | 83 (76–91) | 71 | 14 (10.7–17.0) |
| Colored | 52,698 | 264 | 0.50 (0.44–0.56) | 245 | 0.46 (0.41–0.52) | 2 | 3.8 (0.94–15.1) | 17 | 32 (20–52) | ||
| White | 283,593 | 182 | 0.06 (0.05–0.07) | 160 | 0.06 (0.04–0.06) | 5 | 1.8 (0.73–4.23) | 16 | 6 (3.5–9.2) | 1 | 0.4 (0.04–2.50) |
| U | 25,136 | 182 | 0.72 (0.62–0.83) | 159 | 0.63 (0.54–0.73) | 4 | 15.9 (5.97–42.4) | 19 | 76 (48–118) | ||
| Province | |||||||||||
| Eastern Cape | 91,081 | 845 | 0.93 (0.86–0.99) | 775 | 0.85 (0.79–0.91) | 10 | 11.0 (5.90–20.4) | 52 | 57 (44–75) | 7 | 7.7 (3.66–16.1) |
| Free State | 49,913 | 183 | 0.37 (0.31–0.42) | 141 | 0.28 (0.23–0.33) | 7 | 14.0 (6.68–29.4) | 26 | 52 (35–77) | 9 | 18 (9.38–34.6) |
| Gauteng | 423,082 | 2448 | 0.58 (0.55–0.60) | 2187 | 0.52 (0.49–0.53) | 60 | 14.2 (11.0–18.2) | 179 | 42 (37–49) | 21 | 5.0 (3.23–7.61) |
| Kwa-Zulu Natal | 193,487 | 1816 | 0.94 (0.89–0.98) | 1675 | 0.87 (0.82–0.90) | 24 | 12.4 (8.31–18.5) | 98 | 51 (42–62) | 19 | 9.8 (6.26–15.3) |
| Limpopo | 37,610 | 304 | 0.81 (0.72–0.90) | 276 | 0.73 (0.65–0.82) | 4 | 10.6 (3.99–28.3) | 21 | 56 (36–86) | 3 | 8.0 (2.57–24.7) |
| Mpumalanga | 90,193 | 868 | 0.96 (0.90–1.02) | 736 | 0.82 (0.75–0.87) | 31 | 34.4 (24.1–48.8) | 89 | 99 (80–121) | 12 | 13 (7.55–23.4) |
| North West | 43,580 | 151 | 0.35 (0.29–0.40) | 127 | 0.29 (0.24–0.34) | 3 | 6.9 (2.22–21.3) | 20 | 46 (30–71) | 1 | 2.3 (0.32–16.2) |
| Northern Cape | 23,209 | 138 | 0.59 (0.50–0.70) | 126 | 0.54 (0.45–0.64) | 3 | 12.9 (4.16–40.0) | 8 | 35 (17–69) | 1 | 4.3 (0.60–30.5) |
Abbreviations: CI, confidence interval; HBs, hepatitis B surface; OBI, occult HBV infection.
Including IgM anti-hepatitis B core-positive second window period.
Includes confirmed vaccine breakthrough and unconfirmed anti-HBs only positive NAT yields and abortive infections.
FIGURE 2.
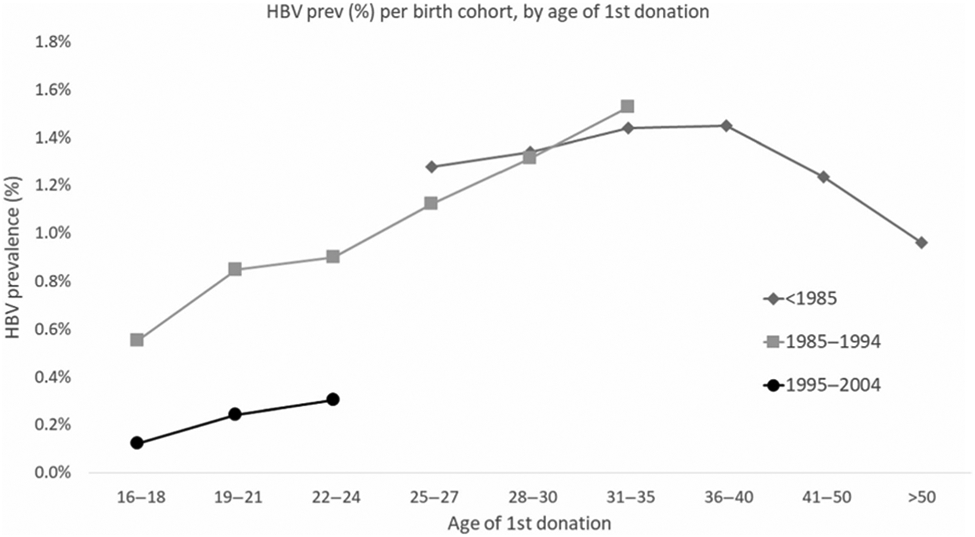
Hepatitis B virus (HBV) prevalence by birth cohort and age at first blood donation
The overall prevalence of possible vaccine breakthrough infections was 7.67 (95% CI 6.10–9.64) per 100,000 donors. In contrast to the prevalence of HBV and NAT yield, donors born after 1995 have a significantly higher prevalence of possible vaccine breakthrough infection (15 per 100,000) than those born before 1985 (1 per 100,000) (Table 2).
In the bivariate analysis in first-time donors, the birth cohort born after 1995 had a significantly lower prevalence of HBV infection at 0.14% (95% CI 0.13–0.15) than donors born before 1995 at 1.13% (95% CI 1.1–1.16) (Table 2). Being black African (1.15%), male (0.98%), from the Kwazulu-Natal (0.94%), Mpumalanga (0.96%) and Eastern Cape (0.93%) provinces, and over the age of 25 (1.28%) were associated with being HBV-positive. Similar demographics were associated with being in the NAT yield categories (Table 2).
Table 3 shows the multivariable logistic regression models for any HBV infection and separate models for HBsAg or HBV NAT yield infections. Being born after 1995 remains associated with a significantly lower HBV infection (OR 0.28 CI 0.24–0.34) than if born before 1985. Being under the age of 27 years old is associated with a lower HBV prevalence and being between the age of 36 and 50 is associated with a higher HBV prevalence, both compared to ages over 50 years. The NAT yield prevalence is significantly lower in all age groups under 50 when compared with older than 50 years and this is driven by a high prevalence of OBI in older donors. Females have half the odds of being HBV-positive and having an OBI but 1.8 the odds of having a WP infection. After adjusting, HBV infection in donors from Mpumalanga becomes significantly lower than in donors from the Kwazulu-Natal province (OR 0.69 CI 0.63–0.75).
TABLE 3.
Multivariable models of associations with any HBV infection, with hepatitis B surface antigen (HBsAg) and nucleic acid testing (NAT) yield, and with NAT yield sub classification; first-time donors only, 2011–2019
| NAT yield classification |
||||||||||
|---|---|---|---|---|---|---|---|---|---|---|
| HBV |
HBsAg |
NY |
Occult |
WP |
||||||
| OR | (95% CI) | OR | (95% CI) | OR | (95% CI) | OR | (95% CI) | OR | (95% CI) | |
| Birth cohort | ||||||||||
| <1985 | 1.00 | (—) | 1.00 | (—) | 1.00 | (—) | 1.00 | (—) | 1.00 | (—) |
| 1985–1994 | 1.00 | (0.90,1.11) | 1.03 | (0.92,1.15) | 0.75 | (0.53,1.07) | 0.66 | (0.44,1.00) | 1.15 | (0.53,2.47) |
| 1995–2004 | 0.28 | (0.24,0.34) | 0.24 | (0.20,0.29) | 0.72 | (0.42,1.22) | 0.19 | (0.09,0.41) | 1.45 | (0.48,4.36) |
| Year | ||||||||||
| 2011 | 1.22 | (1.10,1.36) | 1.17 | (1.05,1.31) | 1.71 | (1.25,2.34) | 1.53 | (1.05,2.22) | 2.81 | (1.37,5.73) |
| 2012 | 1.17 | (1.06,1.30) | 1.14 | (1.02,1.27) | 1.48 | (1.08,2.03) | 1.40 | (0.96,2.03) | 1.60 | (0.75,3.40) |
| 2013 | 1.10 | (1.00,1.22) | 1.09 | (0.98,1.22) | 1.22 | (0.89,1.67) | 1.21 | (0.83,1.75) | 1.40 | (0.68,2.88) |
| 2014 | 1.06 | (0.96,1.18) | 1.04 | (0.93,1.16) | 1.28 | (0.93,1.74) | 1.25 | (0.86,1.82) | 1.19 | (0.56,2.50) |
| 2015 | 1.09 | (0.98,1.21) | 1.09 | (0.98,1.21) | 1.12 | (0.82,1.54) | 1.08 | (0.73,1.59) | 1.28 | (0.63,2.60) |
| 2016 | 1.06 | (0.96,1.18) | 1.06 | (0.95,1.18) | 1.11 | (0.81,1.53) | 0.95 | (0.63,1.42) | 1.15 | (0.55,2.37) |
| 2017 | 1.04 | (0.94,1.15) | 1.05 | (0.94,1.17) | 0.98 | (0.71,1.36) | 0.93 | (0.62,1.39) | 1.09 | (0.53,2.24) |
| 2018 | 1.00 | (0.90,1.10) | 0.97 | (0.87,1.08) | 1.24 | (0.92,1.67) | 1.32 | (0.92,1.89) | 1.01 | (0.49,2.06) |
| 2019 | 1.00 | (—) | 1.00 | (—) | 1.00 | (—) | 1.00 | (—) | 1.00 | (—) |
| Age | ||||||||||
| 16–18 | 0.35 | (0.29,0.42) | 0.40 | (0.32,0.49) | 0.16 | (0.09,0.29) | 0.11 | (0.05,0.23) | 0.68 | (0.14,3.25) |
| 19–21 | 0.57 | (0.47,0.68) | 0.63 | (0.52,0.76) | 0.30 | (0.17,0.51) | 0.23 | (0.12,0.44) | 1.38 | (0.31,6.20) |
| 22–24 | 0.63 | (0.53,0.74) | 0.67 | (0.56,0.80) | 0.48 | (0.29,0.78) | 0.39 | (0.22,0.68) | 2.43 | (0.57,10.31) |
| 25–27 | 0.79 | (0.68,0.92) | 0.86 | (0.73,1.02) | 0.51 | (0.32,0.80) | 0.45 | (0.27,0.75) | 1.96 | (0.48,8.07) |
| 28–30 | 0.94 | (0.81,1.07) | 1.04 | (0.90,1.20) | 0.49 | (0.33,0.72) | 0.41 | (0.27,0.63) | 1.97 | (0.52,7.43) |
| 31–35 | 1.08 | (0.96,1.21) | 1.22 | (1.08,1.39) | 0.44 | (0.32,0.61) | 0.37 | (0.26,0.53) | 2.23 | (0.65,7.69) |
| 36–40 | 1.17 | (1.04,1.32) | 1.31 | (1.15,1.49) | 0.55 | (0.40,0.77) | 0.50 | (0.35,0.70) | 1.74 | (0.47,6.44) |
| 41–50 | 1.13 | (1.01,1.27) | 1.23 | (1.09,1.40) | 0.68 | (0.51,0.92) | 0.67 | (0.50,0.91) | 0.64 | (0.14,2.87) |
| >50 | 1.00 | (—) | 1.00 | (—) | 1.00 | (—) | 1.00 | (—) | 1.00 | (—) |
| Sex | ||||||||||
| Female | 0.48 | (0.45,0.50) | 0.45 | (0.43,0.48) | 0.76 | (0.65,0.88) | 0.54 | (0.45,0.64) | 1.81 | (1.26,2.61) |
| Male | 1.00 | — | ||||||||
| Race | ||||||||||
| Black African | 1.13 | (1.01,1.27) | 9.10 | (8.28,10.0) | 0.51 | (0.32,0.80) | 0.45 | (0.27,0.75) | 1.96 | (0.48,8.07) |
| Unknown | 0.48 | (0.45,0.50) | 4.13 | (3.45,4.95) | 0.49 | (0.33,0.72) | 0.41 | (0.27,0.63) | 1.97 | (0.52,7.43) |
| Non Black African | 1.00 | (—) | 1.00 | (—) | 1.00 | (—) | 1.00 | (—) | 1.00 | (—) |
| Province | ||||||||||
| Eastern Cape | 0.99 | (0.91,1.07) | 0.99 | (0.90,1.08) | 0.99 | (0.75,1.33) | 0.99 | (0.71,1.39) | 0.93 | (0.44,1.94) |
| Free State | 0.33 | (0.29,0.39) | 0.28 | (0.23,0.33) | 1.04 | (0.74,1.47) | 0.89 | (0.58,1.37) | 1.05 | (0.45,2.43) |
| Gauteng | 0.45 | (0.43,0.48) | 0.44 | (0.41,0.47) | 0.65 | (0.53,0.80) | 0.57 | (0.45,0.74) | 0.99 | (0.61,1.59) |
| Limpopo | 0.52 | (0.46,0.59) | 0.51 | (0.45,0.59) | 0.62 | (0.41,0.94) | 0.59 | (0.37,0.95) | 0.65 | (0.23,1.89) |
| Mpumalanga | 0.69 | (0.63,0.75) | 0.63 | (0.58,0.69) | 1.44 | (1.13,1.82) | 1.25 | (0.94,1.67) | 2.29 | (1.34,3.92) |
| North West | 0.37 | (0.31,0.43) | 0.33 | (0.28,0.40) | 0.79 | (0.51,1.23) | 0.87 | (0.54,1.41) | 0.66 | (0.20,2.18) |
| Northern Cape | 0.80 | (0.67,0.95) | 0.78 | (0.65,0.93) | 0.99 | (0.55,1.80) | 0.83 | (0.40,1.72) | 1.66 | (0.50,5.56) |
| Kwa-Zulu Natal | 1.00 | (—) | 1.00 | (—) | 1.00 | (—) | 1.00 | (—) | 1.00 | (—) |
Note: Shading highlights those variables that are statistically significant compared to the reference.
Abbreviations: CI, confidence interval; HBV, hepatitis B virus; NY, NAT yield; OR, odds ratio; WP, window-period.
Finally, the birth cohort born after 1995 no longer had a significantly higher odds of being a possible anti-HBs breakthrough infection (aOR 13.3 CI 0.90–196.03) (data not shown).
3.3 ∣. HBV incidence and RR
To estimate HBV incidence and RR, donations from both first-time, lapsed, and repeat donors were analyzed (Table 1). There were 8554 (0.12%) donations that tested HBV-positive of which three quarters (6564) tested both HBV-DNA and HBsAg-positive. Of the remaining 1990 discordant HBV-DNA and HBsAg results, 1812 confirmed as HBV-DNA positive, HBsAg-negative (NAT yields).
The incidence in first-time donors was 1.8-fold higher in donors born before 1995 at 3.35 (2.75–4.07) per 1000 PY than in donors born after 1995 at 1.80 (1.33–.45) per 1000 PY. The overall estimated RR of a TT-HBV infection occurring was 45.08 per million RBC transfusions made up by the RR of a WP, OBI, and possible vaccine breakthrough of 36.90, 6.0, and 2.18 per million RBC transfusions, respectively. Table 4 shows the RR by first-time and repeat donors and for donors born before and after 1995. RR in first-time donors ranges from two-fold (WP) to 8-fold (OBI) higher than in repeat donors. The risk of an OBI in a donor born before 1995 causing TT-HBV is 5.2-fold higher than in younger donors. However, the risk of a WP causing TT-HBV is similar in both birth cohorts. In contrast, the risk of TT-HBV from a donor with a possible vaccine breakthrough infection was 11-fold higher in younger donors born after 1995 (Table 4).
TABLE 4.
Incidence and residual risk of a window period, vaccine breakthrough, and occult infection causing transfusion-transmitted hepatitis B virus (HBV) infection using all donations between January 2011 and December 2019
| Residual risk ×:million |
|||||
|---|---|---|---|---|---|
| Variable | Incidencea ×/1000 PY (95% CI) | Window period | Vaccine break through | OBI MID50 = 316 | Total |
| First time donors | |||||
| Born after 1995 | 1.80 (1.33–2.45) | 56.84 | 12.49 | 2.40 | 71.73 |
| Born before 1995 | 3.35 (2.75–4.07) | 75.35 | 1.83 | 36.00 | 113.18 |
| All donations | 1.37 (1.26–1.49) | 36.90 | 2.18 | 6.00 | 45.08 |
| Repeat | 1.18 (1.07–1.29) | 32.38b | 1.56 | 3.70 | 37.63 |
| First time | 2.68 (2.28–3.16) | 67.44 | 6.38 | 22.00 | 95.83 |
| Born after 1995 | 1.24 (1.00–1.53) | 38.90 | 9.01 | 1.40 | 49.31 |
| Born before 1995 | 1.40 (1.28–1.53) | 36.50 | 0.80 | 6.90 | 44.20 |
Abbreviations: CI, confidence interval; MID, minimum infectious dose; OBI, occult HBV infection; PY, person years.
Incidence is based on acute window-period HBV-nucleic acid testing yields without taking into account the possible vaccine breakthrough or abortive infections with anti-hepatitis B surface only.
When using the Weusten incidence rate-risk day equivalent model16 from the hepatitis B surface antigen and HBV-DNA conversion rate in repeat donors, a 1.8 fold lower residual risk of 17.92 per million donations was estimated.
4 ∣. DISCUSSION
Our study provides evidence that over a nine-year period, the HBV prevalence decreased from 0.84% to 0.66% in first-time donors and the decline in prevalence was most notable in the birth cohort born after the 1995 roll-out of infant HBV vaccination in South Africa. In this age cohort, HBV prevalence was 0.14% as compared to 1.29% in the before 1985 birth cohorts. In parallel, the proportion of anti-HBs only positive NAT yield donations possibly representing potential vaccine breakthrough infections increased from 1.1 to 15 per 100,000 in the before 1985 to after 1995 birth cohorts. Finally, the overall RR of a TT-HBV infection was estimated at 45 per million RBC transfusions, with the majority coming from WP infections, however, according to our modeling OBI and potential vaccine breakthrough infections did account for 13% and 5% of the RR respectively.
The 8-fold lower HBV prevalence and 2-fold lower incidence in donors born after 1995 is encouraging. Other studies in South Africa have shown reduced post-vaccination HBV infection rates in children.27,28 These studies showed a waning of vaccine-induced immunity with age. Approximately 80% of children under 5 years and only 35%–45% of 16 year olds had detectable anti-HBs.28,29 Our study's significantly lower HBV and HBsAg prevalence in younger donors indicate that even though there is a declining humoral response of anti-HBs levels over time, other immune factors induced by the vaccine protect against chronic infection (it must be noted that time-correlation to the vaccination rollout is circumstantial since no evidence of vaccination record was obtained). Vertical (mother-to-child) and horizontal early childhood transmission are the main routes of HBV transmission in South Africa. Our study and others27-29 still show a small remaining prevalence of HBV markers in vaccines. Although subclinical acute resolving infections are known to occur in blood donors even when they are vaccinated,3 minimizing HBV transmission early in life has the most impact on reducing morbidity and mortality in adulthood30 and benefiting blood safety.
Incident infections are recently acquired infections which in blood donors means the infection was not acquired in infancy. Since in first-time donors HBsAg reactivity often is related to chronic carriership, only the NAT yield WP cases were used for calculating incidence in our study. In first-time donors, we found about a two-fold lower incidence of HBV in birth cohorts born after 1995 compared to those born before 1995. Our data suggest that childhood vaccination may not totally prevent adult HBV infections. This may be due to a suboptimal vaccination schedule (with delayed administration of the first-dose at the age of 6 weeks instead of at birth).9 The impact of vaccination on the reduction of HBV infection is best studied by comparing the anti-HBc prevalence, but unfortunately these data were not available since South African donors are not routinely tested for this marker.
Most often, a vaccine breakthrough infection means that an asymptomatic acute or transient HBV infection occurred despite a history of vaccination.31 Normally, a breakthrough infection is characterized by the seroconversion of anti-HBc antibodies or the detection of low levels of HBsAg with the pre-existence of anti-HBs antibodies.31 A limitation of our study was that a possible vaccine breakthrough infection was classified from the test results alone without knowledge of vaccination history and two thirds of these anti-HBs only NAT yields lacked follow-up to differentiate acute infection from chronic OBI with anti-HBs as the sole detectable marker. Also anti-HBs nonreactive WP NAT yields and IgM-anti-HBc and anti-HBs-positive WP NAT yields can represent vaccine breakthrough infections,3 which in our study were not recognized because of lack of follow-up (note that in the US the majority of acute NAT yields were found among vaccinated donors).3 When we analyzed those donations that confirmed as vaccine breakthrough because of increased anti-HBs titer in follow-up, a higher rate of vaccine breakthrough in the donors born after 1995 was seen (4.2 × 10⁵ vs. 0.42 × 10⁵, p < .0001). Primary vaccine failure (non-responder), waning immunity after vaccination, the emergence of escape mutants or other genotype than vaccine-related genotype A2 infections,3 and inappropriate vaccine schedules can all be causes of vaccine breakthrough infection.
We estimated the RR of a TT-HBV from a WP infection at SANBS of 36.9 per million RBC transfusions which is lower than the 65 per million we previously estimated in 2011.12 We hypothesize that with younger donors born after 1995 entering the donor pool, the overall RR of TT-HBV will decrease. This hypothesis seems realistic since HBsAg prevalence was 9–11 fold lower in young first-time donors born after 1995, but we found that RR of WP infection was only two thirds that of older first-time donors. The latter lower than expected reduction in RR may be due to the fact that it was based on the rate of HBV WP-NAT yields only, half of which were not confirmed by follow-up testing and could represent abortive infections.18 In this context, it is of note that RR of WP infection was 1.8-fold lower when it was calculated from both the HBV-DNA and HBsAg conversion rate in repeat donors (17.9 vs. 32.4 per million, see footnote Table 4) which may indicate that half of the WP-NAT yields (and anti-HBs only NAT yields in young vaccinated donors) represent abortive infections that do not lead to anti-HBc seroconversion. As described before,18 a large proportion of both the possible WP-NAT yields and possible vaccine breakthrough infections had very low VL and were nonreactive in quantitative PCR. These infections were confirmed by replicate testing of samples taken from the plasma unit and it cannot be excluded that some of them are due to NAT contamination.18
Donors who have OBI normally have very low VL in the presence of anti-HBc and/or anti-HBs leading their donations to be less infectious than a WP infection.24 According to our modeling, the additional TT-HBV RR by RBCs from donors with OBI and possible vaccine breakthrough infections was estimated at 6 and 2.18 per million, respectively. The two reported cases of TT-HBV (one each from a WP and an OBI infection)4,5 represent 271- and 44-fold lower transmission rates than the modeled RR. Many factors may account for this discrepancy including lack of active surveillance, higher mortality or prior immunity in transfused patients.
Being older, male, black African, and coming from the Eastern Cape and Kwazulu Natal provinces was associated with a higher prevalence of HBV. We replicated the finding of male donors having HBV prevalence two-fold higher than female donors.1 However, females are one and a half times more likely to have an incident infection in line with population studies.1 This was seen in WP NAT yields and anti-HBs possible vaccine breakthrough NAT yields. When comparing the other demographic predictors for an HBV infection with those of HIV infection, similar variables such as race, first-time or repeat donor and geographic regions are predictors for both.32 It is possible that other HIV infection-preventative measures such as change in condom use and sexual behavior could in part add to the lower HBV prevalence in young donors. Taken together, donors under the age of 20 have the lowest prevalence of HIV and HBV and should be targeted for educational programs to keep them safe and to motivate them to become regular blood donors.
In conclusion, our study showed that blood donors born after the rollout of routine childhood HBV immunization in South Africa had a lower prevalence and incidence of HBV markers, which could be attributed to the vaccination program's efficacy. Over time, as more vaccinated young people join the donor pool and become regular donors, the RR of a TT-HBV infection should decline and the safety of the blood supply ought to improve.
ACKNOWLEDGMENTS
We would like to thank Josephine Mitchel, Sheila Balinda, and Moses Badio for critical review of the manuscript. We wish to acknowledge support from the University of California, San Francisco International Traineeships in AIDS Prevention Studies (ITAPS; Grant R25MH064712) the NIH Fogarty International Center (Grant D43-TW010345) and the South African National Blood Service.
Footnotes
CONFLICT OF INTEREST
The authors have disclosed no conflicts of interest.
REFERENCES
- 1.Ginzberg D, Wong RJ, Gish R. Global HBV burden: guesstimates and facts. Hepatol Int. 2018;12:315–29. [DOI] [PubMed] [Google Scholar]
- 2.Spearman CW, Sonderup MW. Preventing hepatitis B and hepatocellular carcinoma in South Africa: the case for a birth-dose vaccine. S Afr Med J. 2014;104:610–2. [DOI] [PubMed] [Google Scholar]
- 3.Stramer SL, Wend U, Candotti D, Foster GA, Hollinger FB, Dodd RY, et al. Nucleic acid testing to detect HBV infection in blood donors. N Engl J Med. 2011;364:236–47. [DOI] [PubMed] [Google Scholar]
- 4.Vermeulen M, Dickens C, Lelie N, Walker E, Coleman C, Keyter M, et al. Hepatitis B virus transmission by blood transfusion during 4 years of individual-donation nucleic acid testing in South Africa: estimated and observed window period risk. Transfusion. 2012;52:880–92. [DOI] [PubMed] [Google Scholar]
- 5.Vermeulen M, Coleman C, Walker V, Koppelman M, Lelie N, Reddy R. Transmission of occult HBV infection by ID-NAT screened blood. Vox Sang. 2014;107(Suppl 1):146–7. [Google Scholar]
- 6.Tsebe KV, Burnett RJ, Hlungwani NP, Sibara MM, Venter PA, Mphahlele MJ. The first five years of universal hepatitis B vaccination in South Africa: evidence for elimination of HBsAg carriage in under 5-year-olds. Vaccine. 2001;19:3919–26. [DOI] [PubMed] [Google Scholar]
- 7.Spearman CW, Afihene M, Ally R, Apica B, Awuku Y, Cunha L, et al. Hepatitis B in sub-Saharan Africa: strategies to achieve the 2030 elimination targets. Lancet Gastroenterol Hepatol. 2017;2:900–9. [DOI] [PubMed] [Google Scholar]
- 8.World Health Organization. WHO vaccine-preventable diseases: monitoring system. 2020 global summary. 2020. https://apps.who.int/immunization_monitoring/globalsummary/coverages?c=ZAF. Accessed March 2021. [Google Scholar]
- 9.Ip HM, Lelie PN, Wong VC, Kuhns MC, Reesink HW. Prevention of hepatitis B virus carrier state in infants according to maternal serum levels of HBV DNA. Lancet. 1989;1:406–10. [DOI] [PubMed] [Google Scholar]
- 10.Coleman C, Lelie N, Rademeyer R, van Drimmelen H, van den Berg K, Vermeulen M. Comparison of two nucleic acid amplification technology systems for detection of human immunodeficiency virus, hepatitis B virus, and hepatitis C virus. Transfusion. 2020;60:2929–37. [DOI] [PMC free article] [PubMed] [Google Scholar]
- 11.Grabarczyk P, van Drimmelen H, Kopacz A, Gdowska J, Liszewski G, Piotrowski D, et al. Head-to-head comparison of two transcription-mediated amplification assay versions for detection of hepatitis B virus, hepatitis C virus, and human immunodeficiency virus Type 1 in blood donors. Transfusion. 2013;53:2512–24. [DOI] [PubMed] [Google Scholar]
- 12.Vermeulen M, van Drimmelen H, Coleman C, Sykes W, Reddy R, Busch M, et al. Reassessment of hepatitis B virus window periods for two transcription-mediated amplification assays using screening data of South African blood donors. Transfusion. 2019;59:2922–30. [DOI] [PMC free article] [PubMed] [Google Scholar]
- 13.Vermeulen M, Lelie N, Sykes W, Crookes R, Swanevelder J, Gaggia L, et al. Impact of individual-donation nucleic acid testing on risk of human immunodeficiency virus, hepatitis B virus, and hepatitis C virus transmission by blood transfusion in South Africa. Transfusion. 2009;49:1115–25. [DOI] [PubMed] [Google Scholar]
- 14.Allain JP, Mihaljevic I, Gonzalez-Fraile MI, Gubbe K, Holm-Harritshoj L, Garcia JM, et al. Infectivity of blood products from donors with occult hepatitis B virus infection. Transfusion. 2013;53:1405–15. [DOI] [PubMed] [Google Scholar]
- 15.Lelie N, Bruhn R, Busch M, Vermeulen M, Tsoi WC, Kleinman S, et al. Detection of different categories of hepatitis B virus (HBV) infection in a multi-regional study comparing the clinical sensitivity of hepatitis B surface antigen and HBV-DNA testing. Transfusion. 2017;57:24–35. [DOI] [PubMed] [Google Scholar]
- 16.Weusten J, Vermeulen M, van Drimmelen H, Lelie N. Refinement of a viral transmission risk model for blood donations in seroconversion window phase screened by nucleic acid testing in different pool sizes and repeat test algorithms. Transfusion. 2011;51:203–15. [DOI] [PubMed] [Google Scholar]
- 17.Busch MP, Glynn SA, Stramer SL, Strong DM, Caglioti S, Wright DJ, et al. A new strategy for estimating risks of transfusion-transmitted viral infections based on rates of detection of recently infected donors. Transfusion. 2005;45:254–64. [DOI] [PubMed] [Google Scholar]
- 18.Lelie N, Vermeulen M, van Drimmelen H, Coleman C, Bruhn R, Reddy R, et al. Direct comparison of three residual risk models for hepatitis B virus window period infections using updated input parameters. Vox Sang. 2020;115:133–45. [DOI] [PubMed] [Google Scholar]
- 19.Biswas R, Tabor E, Hsia CC, Wright DJ, Laycock ME, Fiebig EW, et al. Comparative sensitivity of HBV NATs and HBsAg assays for detection of acute HBV infection. Transfusion. 2003;43:788–98. [DOI] [PubMed] [Google Scholar]
- 20.Yoshikawa A, Gotanda Y, Itabashi M, Minegishi K, Kanemitsu K, Nishioka K, et al. HBV NAT positive [corrected] blood donors in the early and late stages of HBV infection: analyses of the window period and kinetics of HBV DNA. Vox Sang. 2005;88:77–86. [DOI] [PubMed] [Google Scholar]
- 21.Vermeulen M, Coleman C, Mitchel J, Reddy R, van Drimmelen H, Ficket T, et al. Sensitivity of individual-donation and minipool nucleic acid amplification test options in detecting window period and occult hepatitis B virus infections. Transfusion. 2013;53:2459–66. [DOI] [PMC free article] [PubMed] [Google Scholar]
- 22.Assal A, Barlet V, Deschaseaux M, Dupont I, Gallian P, Guitton C, et al. Sensitivity of two hepatitis B virus, hepatitis C virus (HCV), and human immunodeficiency virus (HIV) nucleic acid test systems relative to hepatitis B surface antigen, anti-HCV, anti-HIV, and p24/anti-HIV combination assays in seroconversion panels. Transfusion. 2009;49:301–10. [DOI] [PubMed] [Google Scholar]
- 23.Weusten J, van Drimmelen H, Vermeulen M, Lelie N. A mathematical model for estimating residual transmission risk of occult hepatitis B virus infection with different blood safety scenarios. Transfusion. 2017;57:841–9. [DOI] [PubMed] [Google Scholar]
- 24.Kleinman SH, Lelie N, Busch MP. Infectivity of human immunodeficiency virus-1, hepatitis C virus, and hepatitis B virus and risk of transmission by transfusion. Transfusion. 2009;49:2454–89. [DOI] [PubMed] [Google Scholar]
- 25.Satake M, Taira R, Yugi H, Hino S, Kanemitsu K, Ikeda H, et al. Infectivity of blood components with low hepatitis B virus DNA levels identified in a lookback program. Transfusion. 2007;47:1197–205. [DOI] [PubMed] [Google Scholar]
- 26.Vermeulen M, Chowdhury D, Swanevelder R, Grebe E, Brambilla D, Jentsch U, et al. HIV incidence in South African blood donors from 2012 to 2016: a comparison of estimation methods. Vox Sang. 2021;116:71–80. [DOI] [PMC free article] [PubMed] [Google Scholar]
- 27.Amponsah-Dacosta E, Lebelo RL, Rakgole JN, Selabe SG, Gededzha MP, Mayaphi SH, et al. Hepatitis B virus infection in post-vaccination South Africa: occult HBV infection and circulating surface gene variants. J Clin Virol. 2015;63:12–7. [DOI] [PMC free article] [PubMed] [Google Scholar]
- 28.Prabdial-Sing N, Makhathini L, Smit SB, Manamela MJ, Motaze NV, Cohen C, et al. Hepatitis B sero-prevalence in children under 15 years of age in South Africa using residual samples from community-based febrile rash surveillance. PLoS One. 2019;14:e0217415. [DOI] [PMC free article] [PubMed] [Google Scholar]
- 29.Amponsah-Dacosta E, Lebelo RL, Rakgole JN, Burnett RJ, Selabe SG, Mphahlele MJ. Evidence for a change in the epidemiology of hepatitis B virus infection after nearly two decades of universal hepatitis B vaccination in South Africa. J Med Virol. 2014;86:918–24. [DOI] [PubMed] [Google Scholar]
- 30.Indolfi G, Easterbrook P, Dusheiko G, Siberry G, Chang MH, Thorne C, et al. Hepatitis B virus infection in children and adolescents. Lancet Gastroenterol Hepatol. 2019;4:466–76. [DOI] [PubMed] [Google Scholar]
- 31.Komatsu H. Hepatitis B virus: where do we stand and what is the next step for eradication? World J Gastroenterol. 2014;20:8998–9016. [DOI] [PMC free article] [PubMed] [Google Scholar]
- 32.Vermeulen M, Lelie N, Coleman C, Sykes W, Jacobs G, Swanevelder R, et al. Assessment of HIV transfusion transmission risk in South Africa: a 10-year analysis following implementation of individual donation nucleic acid amplification technology testing and donor demographics eligibility changes. Transfusion. 2019;59:267–76. [DOI] [PMC free article] [PubMed] [Google Scholar]