

Abstract
Background
Intensity of exercise is considered a key determinant of training response, however, no systematic review has investigated the effects of different levels of training intensity on exercise capacity, functional exercise capacity and health‐related quality of life (HRQoL) in people with chronic obstructive pulmonary disease (COPD). As type of training (continuous or interval) may also affect training response, the effects of the type of training in COPD also require investigation.
Objectives
To determine the effects of training intensity (higher versus lower) or type (continuous versus interval training) on primary outcomes in exercise capacity and secondary outcomes in symptoms and HRQoL for people with COPD.
Search methods
We searched for studies in any language from the Cochrane Airways Group Specialised Register, CENTRAL, MEDLINE, EMBASE, CINAHL, AMED, PsycINFO and PubMed. Searches were current as of June 2011.
Selection criteria
We included randomised controlled trials comparing higher training intensity to lower training intensity or comparing continuous training to interval training in people with COPD. We excluded studies that compared exercise training with no exercise training.
Data collection and analysis
We pooled results of comparable groups of studies and calculated the treatment effect and 95% confidence intervals (CI) using a random‐effects model. We made two separate comparisons of effects between: 1) higher and lower training intensity; 2) continuous and interval training. We contacted authors of missing data.
Main results
We analysed three included studies (231 participants) for comparisons between higher and lower‐intensity training and eight included studies (367 participants) for comparisons between continuous and interval training. Primary outcomes were outcomes at peak exercise (peak work rate, peak oxygen consumption, peak minute ventilation and lactate threshold), at isowork or isotime, endurance time on a constant work rate test and functional exercise capacity (six‐minute walk distance). When comparing higher versus lower‐intensity training, the pooled primary outcomes were endurance time and six‐minute walk distance. There were no significant differences in endurance time improvement (mean difference (MD) 1.07 minutes; 95% CI ‐1.53 to 3.67) and six‐minute walk distance improvement (MD 2.8 metres; 95% CI ‐10.1 to 15.6) following higher or lower‐intensity training. However, heterogeneity of the endurance time results between studies was significant. When comparing continuous and interval training, there were no significant differences in any of the primary outcomes, except for oxygen consumption at isotime (MD 0.08; 95% CI 0.01 to 0.16) but the treatment effect was not considered clinically important. According to the GRADE system, studies were of low to moderate quality.
Authors' conclusions
Comparisons between the higher and lower training intensity were limited due to the small number of included studies and participants. Consequently, there are insufficient data to draw any conclusions on exercise capacity, symptoms and HRQoL for this comparison. For comparisons between continuous and interval training, both appear to be equally effective in improving exercise capacity, symptoms and HRQoL.
Keywords: Humans; Bicycling; Bicycling/physiology; Exercise Therapy; Exercise Therapy/methods; Exercise Tolerance; Exercise Tolerance/physiology; Leg; Oxygen Consumption; Pulmonary Disease, Chronic Obstructive; Pulmonary Disease, Chronic Obstructive/rehabilitation; Quality of Life; Randomized Controlled Trials as Topic; Time Factors; Walking; Walking/physiology
Plain language summary
Intensity of stationary cycling, treadmill or ground walking as a mild form of exercise for people with chronic obstructive pulmonary disease (COPD)
Supervised lower limb endurance training programmes for people with COPD involve stationary cycling or treadmill or ground walking. The intensity of training is considered a key component to improve exercise capacity. As we wanted to explore whether more or less intense training is better for improving exercise capacity, symptoms and quality of life, we examined trials with higher or lower levels of training intensity in people with COPD.
Exercise training can be prescribed as interval or continuous. Interval training is brief periods (one to three minutes) of exercise at high intensity alternated with short periods of recovery whereas continuous training is completing the endurance training without a break. We compared interval training with continuous training to determine whether one type of training was superior to the other in gaining improvements in exercise capacity, symptoms and quality of life.
Conclusions
We found three studies comparing higher with lower‐intensity training. Due to a small number of studies and participants, data are limited in evaluating the effects of different levels of training intensity on exercise capacity, breathlessness and quality of life. We also found eight studies that compared continuous with interval training. There was no significant difference between continuous and interval training in improvements in exercise capacity, breathlessness and quality of life.
Summary of findings
for the main comparison.
| Interval training compared with continuous training for people with chronic obstructive pulmonary disease | |||||
|
Patient or population: people with chronic obstructive pulmonary disease Settings: pulmonary rehabilitation centres Intervention: interval training Comparison: continuous training | |||||
| Outcomes | Illustrative comparative risks* (95% CI) | No of participants (studies) | Quality of the evidence (GRADE) | Comments | |
| Assumed risk | Corresponding risk | ||||
| Continuous | Interval | ||||
|
Peak exercise capacity: Power (W) |
The mean change in work rate ranged across continuous training groups from 8.7 to 13 W | The mean change in work rate for the interval training groups was 0.6 W higher (1.7 lower to 2.8 W higher) | 367 (8) | +++O moderate1,3 | |
|
Peak exercise capacity: Peak oxygen consumption (VO2peak) (L/min) |
The mean change in VO2peak ranged across continuous training groups from 0.04 to 0.16 L/min | There was no difference in mean change in VO2peak for the interval training groups (0.05 lower to 0.05 L/min higher) | 188 (5) | +++O moderate1,2 | |
|
Peak exercise test: Lactate threshold (L/min) |
The mean change in lactate threshold ranged across continuous training groups from 0.08 to 0.12 L/min | The mean change in lactate threshold for the interval training groups was 0.01 L/min lower (0.07 lower to 0.06 L/min higher) | 94 (3) | +++O moderate4 | |
|
Peak exercise test: Isowork minute ventilation (VE) (L) |
The mean change in VE ranged across continuous training groups from ‐3 to 4 L | The mean change in VE for the interval training groups was 0.05 L higher (4.15 lower to 4.26 L higher) | 77 (2) | ++OO low5 | Negative change post‐intervention is favourable, indicating improvement |
|
Peak exercise test: Isowork dyspnoea score |
The mean change in isowork dyspnoea score in the continuous training group was ‐1.7 | The mean change in isowork dyspnoea score in the interval training group was 0.2 lower (0.55 lower to 0.15 higher) | 36 (1) | ++OO low5 | Negative change post‐intervention is favourable, indicating improvement |
|
Exercise tolerance: Endurance time (min) |
The mean change in endurance time in the continuous group was 18.7 minutes | The mean change in endurance time in the interval training group was 3.7 minutes shorter (10.8 shorter to 3.4 minutes longer) | 41 (1) | ++OO low5 | |
|
Functional exercise capacity: Six‐minute walk distance (m) |
The mean change in 6MWD ranged across continuous training groups from 32 to 46 m | The mean change in 6MWD in the interval training groups was 4.4m longer (10.1 shorter to 18.9m longer) | 287 (6) | ++OO low6 | |
|
Health‐related Quality of Life: Dyspnoea domain of the CRQ |
The mean change in the CRQ dyspnoea score ranged across continuous training groups from 3.7 to 8.4 points | The mean change in the CRQ dyspnoea score for the interval training groups was 1.26 lower (0.01 lower to 2.54 points higher) | 212 (4) | +++O moderate4 | |
| *The basis for the assumed risk (e.g. the median control group risk across studies) is provided in footnotes. The corresponding risk (and its 95% confidence interval) is based on the assumed risk in the comparison group. The corresponding risk is calculated as mean change in the continuous group minus the mean change in the interval group. For example, if the mean change of a measure in the interval groups is lower, the risk favours interval training, unless otherwise stated. CI: Confidence interval; CRQ: Chronic Respiratory Disease Questionnaire | |||||
| GRADE Working Group grades of evidence High quality: Further research is very unlikely to change our confidence in the estimate of effect. Moderate quality: Further research is likely to have an important impact on our confidence in the estimate of effect and may change the estimate. Low quality: Further research is very likely to have an important impact on our confidence in the estimate of effect and is likely to change the estimate. Very low quality: We are very uncertain about the estimate. | |||||
|
1Two studies showed limitations in design. Incomplete outcome data in one study. One study was not free of selective reporting. 2One study was weighted lightly in the meta‐analysis because the standard deviations were pooled as described in 'Methods'. 3One study provided unpublished data. 4One study was not free of selective reporting. 5Sparse data. There were many uncertainties in the study design. 6One study had limitations in design of study (incomplete outcome data). Two studies were weighted lightly in the meta‐analysis because the standard deviations were pooled as described in 'Methods'. Sparse data was also observed. | |||||
Background
In people with chronic obstructive pulmonary disease (COPD), reduced exercise capacity and participation in activities of daily living are often the result of ventilatory limitations, cardiac dysfunction, skeletal muscle dysfunction and reduced self confidence in physical exertion due to dyspnoea and sedentary lifestyle (Jones 2000; Nici 2006; Pepin 2007). Lower limb endurance exercise training, involving stationary cycling, treadmill‐walking or ground‐walking, is considered an essential component of many pulmonary rehabilitation programmes for people with COPD (Nici 2006; Ries 2007). There are well‐established reports that cycle exercise training can increase exercise capacity by improving the aerobic capability of the skeletal muscles (Maltais 1996b), reducing ventilatory limitations, such as dynamic hyperinflation and work of breathing, and by reducing dyspnoea at submaximal work rates in people with COPD (Porszasz 2005; Ries 2007). Although less investigated than cycle training, there is a growing body of evidence that walking exercise training improves exercise capacity, symptoms and quality of life in people with COPD (Cockram 2006; Hernandez 2000; Leung 2010; Probst 2006). Gains in exercise capacity following exercise training in COPD have been measured by increased peak oxygen uptake (VO2peak) or peak work rate (Wpeak) (Gosselink 1997; Maltais 1997; Vogiatzis 1999), longer endurance exercise time (Ries 1995; Pitta 2004) and greater six‐minute walk distance (6MWD) (Pitta 2004; Troosters 2000).
An appropriate exercise prescription is important to elicit these physiological adaptations. Components of exercise prescription include intensity, frequency, duration, type (i.e. continuous or interval training) and mode of exercise (for example, cycling or walking). Given that intensity of exercise is recognised as a key determinant of training response (ACSM 1998; Casaburi 1992), there has been much discourse regarding the optimal level of training intensity that engenders physiological adaptations without compromising adherence to exercise (Butcher 2006; Casaburi 1992; Nici 2006). The multifactorial limitations to exercise in people with COPD make defining and prescribing optimal exercise intensity even more challenging (Troosters 2005). In COPD, maximal exercise tests are often terminated due to ventilatory limitation before reaching maximal cardiovascular limits (Roca 1997).
It is therefore pertinent to identify the effective training intensity in COPD. Guidelines for exercise in COPD recommend the minimum intensity at 40% to 50% of VO2peak (ACSM 2006; Cooper 2001) or 50% to 60% of Wpeak (BTS 2001; Nici 2006; Troosters 2005). There is consensus that higher‐intensity training elicits greater physiological benefits in people with COPD (Nici 2006; Troosters 2005). In healthy untrained individuals, a systematic review has reported greater physiological responses for higher‐intensity training than for lower‐intensity training (Swain 2002). However, the proposition that greater training benefits are associated with higher‐intensity training has not been evaluated by meta‐analysis in COPD. Guidelines recognise the need for more rigorous investigation of whether higher‐intensity training translates into greater improvements in key patient‐centred outcomes such as functional exercise capacity (walking distance), dyspnoea perception and health‐related quality of life (HRQoL) compared to lower‐intensity training in people with COPD (Ries 2007). High‐intensity training has been cited in some studies as being above 60% Wpeak and low‐intensity training as equal to or below 60% Wpeak (Gosselink 1997; Nici 2006; Puhan 2005; Ries 2007). However, these values are only arbitrary and it is important to consider that exercise intensity is a continuum. Thus, this review does not attempt to compare training effects between high and low intensity based on the above values nor to define optimal training levels, but rather, compare training effects between higher and lower intensity that have been reported in the available literature.
Interval training has been suggested as an alternative to continuous training to enable patients with COPD to tolerate higher‐intensity cycling or walking exercise training (Gosselink 1997; Puhan 2005; Sabapathy 2004). Interval training is a type of training with brief periods of one to three minutes at high intensity alternated with short periods of recovery while continuous training has no rests or periods of low work rate throughout the duration of exercise. A meta‐analysis has been performed which compared the effects of interval and continuous training on exercise capacity, symptoms and quality of life in people with COPD (Beauchamp 2010). No significant differences were found between interval and continuous training.
Although there are published consensus statements and narrative reviews on exercise prescription for patients with COPD, the effects of different levels of training intensity on exercise capacity, functional performance and HRQoL have not been evaluated in a systematic review. In this systematic review, the effect of the type of training (continuous or interval) will also be analysed, which will add to or update a previous review (Beauchamp 2010).
Objectives
To determine the effects of training intensity (higher versus lower) or type (continuous versus interval training) on exercise capacity, functional exercise capacity and HRQoL in people with COPD.
Methods
Criteria for considering studies for this review
Types of studies
We considered randomised controlled trials only.
Types of participants
We included trials in which all of the participants were diagnosed with COPD defined by best post‐bronchodilator forced expiratory volume in one second (FEV1)/forced vital capacity (FVC) ratio < 0.7 (GOLD 2010).
Types of interventions
Trials of lower limb exercise training of 12 sessions or more were eligible for inclusion if they compared exercise interventions:
a) of different intensities (with type, duration, frequency and mode of exercise the same); OR
b) of different types (with intensity, duration, frequency and mode of exercise the same);
Recognising that the total volume of work per session is usually matched between groups by manipulating intensity and duration, we also included trials if they compared exercise interventions:
c) of different intensities (with volume of work per session, type, frequency and mode of exercise the same); OR
d) of different types (with volume of work per session, frequency and mode of exercise the same).
For intensity, we have chosen a difference of at least 10 per cent of peak values between higher and lower levels of intensity as the criteria for eligibility of trials given the narrow range between the minimum effective training intensity (50% Wpeak) (Nici 2006; Troosters 2005) and the lowest value of the 'high' intensity (> 60% Wpeak) (Nici 2006). An explicit measure of intensity was required for the trial to be included.
We excluded trials that only compared exercise training with no exercise training. We also excluded trials that used different modalities between study groups (for instance, cycle training in one group versus walking training in the other group).
Types of outcome measures
We used outcomes measured immediately post‐intervention in this review. We did not use outcome measures at periods following completion of the intervention in order to determine retention of training effects in the analysis.
Primary outcomes
Peak exercise: peak work rate (watts, W), peak VO2, peak minute ventilation (VE) and lactate threshold (LT) during incremental exercise tests to peak work capacity.
Isowork or isotime: VO2, VE and lactate from peak or constant work rate exercise tests.
Endurance time of constant work rate exercise test: cycle or treadmill exercise, endurance shuttle walk test.
Functional exercise capacity: six‐minute walk distance (6MWD) or incremental shuttle walk distance (ISWD).
Secondary outcomes
Symptom scores: dyspnoea or leg fatigue at end of peak exercise, and at isowork or isotime.
Health‐related quality of life (HRQoL): St George's Respiratory Questionnaire (SGRQ) or Chronic Respiratory Disease Questionnaire (CRQ) or SF‐12 or SF‐36.
Muscle strength.
Search methods for identification of studies
Electronic searches
We identified trials using the Cochrane Airways Group Specialised Register of trials, which is derived from systematic searches of bibliographic databases including the Cochrane Central Register of Controlled Trials (CENTRAL), MEDLINE, EMBASE, CINAHL, AMED and PsycINFO, and handsearching of respiratory journals and scientific meeting abstracts (please see the Airways Group search methods for further details). We searched all records in any language in the Specialised Register coded as 'COPD' using the following terms:
(exercis* or train* or "lower limb" or leg* or cycle or cycling OR bicycle OR walk* OR treadmill or *ergometer) AND (intens* or endur* or tolerance or aerobic or anaerobic or interval* or intermittent* or continuous* or discontinuous*)
In order to minimise the chance of missing potential studies, we conducted independent searches of other electronic databases (MEDLINE (1948 to September 2010), AMED (1985 to September 2010), CINAHL (1979 to September 2010), PubMed (1948 to September 2010) and EMBASE (1945 to September 2010)). The full search strategies are listed in Appendix 1; Appendix 2; Appendix 3; Appendix 4 and Appendix 5.
Searches were current up to June 2011.
Searching other resources
We handsearched reference lists of all included studies, review articles and latest conference proceedings for qualifying studies. We contacted authors of abstracts judged to be potentially eligible to identify further published studies.
Data collection and analysis
Selection of studies
Two of us (RZ and MGM) independently examined titles and abstracts of citations identified in the literature searches for categorisation as follows:
INCLUDE: study categorically meets all review criteria;
EXCLUDE: study clearly does not meet all review criteria;
UNSURE: study appears to meet some review criteria but insufficient information can be gleaned to categorically determine relevance.
After screening titles and abstracts, we excluded citations that were clearly irrelevant to the review. Two of us (RZ, MGM) independently assessed full‐text copies of studies in categories 1 and 3 for more detailed evaluation. We resolved disagreement by consensus and when any disagreement could not be resolved, we consulted a third review author (JAA). We measured agreement between review authors on study inclusion using Kappa statistics (ĸ value).
Data extraction and management
Two of us (RZ, MM) independently extracted data from included studies from the full‐text references onto standard data extraction forms. Data collected included characteristics of the studies (methods, participants, interventions and outcomes). If there were two or more detailed reports of the same study, we performed data extraction separately for these articles and collated them into a single data extraction form. When disagreement could not be resolved by consensus, we consulted JAA. Where data were missing, we contacted authors to provide details of the missing data. One of us (RZ) entered the data into Review Manager (RevMan 2011), with random checks on accuracy.
Where values were presented in figures or bar graphs, we electronically copied these graphs onto software that digitised the co‐ordinates of the points on the graphs and extracted the values required for the review (Engauge Digitizer 4.1, Free Software Foundation Inc).
Assessment of risk of bias in included studies
Two of us (RZ and MM) independently assessed the risk of bias in the included studies. We evaluated the studies against the following items using the Cochrane Collaboration's 'Risk of bias assessment' tool (Higgins 2009).
Sequence generation
Allocation concealment
Blinding of participants, investigators and outcome assessors
Incomplete outcome data
Selective outcome reporting
We judged each item as high, low or unclear risk of bias and included statements from the full‐text manuscripts to justify the judgements made.
Measures of treatment effect
For each outcome measure, we extracted and used the mean difference (MD) with its standard deviation (SD). We preferred change‐from‐baseline scores to final scores as change scores reduce inter‐subject variance. If possible, for each outcome, we compared the common treatment effect and the limits of 95% confidence interval (CI) around the effect to the minimal important difference (MID) to determine the extent of the clinical benefit. The MID is defined as "the smallest difference in score corresponding to the smallest difference perceived by the average patient that would mandate, in the absence of troublesome side effects and excessive cost, a change in patient management" (Jaeschke 1989). We used the following MIDs.
10 watts for peak work rate on a cycle ergometer (Sutherland 2004).
35 metres (95% CI 29 to 42) for six‐minute walk distance (Puhan 2008).
47.5 metres (95% CI 38.6 to 56.5) for incremental shuttle walk distance (Singh 2008).
1.68 minutes (95% CI 1.43 to 1.93) for endurance cycle time (Puente‐Maestu 2009).
Four‐point improvement (i.e. a reduction in score) for the total score of SGRQ (Jones 1992).
0.5‐point improvement in each item of each domain of CRQ. Therefore, the MIDs were 2.5 points for dyspnoea domain, 2 points for fatigue, 3.5 points for emotional, 2 points for mastery and 10 points improvement for total CRQ (Jaeschke 1989).
One‐point improvement (i.e. a reduction in score) in Borg dyspnoea rating (Ries 2005).
Where different scales were used for measuring the same outcome, standardising the mean differences to a uniform scale before they can be pooled is recommended (Higgins 2009). The standardised mean difference (SMD) refers to the size of the treatment effect (mean difference) in each study in proportion to the variability (standard deviation) observed in that study and is therefore unitless. Studies where the mean difference is the same proportion of the standard deviation will have the same SMD, regardless of the actual scales used to make the measurements. However, the disadvantage of this measure is the inability to reflect real differences in variability between study groups (Higgins 2009).
Dealing with missing data
We contacted authors to request any missing data. When data were assumed to be missing at random, we ignored the missing data and analysed the available data. If change scores had not been presented in the study, we carried out one of the following procedures:
1) Subtracted the post‐intervention means from the baseline means:
mean change scores = (mean Xpost ‐ mean Xbaseline)
2) Imputed from other studies if baseline or post‐intervention means were missing.
Missing standard deviations of change scores were obtained by one of the following three methods:
1) Pooled the SDs of baseline and post‐intervention means according to this equation (Dunst 2004):
SD of mean change scores = √((SD2post + SD2baseline)/2).
2) Converted other available information, such as standard error and confidence intervals, into SD.
3) Imputed from other studies if baseline or post‐intervention means were missing (Higgins 2009).
We performed sensitivity analyses to assess how robust the results were to alternative meta‐analysis without the imputed data or assumptions made with missing data.
Assessment of heterogeneity
We assessed heterogeneity among studies using the Chi2 test and the I2 statistic. The Chi2 test measures the deviation of observed effect sizes from the underlying overall effect. A high Chi2 value, or low P value (relative to its degrees of freedom), provides evidence of heterogeneity of intervention effects (i.e. variation in effect estimates beyond chance) (Higgins 2009). When studies have small sample sizes or are few in number, it is known that the Chi2 test has low power to detect true heterogeneity, thus care must be taken in the interpretation of this test. While a statistically significant result may indicate a problem with heterogeneity, a non‐significant result does not mean that there is no evidence of heterogeneity. As a result, we used a P value of 0.10 in this review to determine statistical significance. The I2 statistic quantifies inconsistency across studies in assessing its impact on the meta‐analyses. It describes the percentage of the variability in treatment effect due to heterogeneity rather than chance alone. As a rough guide: 25% variability is considered low heterogeneity, 50% moderate and 75% high (Higgins 2009). It is recommended that the I2 statistic is interpreted with the P value to ascertain evidence of heterogeneity.
Data synthesis
We performed separate meta‐analyses of studies that compared different levels of training intensity and studies that compared different types of training. We pooled data in each meta‐analysis using the random‐effects model as treatment effects between studies were expected to vary. The random‐effects model incorporates any between‐study heterogeneity into the meta‐analysis. We selected the mean difference (MD) when combining data. We used forest plots to compare results across studies.
Subgroup analysis and investigation of heterogeneity
We performed subgroup analysis to explore possible sources of heterogeneity when there was significant heterogeneity as follows:
Volume of work per session: total volume of work per session, often calculated as the product of intensity and duration of exercise (Arnardottir 2007; Casaburi 1991), has been considered an important determinant of training response (Cooper 2001; Nici 2006). In trials where intensity was the variable being examined, duration of training session has sometimes been adjusted accordingly to make the total volume of work equivalent in both groups (i.e. shorter duration session for the group training at higher intensity, and longer duration session for the group training at lower intensity). However, in some trials, duration may not have been adjusted, resulting in more total volume of work performed by the higher‐intensity training group.
Training modes: endurance exercise training performed in trials may be cycle‐based, walking‐based or a combination of both. Training performed on modes specific to those used in the exercise tests may result in more favourable treatment effects than training on modes not specific to the mode of exercise tests (Nici 2006). The choice of mode of exercise tests in relation to the training mode may therefore introduce heterogeneity in the treatment effects.
Sensitivity analysis
We performed sensitivity analyses to explore the robustness of the results obtained from primary meta‐analysis compared to alternative analysis that excluded studies with questionable elements arising from certain methodological qualities or from decisions made by the review authors that might influence the common effect estimates or might result in significant heterogeneity. We performed sensitivity analysis if:
change scores were imputed;
abstracts whose results had not been published in full‐text articles were included in the meta‐analysis;
there was clear evidence of poor blinding, allocation concealment or any other source of risk of bias or confounders to treatment effects.
Results
Description of studies
See: Characteristics of included studies; Characteristics of excluded studies.
Results of the search
We identified a total of 2198 citations from all searches, including an independent search in September 2010 and an update search run in June 2011 with the assistance of Cochrane Airways Group. After screening titles and abstracts, we retrieved 70 full‐text articles and one abstract (Moon 2009) for more detailed evaluation. We identified three additional citations (Kaelin 1999; Kortianou 2010; Santos 2010) from handsearching reference lists and from recent conference proceedings. After evaluation, we deemed 13 studies (eight main trials, two secondary reports and three abstracts from conference proceedings) eligible for inclusion in the review while we excluded 59 studies with reasons provided in Characteristics of excluded studies. We placed two studies (Moon 2009; Wen 2008) in the category 'awaiting classification' because one citation was an abstract from a conference proceeding which was unclear in defining levels of exercise intensity and no full text was available (Moon 2009). The other study awaiting classification was written in a foreign language and has not been translated (Wen 2008). However, five other studies written in foreign languages were translated (Guell 2008; Hentschel 2002; Ruiz 2004; Varga 2005; Wurtemberger 2001). A schematic flow diagram illustrates the process of initial searching to final inclusion of studies (Figure 1).
1.
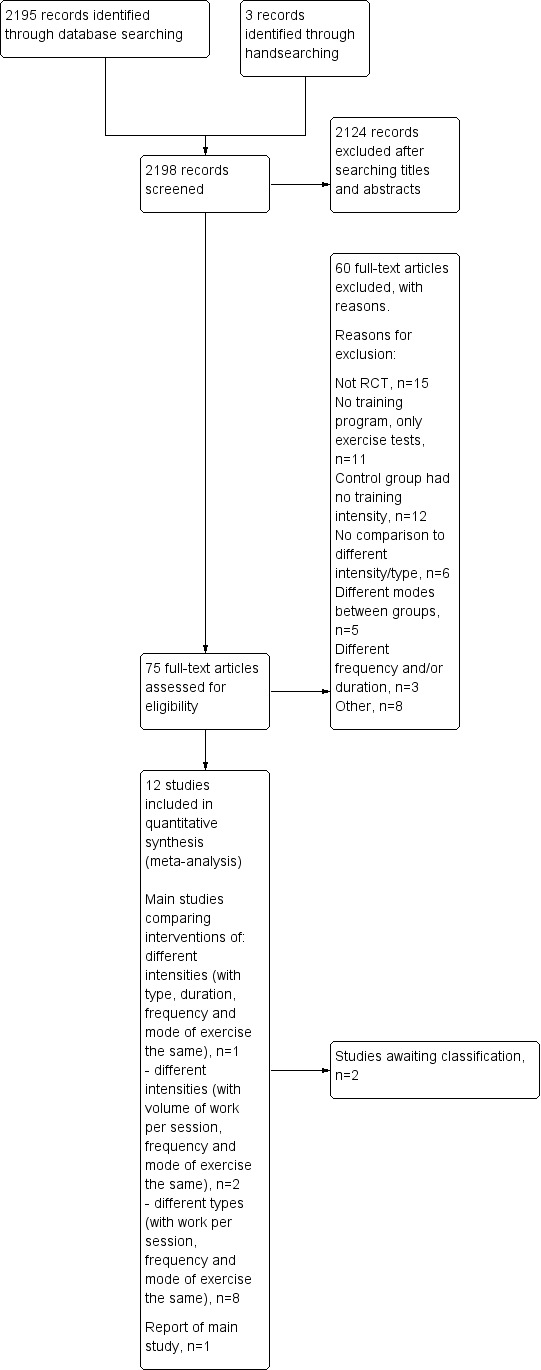
Study flow diagram.
Agreement between RZ and MGM was 0.86, as calculated using the Kappa statistic. Although the Kappa value reflects excellent agreement (Orwin 1994), it does not really convey the impact of any disagreements on the review (Higgins 2009). One of the disagreements regarding the eligibility of one of the studies (Puhan 2006) led to a decision to include studies of exercise training that were less than four weeks long but were at least 12 sessions. This requested change to inclusion criteria was approved by the editorial team of the Cochrane Airways Group.
Included studies
There were 11 included studies involving 598 patients included in this review. Full descriptions of the methods, participants, interventions and outcomes of these studies can be found in the Characteristics of included studies table.
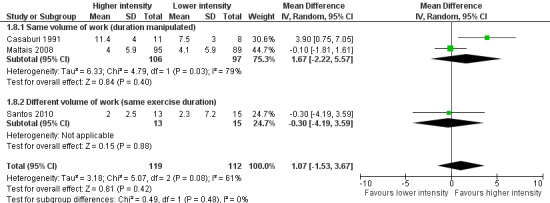
Three included studies on 231 participants compared outcomes of higher and lower intensity, which we subsequently separated into two subgroups: 1) those comparing the two levels of intensity with same volume of work by manipulating exercise duration (Casaburi 1991; Maltais 2008); and 2) those comparing the two levels of intensity but with different volume of work due to exercise duration being the same (Santos 2010). All studies performed cycle training with some proportion of participants in the study by Santos et al (Santos 2010) performing treadmill‐walking exercise (proportion unknown). No participants performed a combination of cycle and walking training. In all three studies, the group with a higher‐intensity trained at 80% Wpeak. The group with a lower intensity trained at 50% Wpeak (Casaburi 1991) or 60% Wpeak (Maltais 2008; Santos 2010).
Eight included studies on 367 participants compared continuous training with interval training (Arnardottir 2007; Kortianou 2010; Mador 2009; Nasis 2009; Puhan 2006; Varga 2007; Vogiatzis 2002; Vogiatzis 2005). Of these eight studies, one study (Puhan 2006) compared intervention groups which performed different volumes of work. Intervention groups performed cycle training in seven studies (Arnardottir 2007; Kortianou 2010; Nasis 2009; Puhan 2006; Varga 2007; Vogiatzis 2002; Vogiatzis 2005) while intervention groups performed a combination of cycle and treadmill training in one study (Mador 2009).
All 11 studies presented similar inclusion and exclusion criteria. The common inclusion criteria were stable COPD with a ratio of FEV1/FVC of less than 0.7 and a change of FEV1 post‐bronchodilator less than 12%.
Citations included two abstracts (Kortianou 2010; Santos 2010). Related full‐text manuscripts could not be found for these studies. Both study authors responded to the review authors' correspondence and provided their unpublished data (Kortianou 2010; Santos 2010).
Excluded studies
We excluded 59 studies for several reasons. The common reasons were that the studies were not randomised controlled trials (RCT) (n = 15), did not evaluate exercise training in the protocols but only reported acute physiological responses from exercise tests (n = 11), or were studies with control groups not prescribed any exercise training (n = 12). A record of the main reason for excluding each study is provided in Characteristics of excluded studies.
Risk of bias in included studies
Figure 2 illustrates a summary of our judgements on each risk of bias item of each included study.
2.
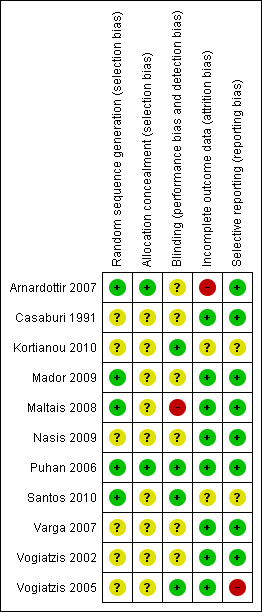
'Risk of bias' summary: review authors' judgements about each risk of bias item for each included study
Allocation
1) Higher intensity versus lower intensity
On random sequence generation, two studies (Maltais 2008; Santos 2010) clearly stated adequate sequence generation and we judged them to be at low risk of bias, while one study (Casaburi 1991) did not report any sequence generation and we judged it to be at unclear risk of bias. The two studies at low risk of selection bias used computer‐generated blocks of two to four participants for allocation.
On allocation concealment, one study (Maltais 2008) reported that 'study personnel were unaware' of the way allocation sequence was generated but did not specify the method of concealment; we therefore judged it to be at unclear risk of bias. Two other studies (Casaburi 1991; Santos 2010) were also declared to be at unclear risk in this aspect of selection bias as no reports were found.
2) Continuous versus interval training
Of the eight included studies, only three reported adequate sequence generation (Arnardottir 2007; Mador 2009; Puhan 2006) and we judged them to be at low risk of bias. Two of these four studies reported using computer‐generated block randomisation, i.e. allocating participants into blocks of three to five (Arnardottir 2007; Mador 2009). The third study utilised a centralised computerised minimisation via an online central randomisation tool (Puhan 2006). We judged the remaining studies to be at unclear of risk of bias (Kortianou 2010; Nasis 2009; Varga 2007; Vogiatzis 2002; Vogiatzis 2005).
Allocation concealment was explicitly reported in two studies ‐ via a closed envelope (Arnardottir 2007) and computerised minimisation (Puhan 2006). We judged one study to be at unclear risk of bias because it only stated that randomisation was concealed without explaining how (Mador 2009). The remaining five studies did not report any form of concealment and we judged them to be at unclear risk of bias for this domain, even after we contacted the authors for clarification (Kortianou 2010; Nasis 2009; Varga 2007; Vogiatzis 2002; Vogiatzis 2005).
Blinding
1) Higher intensity versus lower intensity
Blinding was performed in one study which we judged to be at low risk of bias (Santos 2010). In one study, it was unclear if blinding was performed (Casaburi 1991). One study acknowledged that lack of blinding was a design limitation which we judged to be at high risk of bias (Maltais 2008). In the only study where blinding was performed, only patients were blinded to training intensities (author's correspondence) (Santos 2010).
2) Continuous versus interval
Blinding was reported in manuscripts or in subsequent personal correspondence in three studies which we judged to be at low risk of bias (Kortianou 2010; Puhan 2006; Vogiatzis 2005). All participants and either assessors or trainers were blinded in these studies. It was unclear, however, whether blinding was performed in the remaining five studies (Arnardottir 2007; Mador 2009; Nasis 2009; Varga 2007; Vogiatzis 2002).
Incomplete outcome data
1) Higher intensity versus lower intensity
Complete outcome data were reported in two studies which we judged to be at low risk of bias (Casaburi 1991; Maltais 2008). One study performed intention‐to‐treat analysis (Maltais 2008) while another reported exclusion of participants at the exercise‐testing stage due to failure to meet certain pre‐specified exercise targets (Casaburi 1991). One study was in abstract form (Santos 2010) and therefore it was difficult to ascertain if data were complete.
2) Continuous versus interval training
Six studies presented complete outcome data, reported and excluded withdrawals and we judged them to be at low risk of bias (Mador 2009; Nasis 2009; Puhan 2006; Varga 2007; Vogiatzis 2002; Vogiatzis 2005), whereas two studies were unclear in this aspect of potential bias (Arnardottir 2007; Kortianou 2010). One of the two studies did not specify the number of withdrawals in each group, although the reasons for withdrawing were reported (Arnardottir 2007). Also, it is worth noting that those who were withdrawn (or were non‐completers, as described in this study) had more severe lung disease than the group that completed training, which might have influenced the outcomes of this study. Furthermore, the proportion of participants who dropped out was high at 40% (Arnardottir 2007). In the other study, it was also difficult to ascertain if complete data were included (Kortianou 2010) as insufficient details were available despite correspondence with the author.
Selective reporting
1) Higher intensity versus lower intensity
Except for the abstract (Santos 2010) which we judged to be at unclear risk of bias, all pre‐specified outcome measures and data analyses mentioned in the protocol of the other two studies (Casaburi 1991; Maltais 2008) were reported explicitly either in text, tables or figures and were therefore judged at low risk of bias.
2) Continuous versus interval training
Six studies were free of selective reporting which we judged to be at low risk of bias (Arnardottir 2007; Mador 2009; Nasis 2009; Puhan 2006; Varga 2007; Vogiatzis 2002). All pre‐specified outcome measures and data analysis mentioned in the protocol were reported explicitly either in text, tables or figures in these studies. We deemed only one study to be at high risk of bias because physiologic measures were either missing standard errors or not compared between groups (Vogiatzis 2005). Although these were secondary measures in the study, the review authors felt the measures carried high importance and, thus, were required to be reported clearly. We judged the only abstract to be at unclear risk of bias as there were insufficient details for judgement (Kortianou 2010).
Effects of interventions
See: Table 1
1. Higher intensity versus lower intensity
Slight but important differences were found in the methodology of the included studies. Two studies examined exercise training of different intensity levels with the duration of training manipulated to produce the same volume of work (Casaburi 1991; Maltais 2008), while the other study compared two different levels of intensity with the same duration so there was a different volume of work performed (Santos 2010). As a result, we conducted subgroup analysis on different volume of work between studies, as indicated in 'Methods'. A second subgroup analysis on differences in modes of training, as indicated in 'Methods', was not required since all studies performed cycle training (Casaburi 1991; Maltais 2008; Santos 2010) with a small (unknown) proportion of participants in the study by Santos et al (Santos 2010) performing treadmill‐walking exercise. For these participants, the mode of exercise testing was the same as the training mode, i.e. treadmill (Santos 2010).
We calculated the treatment effect or mean difference (MD) by taking the difference in mean values of the higher‐intensity training group and mean values of the lower‐intensity training group. Therefore, a positive MD or the 95% confidence interval (CI) around the MD indicates a favourable effect for higher‐intensity training group and a negative MD or 95% CI favours lower‐intensity training group, provided that change scores indicating improvement following intervention are positive. Where improvement in outcomes is indicated by negative change scores following intervention, such as outcomes at isowork and isotime, symptoms and St George's Respiratory Questionnaire (SGRQ) scores, a negative MD or CI favours higher‐intensity training group and a positive MD or CI favours lower‐intensity training group.
Primary outcomes: Peak exercise
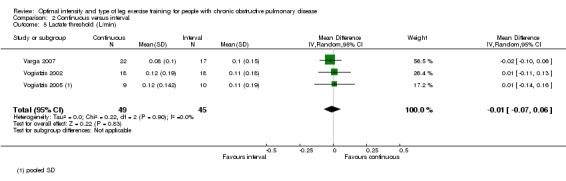
Only one study reported peak work rate as an outcome measure (Santos 2010). The peak work rate between the higher and lower‐intensity training groups was not statistically significant (MD ‐10.6 W; 95% CI ‐36.6 to 15.4; Analysis 1.1; Santos 2010). Only 15 participants in the lower‐intensity group were compared to 13 participants in the higher‐intensity group. Lactate threshold was the other outcome measure from an incremental peak test and measured in only one study (Casaburi 1991). The treatment effect for lactate threshold was 0.1 L/min in favour of the higher‐intensity group and the effect was not significant (95% CI ‐0.02 to 0.22 L/min; Analysis 1.2): a total of 11 participants in the higher‐intensity group were compared to eight participants in the lower‐intensity group.
1.1. Analysis.
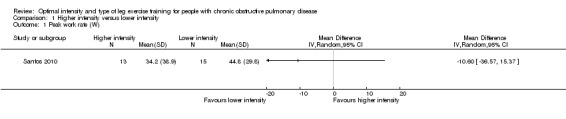
Comparison 1 Higher intensity versus lower intensity, Outcome 1 Peak work rate (W).
1.2. Analysis.

Comparison 1 Higher intensity versus lower intensity, Outcome 2 Lactate threshold (L/min).
Primary outcomes: Isowork or isotime
At isowork and isotime exercise, a negative change indicates an improved physiologic change. Therefore, a negative MD or 95% CI favours higher‐intensity training group. Isowork refers to the same work rate (often in an incremental test) where physiologic outcomes are measured and compared pre and post‐intervention. Isotime refers to the same time point in a constant work rate test where outcomes are compared pre and post‐intervention. Only one study measured outcomes at isowork and isotime with 11 participants in the higher‐intensity group and eight participants in the lower‐intensity group (Casaburi 1991). There was no significant effect in isowork VO2 (MD 0.02 L/min; 95% CI ‐0.22 to 0.18; Analysis 1.3) and isowork VE (MD ‐6.30 L/min; 95% CI ‐16.0 to 3.39 L/min; Analysis 1.4). In contrast, the treatment effect for isowork lactate was ‐1.70 mmol/L in favour of the higher‐intensity group and the effect was significant (95% CI ‐3.20 to ‐0.20 mmol/L; Analysis 1.5). At isotime, VO2 was not significantly different between the two groups (MD ‐0.06 L/min; 95% CI ‐0.18 to 0.06; Analysis 1.6), but the higher‐intensity group had a significantly lower VE than the lower‐intensity group (MD ‐5.90 L/min; 95% CI ‐9.76 to ‐2.04; Analysis 1.7, Casaburi 1991).
1.3. Analysis.
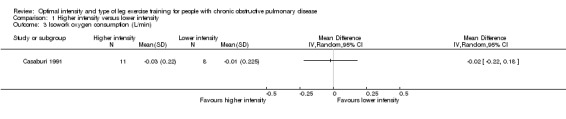
Comparison 1 Higher intensity versus lower intensity, Outcome 3 Isowork oxygen consumption (L/min).
1.4. Analysis.

Comparison 1 Higher intensity versus lower intensity, Outcome 4 Isowork minute ventilation (L/min).
1.5. Analysis.
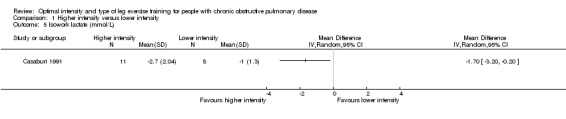
Comparison 1 Higher intensity versus lower intensity, Outcome 5 Isowork lactate (mmol/L).
1.6. Analysis.
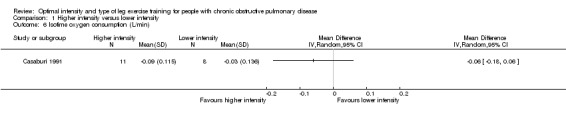
Comparison 1 Higher intensity versus lower intensity, Outcome 6 Isotime oxygen consumption (L/min).
1.7. Analysis.
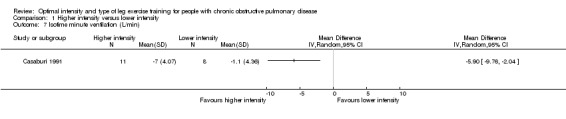
Comparison 1 Higher intensity versus lower intensity, Outcome 7 Isotime minute ventilation (L/min).
Primary outcomes: Endurance time of constant work rate exercise test
Endurance exercise tolerance was measured by time to exhaustion on constant work rate cycle ergometer (Casaburi 1991; Maltais 2008; Santos 2010) or constant work on treadmill (Santos 2010). We pooled all three studies in the meta‐analysis where a total of 119 participants in the higher‐intensity group were compared to 112 participants in the lower‐intensity group. The treatment effect in endurance time was 1.07 minutes in favour of the higher‐intensity group, but the effect was not significant (95% CI ‐1.53 to 3.67 min; Analysis 1.8). Heterogeneity between studies was evident (I2 = 61%, P < 0.1; Analysis 1.8). Lower‐intensity group heterogeneity also existed between studies. Different modes of testing (cycling or treadmill‐walking) could possibly contribute to this heterogeneity. Two studies performed constant work rate test on a cycle ergometer (Casaburi 1991; Maltais 2008) and one study performed the test on either cycle ergometer or treadmill depending on patient's choice of mode of training and therefore the mode of the peak incremental test (Santos 2010).
1.8. Analysis.
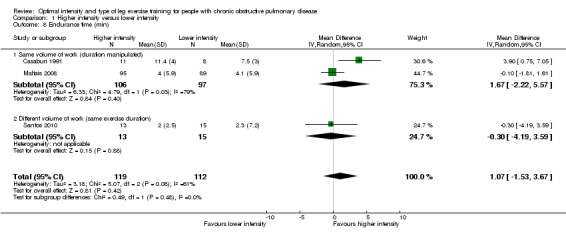
Comparison 1 Higher intensity versus lower intensity, Outcome 8 Endurance time (min).
Primary outcomes: Functional exercise capacity
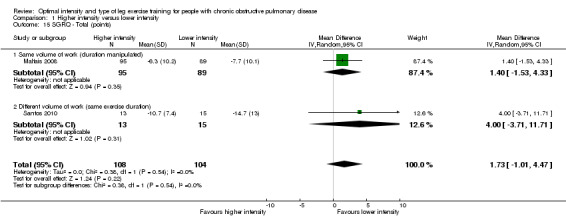
Functional exercise capacity was assessed using the six‐minute walk distance (6MWD) from the six‐minute walk test (6MWT). We pooled two studies for this outcome with a total of 108 participants in the higher‐intensity group and 104 participants in the lower‐intensity group (Maltais 2008; Santos 2010). The majority of these participants trained on cycle ergometer. There was no significant difference in improvement in 6MWD between the two levels of training intensity (MD 2.75 metres; 95% CI ‐10.08 to 15.59; Analysis 1.9). No heterogeneity was found.
1.9. Analysis.
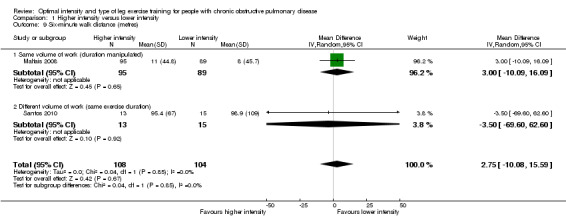
Comparison 1 Higher intensity versus lower intensity, Outcome 9 Six‐minute walk distance (metres).
Secondary outcomes: Symptoms
Dyspnoea and leg fatigue have been recognised as major symptoms limiting exercise in people with COPD (Jones 2000; Man 2003). The extent of symptoms is generally measured by the Borg Modified Category Ratio (CR) 0‐10 scores. Lower scores at submaximal workloads indicate reduced sensation in symptoms, therefore a negative change post‐intervention indicates improvement in symptoms (Borg 1982). Therefore, a larger negative change (greater improvement) in the higher‐intensity group than the lower‐intensity group results in a negative MD or 95% CI in favour of the higher‐intensity group.
Dyspnoea at the end of the peak test (peak dyspnoea) was measured in only one study involving 13 participants in the higher‐intensity group and 15 in the lower‐intensity group (Santos 2010). The treatment effect for peak dyspnoea was ‐1.40 points in favour of the higher‐intensity group and was significant (95% CI ‐2.30 to ‐0.50; Analysis 1.10). There were no comparisons in peak leg fatigue or symptoms at isowork between interventions.
1.10. Analysis.
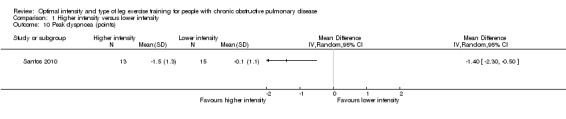
Comparison 1 Higher intensity versus lower intensity, Outcome 10 Peak dyspnoea (points).
Secondary outcomes: Health‐related quality of life (HRQoL)
HRQoL was measured by both the Chronic Respiratory Disease Questionnaire (CRQ) and the St George's Respiratory Questionnaire (SGRQ). CRQ was used as an outcome measure in one study (Maltais 2008) with a total of 109 participants in the higher‐intensity group and 107 in the lower‐intensity group. An increase in CRQ scores post‐intervention indicates an improvement in HRQoL. CRQ domain scores for Dyspnoea (MD ‐0.06 point; 95% CI ‐0.32 to 0.20; Analysis 1.11), Fatigue (MD 0.10 point; 95% CI ‐0.17 to 0.37; Analysis 1.12), Emotional (MD 0.03 point; 95% CI ‐0.18 to 0.24; Analysis 1.13) and Mastery (MD 0.02 point; 95% CI ‐0.21 to 0.25; Analysis 1.14) showed no significant difference between higher and lower‐intensity training. In this study, the scores represent changes in mean score per item in each domain (Maltais 2008).
1.11. Analysis.

Comparison 1 Higher intensity versus lower intensity, Outcome 11 CRQ ‐ Dyspnoea (points).
1.12. Analysis.
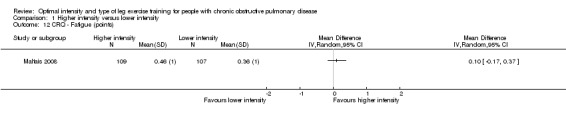
Comparison 1 Higher intensity versus lower intensity, Outcome 12 CRQ ‐ Fatigue (points).
1.13. Analysis.

Comparison 1 Higher intensity versus lower intensity, Outcome 13 CRQ ‐ Emotional (points).
1.14. Analysis.
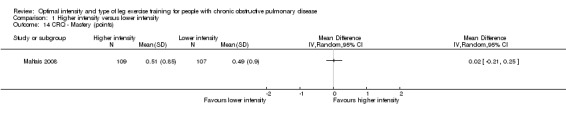
Comparison 1 Higher intensity versus lower intensity, Outcome 14 CRQ ‐ Mastery (points).
SGRQ was used in two studies (Maltais 2008; Santos 2010) with a total of 108 participants in the higher‐intensity group and 104 in the lower‐intensity group. Lower SGRQ scores indicate better HRQoL (Jones 1992). Therefore, a negative MD or CI favours higher‐intensity group. All domains of SGRQ showed favourable treatment effects in the lower‐intensity group: Total SGRQ score (MD 1.73 points; 95% CI ‐1.01 to 4.47; Analysis 1.15) and SGRQ domain scores of Symptoms (MD 5.60 points; 95% CI 1.05 to 10.15; Analysis 1.16), Impacts (MD 0.56 point; 95% CI ‐2.63 to 3.75; Analysis 1.17) and Activity (MD 1.45 points; 95% CI ‐3.47 to 6.37; Analysis 1.18), but only the treatment effect in the symptoms domain was significant. No heterogeneity was found, despite the differences in the subgroups.
1.15. Analysis.
Comparison 1 Higher intensity versus lower intensity, Outcome 15 SGRQ ‐ Total (points).
1.16. Analysis.
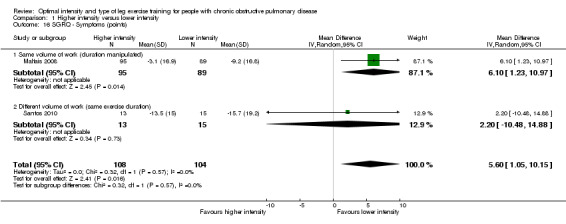
Comparison 1 Higher intensity versus lower intensity, Outcome 16 SGRQ ‐ Symptoms (points).
1.17. Analysis.
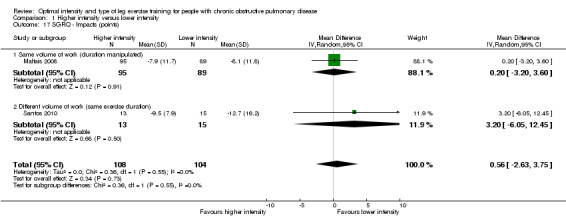
Comparison 1 Higher intensity versus lower intensity, Outcome 17 SGRQ ‐ Impacts (points).
1.18. Analysis.
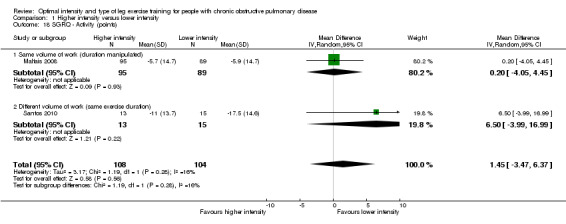
Comparison 1 Higher intensity versus lower intensity, Outcome 18 SGRQ ‐ Activity (points).
Secondary outcomes: Muscle strength
No studies reported this outcome.
Sensitivity analysis
We carried out sensitivity analysis on all outcomes that were considered most important as illustrated in the 'Summary of findings' tables (see Table 1).
Two studies were removed in the sensitivity analysis (Maltais 2008; Santos 2010). One study was removed because it was an abstract and depended on the authors of the study for data where reporting bias is unclear (Santos 2010). The other study (Maltais 2008) was removed from the primary analysis due to a possible confounding effect resulting from a difference in exercise settings between the two intervention groups. The study compared training effects between higher‐intensity, hospital‐based, supervised exercise training and lower‐intensity, home‐based, unsupervised exercise training. Any treatment effects between groups may be attributable to the degree of supervision as well as training intensity. With these two studies removed, only the study by Casaburi et al (Casaburi 1991) remained. Endurance time in a constant work rate test (Analysis 1.8) was the only outcome measure where the study by Casaburi et al (Casaburi 1991) was pooled with other studies and thus an appropriate outcome measure for a sensitivity analysis. The sensitivity analysis showed that the higher‐intensity training group cycled 3.9 minutes longer than the lower‐intensity training group (95% CI 0.75 to 7.05 minutes) (see Figure 3 and Additional table Table 2).
3.
Sensitivity analysis: Forest plot of comparison between Higher‐intensity training versus lower‐intensity training on endurance time (min).
1. Results from sensitivity analysis.
| 1 Higher intensity versuslower intensity: Maltais 2008; Santos 2010 were removed | |||||
| Outcome or Subgroups | Studies | Participants | Statistical method | Effect estimate with study removed (CI)) | Effect Estimate from Primary analysis (CI) |
| 1.8 Endurance time (min) | 1 | 19 | Mean Difference (IV, Random, 95% CI) | 3.90 (0.75 to 7.05) | 1.07 (‐1.53 to 3.67) |
| 2 Continuous vs interval | |||||
| Imputed standard deviations: Vogiatzis 2005 was removed | |||||
| 2.1 Peak oxygen consumption (L/min) | 4 | 169 | Mean Difference (IV, Random, 95% CI) | 0.01 (‐0.05 to 0.06) | 0.00 (‐0.05 to 0.05) |
| 2.2 Peak work rate (W) | 7 | 348 | Mean Difference (IV, Random, 95% CI) | ‐0.6 (‐2.9 to 1.8) | ‐0.6 (‐2.8 to 1.7) |
| 2.3 Lactate threshold (L/min) | 2 | 75 | Mean Difference (IV, Random, 95% CI) | ‐0.01 (‐0.08 to 0.06) | ‐0.01 (‐0.07 to 0.06) |
| Abstracts: Kortianou 2010 was removed | |||||
| 2.2 Peak work rate (W) | 7 | 321 | Mean Difference (IV, Random, 95% CI) | ‐0.9 (‐3.4 to 1.6) | ‐0.6 (‐2.8 to 1.7) |
| 2.5 Six‐minute walk distance (metres) | 4 | 228 | Mean Difference (IV, Random, 95% CI) | ‐7.47 (‐24.7 to 9.7) | ‐3.1 (‐17.9 to 11.7) |
| Criteria for free of bias not met: Arnardottir 2007; Vogiatzis 2005 were removed | |||||
| 2.1 Peak oxygen consumption (L/min) | 3 | 116 | Mean Difference (IV, Random, 95% CI) | ‐0.01 (‐0.07 to 0.06) | 0.00 (‐0.05 to 0.05) |
| 2.2 Peak work rate (W) | 6 | 288 | Mean Difference (IV, Random, 95% CI) | ‐0.7 (‐3.3 to 1.9) | ‐0.6 (‐2.8 to 1.7) |
| 2.5 Six‐minute walk distance (metres) | 4 | 214 | Mean Difference (IV, Random, 95% CI) | ‐3.9 (‐19.1 to 11.4) | ‐3.1 (‐17.9 to 11.7) |
| 2.14 CRQ ‐ Dyspnoea (points) | 3 | 152 | Mean Difference (IV, Random, 95% CI) | 1.39 (‐0.16 to 2.94) | 1.26 (‐0.01 to 2.54) |
CRQ: Chronic Respiratory Disease Questionnaire
2. Continuous versus interval training
We performed two subgroup analyses on outcomes where necessary. The first subgroup analysis was by volume of work. One study reported that the continuous training group performed significantly more total volume of work than the interval training group (Puhan 2006), while other studies reported similar volume of work between the two interventions. Therefore, for outcomes where the study by Puhan et al (Puhan 2006) was included with other studies, we performed the subgroup analysis by volume of work. The second subgroup analysis was by different training modes used between studies. Only one study used a combination of cycle and treadmill training (Mador 2009), while other studies used cycle training only. For outcomes where the study by Mador et al (Mador 2009) was included with other studies, we performed the subgroup analysis by training modes. For one study, the standard deviations in final scores were not reported (Vogiatzis 2005), therefore, we imputed the standard deviations from a study by the same group of authors which tested a cohort of participants with similar characteristics (Vogiatzis 2002).
In this meta‐analysis, we calculated the MD as the mean values of the continuous group minus the mean values of the interval group. Therefore, a positive MD or the 95% confidence interval (CI) around the MD indicates a favourable effect for the continuous training group and a negative MD or 95% CI favours the interval training group, provided that improvement in each group is indicated by positive change scores. Where improvement in outcomes is indicated by negative change scores following intervention, such as outcomes at isowork and isotime, symptoms and SGRQ scores, a negative MD or CI favours continuous training group and a positive MD or CI favours interval group.
Primary outcomes: Peak exercise
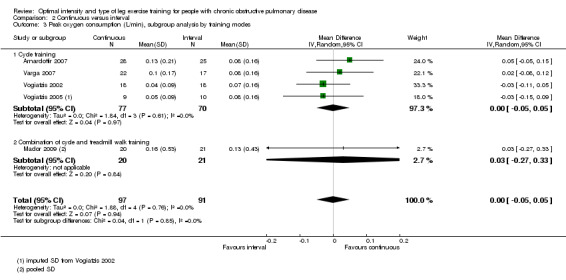
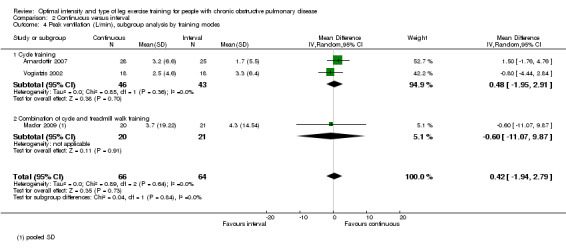
Maximum exercise capacity, measured by peak work rate and/or peak VO2 from an incremental cycle test, was evaluated in eight studies (Arnardottir 2007; Kortianou 2010; Mador 2009; Nasis 2009; Puhan 2006; Varga 2007; Vogiatzis 2002; Vogiatzis 2005) on 187 participants in the continuous group and 180 participants in the interval group. There was no significant difference in peak work rate between continuous and interval training (MD ‐0.55; 95% CI ‐2.84 to 1.74; Analysis 2.1). VO2peak was measured in five studies (Arnardottir 2007; Mador 2009; Varga 2007; Vogiatzis 2002; Vogiatzis 2005), with 97 participants in the continuous training group compared to 91 participants in the interval training group. No difference in VO2peak was found between the continuous group and the interval group (MD 0.00; 95% CI ‐0.05 to 0.05; Analysis 2.3). No significant difference in VEpeak was also found between continuous and interval training groups in three studies (MD 0.42 L/min; 95% CI ‐1.94 to 2.79; Analysis 2.4) (Arnardottir 2007; Mador 2009; Vogiatzis 2002). There was no heterogeneity in all subgroup analyses in these outcomes. Three studies investigated the effects of training on lactate threshold (Varga 2007; Vogiatzis 2002; Vogiatzis 2005). The participants in the interval group achieved a higher mean lactate threshold by 0.01 L/min than those in the continuous group, but it was not statistically significant (95% CI ‐0.07 to 0.06 L/min; Analysis 2.5).
2.1. Analysis.
Comparison 2 Continuous versus interval, Outcome 1 Peak work rate (W), subgroup analysis by volume of work.
2.3. Analysis.
Comparison 2 Continuous versus interval, Outcome 3 Peak oxygen consumption (L/min), subgroup analysis by training modes.
2.4. Analysis.
Comparison 2 Continuous versus interval, Outcome 4 Peak ventilation (L/min), subgroup analysis by training modes.
2.5. Analysis.
Comparison 2 Continuous versus interval, Outcome 5 Lactate threshold (L/min).
Primary outcomes: Isowork or isotime
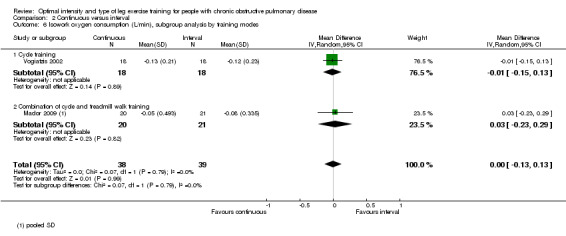
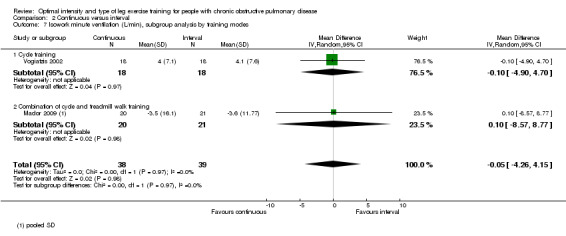
Only two studies reported outcomes at isowork (Mador 2009; Vogiatzis 2002): a total of 38 participants in the continuous group and 39 in the interval group. According to the pooled results, at isowork, neither VO2 nor VE were significantly different between the continuous and interval training group (MD 0.00 L/min; 95% CI ‐0.13 to 0.13; Analysis 2.6 and MD ‐0.05L/min; 95% CI ‐4.26 to 4.15; Analysis 2.7 respectively). At isotime, we pooled results of three studies to compare physiological responses between continuous and interval training (Arnardottir 2007; Mador 2009; Varga 2007). Although the treatment effect for VO2 at isotime favoured the interval training group (MD 0.08 L/min; 95% CI 0.01 to 0.16; Analysis 2.8), the difference in improvement in isotime VO2 between interval and continuous training was so small that the benefit of interval training in improving isotime VO2 was not clinically meaningful. The treatment effect for VE at isotime was not significant (MD 0.1 L/min; 95% CI ‐4.44 to 4.65; Analysis 2.9). No heterogeneity was found in subgroup analyses. However, there was a significant heterogeneity in overall treatment effect in isotime VE (I2 = 73%, P < 0.05).
2.6. Analysis.
Comparison 2 Continuous versus interval, Outcome 6 Isowork oxygen consumption (L/min), subgroup analysis by training modes.
2.7. Analysis.
Comparison 2 Continuous versus interval, Outcome 7 Isowork minute ventilation (L/min), subgroup analysis by training modes.
2.8. Analysis.
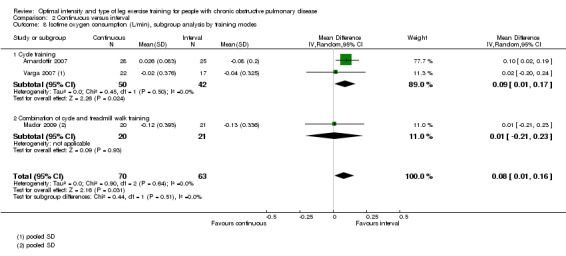
Comparison 2 Continuous versus interval, Outcome 8 Isotime oxygen consumption (L/min), subgroup analysis by training modes.
2.9. Analysis.
Comparison 2 Continuous versus interval, Outcome 9 Isotime minute ventilation (L/min), subgroup analysis by training modes.
Primary outcomes: Endurance time of constant work rate exercise test
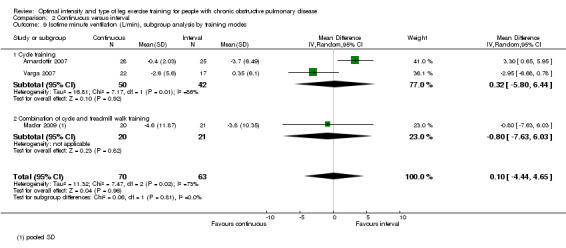
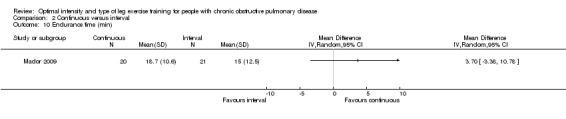
Endurance exercise tolerance was measured by time to exhaustion at constant work rate on cycle ergometer. Only one study investigated endurance time (Mador 2009) with 20 participants in the continuous group and 21 in the interval group. The continuous group achieved 3.70 minutes longer than the interval group, but this was not significant (95% CI ‐3.38 to 10.78 minutes; Analysis 2.10).
2.10. Analysis.
Comparison 2 Continuous versus interval, Outcome 10 Endurance time (min).
Primary outcomes: Functional exercise capacity
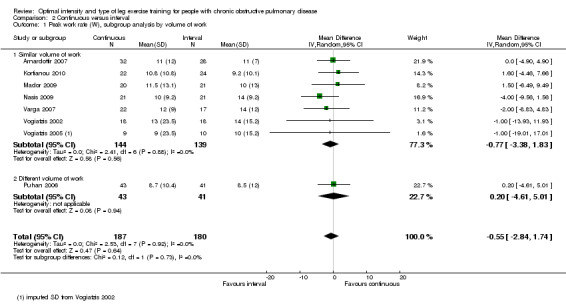
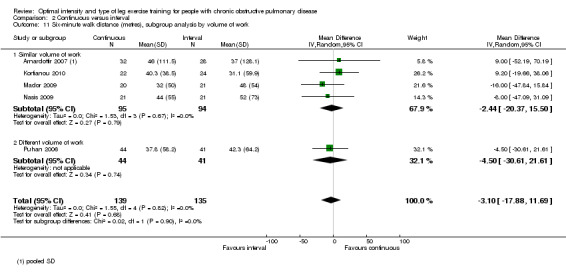
Five studies measured functional exercise capacity with the 6MWT (Arnardottir 2007; Kortianou 2010; Mador 2009; Nasis 2009; Puhan 2006): a total of 139 participants in the continuous group and 135 in the interval group. There was no significant difference in 6MWD between continuous and interval training (MD ‐3.10; 95% CI ‐17.88 to 11.69; Analysis 2.11). There was no heterogeneity in subgroup analyses by volume of work or by training modes.
2.11. Analysis.
Comparison 2 Continuous versus interval, Outcome 11 Six‐minute walk distance (metres), subgroup analysis by volume of work.
Secondary outcomes: Symptoms
Symptoms were measured by the modified Borg category ratio (CR) 0‐10 scale or the Borg 6‐20 scale or reported in percentage changes. Where different scales between studies were used to measure symptoms, standardisation of the mean difference of each study to a uniform scale is recommended (Higgins 2009). The standardised mean difference (SMD) is unitless (for description, see Methods: Measures of treatment effect). Change scores of dyspnoea and leg fatigue occur in the same direction, i.e. the lower the score, the less severe the symptoms. Thus, a negative change score indicates reduced symptoms. A negative treatment effect favours the continuous training group.
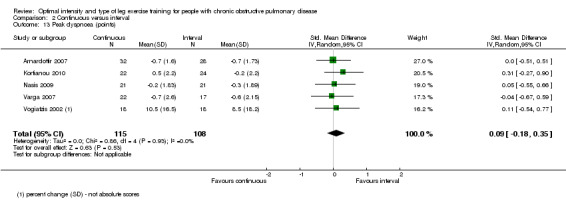
Peak dyspnoea was measured in five studies by the modified Borg CR 0‐10 scales (Arnardottir 2007; Kortianou 2010; Nasis 2009; Varga 2007; Vogiatzis 2002), but one study reported changes in peak dyspnoea in percentage points while no absolute score in peak dyspnoea was evident (Vogiatzis 2002). The SMD for peak dyspnoea was in favour of the interval group, but the effect size was small and not significant (SMD 0.09; 95% CI ‐0.18 to 0.35; Analysis 2.13): a total of 115 participants in the continuous group were compared to 108 participants in the interval group. No evidence of heterogeneity was found (I2 = 0%, P = 0.53).
2.13. Analysis.
Comparison 2 Continuous versus interval, Outcome 13 Peak dyspnoea (points).
Peak leg fatigue was measured in three studies. Two studies measured leg fatigue using the modified Borg CR scale (Nasis 2009; Varga 2007) and one using the Borg 6‐20 scale (Arnardottir 2007). The SMD for peak leg fatigue was 0.11 in favour of the continuous group, but the effect size was small and not significant (95% CI ‐0.44 to 0.22; Analysis 2.14). A total of 75 participants were in the continuous group and 66 participants in the interval group. No heterogeneity was evident (I2 = 0%, P = 0.58).
2.14. Analysis.
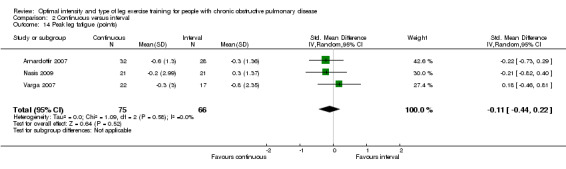
Comparison 2 Continuous versus interval, Outcome 14 Peak leg fatigue (points).
The perception of dyspnoea at isowork after training was investigated by one study (Vogiatzis 2002). At isowork, dyspnoea was lower for the interval group compared with the continuous group by 0.2 points, although the difference was not significant (95% CI ‐0.15 to 0.55; Analysis 2.15).
2.15. Analysis.
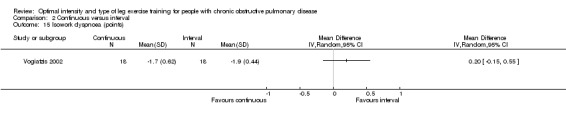
Comparison 2 Continuous versus interval, Outcome 15 Isowork dyspnoea (points).
Secondary outcomes: Health‐related quality of life (HRQoL)
HRQoL was measured only by the CRQ. We pooled total CRQ scores from three studies (Mador 2009; Puhan 2006; Vogiatzis 2002): a total of 82 participants in the continuous training group compared to 80 participants in the interval training group. We pooled scores for each domain of CRQ (Dyspnoea, Fatigue, Emotional function and Mastery) from these three studies, however for the Dyspnoea domain, an additional study (Arnardottir 2007) was included with a total of 114 participants in continuous group compared to 98 in interval group. Total CRQ score (MD 2.51; 95% CI ‐1.32 to 6.34; Analysis 2.16), Dyspnoea domain score (MD 1.26; 95% CI ‐0.01 to 2.54; Analysis 2.18), Fatigue domain score (MD ‐0.27; 95% CI ‐1.72 to 1.18; Analysis 2.20), Emotional domain score (MD 0.59; 95% CI ‐1.30 to 2.47; Analysis 2.22) and Mastery domain score (MD ‐0.02; 95% CI ‐1.65 to 1.61; Analysis 2.24) were not significantly different between continuous and interval training. Although no heterogeneity was found in the overall effect and subgroup analyses of any CRQ domain (I2 = 0% to 42%, P > 0.1), there was a significantly better improvement in the dyspnoea domain for the continuous training group than the interval training group, which was only evident in a subset of studies with similar volume of work by both intervention groups (MD 1.60; 95% CI 0.16 to 3.05; Analysis 2.18).
2.16. Analysis.
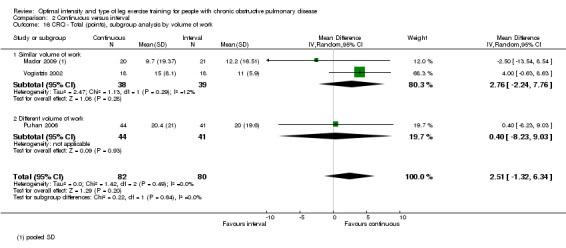
Comparison 2 Continuous versus interval, Outcome 16 CRQ ‐ Total (points), subgroup analysis by volume of work.
2.18. Analysis.
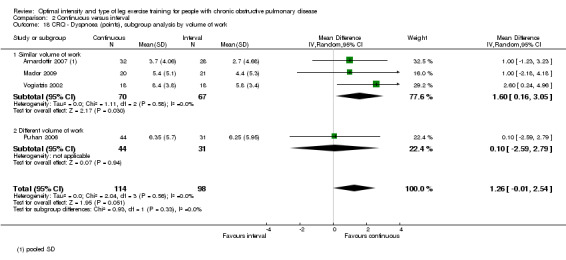
Comparison 2 Continuous versus interval, Outcome 18 CRQ ‐ Dyspnoea (points), subgroup analysis by volume of work.
2.20. Analysis.
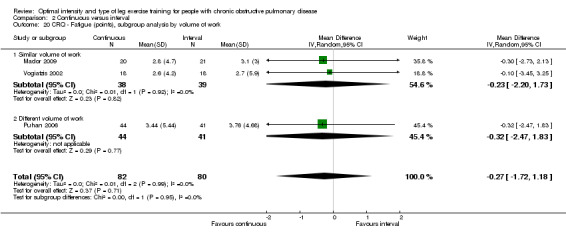
Comparison 2 Continuous versus interval, Outcome 20 CRQ ‐ Fatigue (points), subgroup analysis by volume of work.
2.22. Analysis.
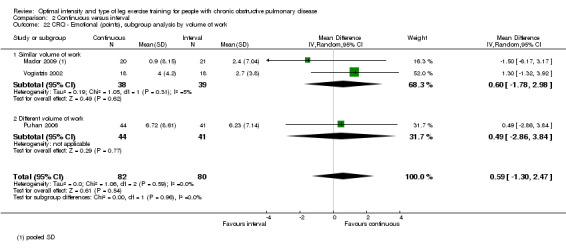
Comparison 2 Continuous versus interval, Outcome 22 CRQ ‐ Emotional (points), subgroup analysis by volume of work.
2.24. Analysis.
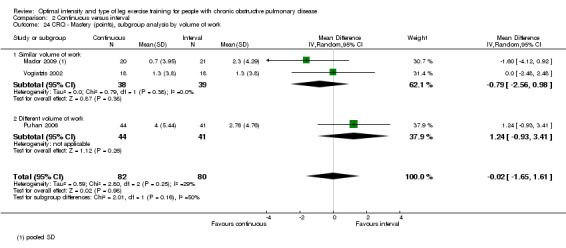
Comparison 2 Continuous versus interval, Outcome 24 CRQ ‐ Mastery (points), subgroup analysis by volume of work.
Secondary outcomes: Muscle strength
No studies reported this outcome.
Sensitivity analysis
See Additional Table 2. We carried out sensitivity analysis on outcomes that were considered most important as illustrated in the Table 1.
The first a priori sensitivity analysis removed a study with imputed standard deviations (Vogiatzis 2005). Outcomes of importance were peak VO2, peak work rate and lactate threshold. The second sensitivity analysis removed an abstract (Kortianou 2010) from the primary meta‐analysis and was applied to peak work rate and 6MWD. The third sensitivity analysis removed studies that were judged to exhibit limitations in study designs which as highlighted in the 'Risk of bias' assessment tool (Arnardottir 2007; Vogiatzis 2005). Important outcomes identified for sensitivity analysis were peak VO2, peak work rate, 6MWD and the dyspnoea domain in the CRQ. All three sensitivity analyses did not change the direction and significance of any of the outcomes.
Discussion
1. Higher‐intensity versus lower‐intensity training
This review has found that, in terms of exercise capacity, a higher‐intensity training programme might elicit significantly lower lactate at isowork and ventilation at isotime than a lower‐intensity training programme for people with moderate to severe chronic obstructive pulmonary disease (COPD). However, these findings were based on only one study with few participants (n = 19; Casaburi 1991). The pooled results of three studies showed no significant effect in endurance time during a constant work rate test between two levels of training intensity, however, a sensitivity analysis where only one study remained (Casaburi 1991), revealed a significantly longer endurance time for the higher than the lower‐intensity training group. In regards to the results in the six‐minute walk distance, the majority of participants were randomised to receive cycle training which may limit the applicability of these results. Only one study reported a significantly lower dyspnoea at the end of a peak test for the higher‐intensity training group (Santos 2010). The effect of exercise training intensity on health‐related quality of life (HRQoL) is unclear as only two studies reported HRQoL and in one of these studies (Maltais 2008), the results were possibly confounded as exercise training in each group was performed in either supervised or home settings.
It is well established that cycle exercise training can improve aerobic metabolism in the skeletal muscles and thus delay the onset of lactate acidosis during exercise or activities of daily living in people with COPD in whom skeletal muscle dysfunction is one of the major limitations to exercise (Maltais 1996a; Maltais 1996b). At a given amount of work, blood lactate production would be lower following training with a consequent reduction in carbon dioxide production (VCO2) (Casaburi 1997). Since ventilation is directly related to VCO2, a reduced VCO2 often results in reduced ventilation (Wasserman 2004). The findings of reduced lactate at isowork and ventilation at isotime (Casaburi 1991) in this review further highlight the relationship between lactate production and ventilation during exercise. Given the lower lactate and ventilation at submaximal exercise with higher‐intensity training, it may mean that people with COPD who train at a higher intensity (approximately 80% Wpeak) may be able to perform their daily activities for a longer period. In fact, these measures have been considered as key outcomes for daily activities in COPD as activities are mostly performed at submaximal, not peak, levels (Jones 2006).
Endurance time of constant work rate exercise to the limit of tolerance has been regarded as a more sensitive outcome measure to detect differences in exercise capacity following training than peak measures from an incremental test in COPD (Palange 2007). In contrast to the premise that reduced lactate production and ventilation result in longer endurance time in submaximal exercise, the meta‐analysis from pooling all three studies revealed no significant difference between higher and lower‐intensity training groups. This disparate finding could be largely attributed to a possible confounding effect of the differences in the degree of supervision in a large study cohort (Maltais 2008), which may also explain the heterogeneity observed in the pooled effect for this outcome measure. The supervised group in this study was allocated a higher training intensity of 80% Wpeak while the home‐based group, which was unsupervised but monitored with frequent phone calls and exercise diary, was prescribed a lower training intensity of 60% Wpeak (Maltais 2008). Although the main aim of that study was to compare effects of supervised training, it was included in the primary analysis of the review because the individualised prescription of exercise intensity for each group was clear and distinct. However, recognising that exercise setting as well as differences in levels of exercise intensity may equally influence training effects, we conducted a sensitivity analysis without this study. Note that the abstract (Santos 2010) was also removed for reasons of potential reporting bias. The sensitivity analysis, based on only one study (Casaburi 1991), revealed significantly longer endurance time favouring the higher‐intensity training group. This finding links the chain of results between lactate, ventilation and endurance time from this study (Casaburi 1991). In addition, the better endurance time for the higher‐intensity training group compared to the lower‐intensity training group may be of clinical importance as it exceeded the minimal important difference (MID) of 1.68 minutes (Puente‐Maestu 2009).
The heterogeneity in endurance time may also be attributed to a slight but important disparity in the magnitude of the difference in intensity levels between the two interventions in each study. There is a difference of 20 units in intensity levels between the higher (80% Wpeak) and lower (60% Wpeak) intensity training groups in two studies that showed similar treatment effects (Maltais 2008; Santos 2010) compared to a difference of 30 units between the higher (80% Wpeak) and lower (50% Wpeak) in one study that showed a favourable effect towards the higher‐intensity training group (Casaburi 1991). In addition, the role of lactic acidosis as a possible 'critical threshold' above which training is effective in eliciting physiologic benefits was demonstrated in the study by Casaburi et al (Casaburi 1991), supporting their findings of significantly less physiologic benefits for the lower‐intensity group who exercised below the anaerobic threshold. In contrast, similar improvements in endurance time between groups in the other two studies (Maltais 2008; Santos 2010) suggest that the intensity prescribed for the lower‐intensity group was possibly high enough to induce lactic acidosis during exercise in people with COPD. However, it is difficult to substantiate this claim because no investigation on physiologic outcomes was performed in these studies. There is no subgroup difference, suggesting that the volume of work performed had little influence on the treatment effect between studies (Analysis 1.8).
The six‐minute walk distance (6MWD) is also a key functional outcome for people with COPD (Brown 2007). Following a pulmonary rehabilitation programme, 6MWD is expected to improve (Nici 2006; Ries 2007). In this review, the difference in 6MWD improvement between higher and lower training intensities was small and not significant. Since the treatment effect and the confidence interval (CI) around the effect did not reach the MID of 35 metres (Puhan 2008), the difference between the groups was considered not clinically important. It should be noted that all participants in the study by Maltais 2008 and an unknown proportion of participants in the study by Santos 2010 performed cycle exercise training only. Specificity of training principles recommend that in order to optimise improvement in walking performance, a walking exercise training regimen should be performed (Cooper 2001). Therefore, cycle exercise training may not show the benefits expected in the 6MWT. The interpretation of the result in 6MWD between higher and lower‐intensity training needs to be treated with caution as it may not fully reflect the true effects of the different levels of intensity on functional exercise capacity due to the influence of training modes being different from testing modes.
Improvements in physiological outcomes with higher‐intensity training, such as lower lactate at isowork and ventilation at isotime, may translate into improvements in breathing pattern (Casaburi 1997; Porszasz 2005), dyspnoea, muscle fatigue and time spent in daily activities, and hence, better quality of life (Nici 2006). Only one study (an abstract) reported symptoms before and after training (Santos 2010) which showed a significantly greater improvement in dyspnoea at the end of peak exercise test for the higher than the lower‐intensity training group. However, to better understand whether the physiological differences between higher and lower‐intensity training at submaximal exercise translate to symptoms reduction, reports on symptoms at isowork or isotime would be required. For HRQoL, there was a significantly greater improvement in the Symptoms domain of the St George's Respiratory Questionnaire (SGRQ) following lower‐intensity training, which seems inconsistent with the findings of greater physiologic benefits and reduction in dyspnoea for the higher‐intensity group. It should be noted that the reduction in SGRQ Symptom score favouring lower‐intensity training in the meta‐analysis was strongly influenced by the study by Maltais et al (Maltais 2008) in which the lower‐intensity training occurred in the home setting. There was no significant and clinically important difference in other domains of the SGRQ and Chronic Respiratory Disease Questionnaire (CRQ) between the two levels of training intensity and the confidence interval of each treatment effect was wide. Thus, it was difficult to draw conclusions from this meta‐analysis on the effects of training intensity on HRQoL, which is consistent with a previous guideline (Ries 2007).
While guidelines strongly recommend higher‐intensity training due to greater physiological benefits than lower‐intensity training in people with COPD (Nici 2006; Ries 2007; Troosters 2005), more rigorous investigation is needed to determine how much greater the benefits are. In contrast to popular belief, this review has revealed there is insufficient evidence to support the proposition that higher‐intensity training induces significantly greater improvement in physiological markers of maximal exercise capacity, i.e. peak VO2 and peak work rate, than lower‐intensity training. The lack or absence of evidence in this regard may be explained by the relatively small number of studies investigated for this review. Other related studies (Gimenez 2000; Normandin 2002; Punzal 1991) cited in current guidelines (Nici 2006; Ries 2007) were omitted from this review due to the strict exclusion criteria such as the use of different exercise training modes (for example, cycling versus walking (Gimenez 2000) or cycling versus callisthenics (Clark 1996; Normandin 2002)) (See Characteristics of excluded studies). We excluded such studies in an attempt to reduce heterogeneity among different interventions.
Finally, some caution is warranted when interpreting the overall meta‐analysis. If the studies by Maltais et al (Maltais 2008) and the abstract by Santos et al (Santos 2010) were removed from the primary analysis because of likely strong influence from confounding factors (as described above), the treatment effects between higher and lower‐intensity training will be based on only one study (Casaburi 1991). Consequently, only physiological responses at isowork or isotime would be reported while data on peak exercise responses, symptoms and HRQoL will not be available. According to the grading system developed by the GRADE collaboration (GRADE Working Group 2004), we judged the overall quality of the body of evidence as low to moderate. In addition, there is considerable uncertainty and limitation in some of the study designs that may account for a moderate risk of bias (Figure 2). This meta‐analysis also included only a small number of studies with relatively small sample size; the largest number of studies pooled being three and sample size of 231 participants. In many cases, there were only one to two studies analysed for each outcome. This limitation may contribute to the imprecision seen in some results with wide confidence intervals. The small number of studies also made it difficult to draw definitive conclusions regarding the impact total volume of work has on training responses. Although these studies differed in many aspects (volume of work per session, magnitude of difference between intensity levels, variation in number of sessions), the statistical heterogeneity was not significant in most results.
2. Continuous versus interval training
The results from this meta‐analysis show that one type of training was not superior to the other for improving physiological outcomes, functional exercise capacity (6MWD), symptoms and health‐related quality of life in people with moderate to severe COPD. Only an improvement in VO2 at isotime was significantly greater for the interval than the continuous training group, but the difference in improvement between the groups was small and not clinically important. In addition, a number of a priori sensitivity analyses on key outcomes did not affect the direction or significance of the treatment effect of each outcome. Therefore, this review suggests that continuous training and interval training are equally effective in improving exercise capacity, functional capacity, dyspnoea and HRQoL in people with COPD.
There was no heterogeneity between any subgroup analyses by volume of work or by training modes. The pooled results in the subset of studies with similar volume of work between the two intervention groups revealed a significantly greater improvement in the Dyspnoea domain of the CRQ for the continuous training group than the interval training group. Despite the significantly better improvement for the continuous training group, it did not exceed the MID of 2.5 points (Jaeschke 1989). Thus, the clinical importance of whether continuous training with an equivalent volume of work as interval training elicits better improvement in the CRQ Dyspnoea domain is unclear.
A possible explanation for the finding of similar improvements in outcomes from both interval and continuous training may be related to the fact that in the majority of the studies (seven of the eight) included in this meta‐analysis, the total volume of work done in both types of exercise were equivalent. Only the study by Puhan et al (Puhan 2006) reported a significantly greater volume of work done per session by the continuous training group than the interval training group. Subgroup analyses by volume of work were undertaken for peak work rate, 6MWD and CRQ outcomes in which the results of Puhan et al (Puhan 2006) were pooled with those from other studies and revealed no significant subgroup differences. This finding is in contrast to the view that greater benefits would be associated with more work being performed, given that the total volume of work is recognised as an important determinant of the training response (Butcher 2006). Similar outcomes with different volumes of work between training groups in this study (Puhan 2006) may be attributed to the baseline fitness level of participants in an inpatient setting. At this early stage of recovery from an acute COPD exacerbation, fitness level is often considered to be so low (Clini 2009; Man 2004) that any form of exercise training has the potential to engender physiological adaptations and improve exercise capacity (Swain 2002). Consequently, it may be difficult to discern significant differences between different training types or total volume of work performed.
A previous study on healthy untrained adults found that post‐training maximal exercise capacity in terms of VO2max and power output significantly favoured interval training over continuous training at the same total volume of work performed per session (Gorostiaga 1991). In contrast, lower blood lactate concentrations at isowork favoured continuous training (Gorostiaga 1991). Lower blood lactate concentration at a given constant work rate should result in less carbon dioxide output and hence lower absolute minute ventilation (Wasserman 2004). As such, these physiological changes may allow for greater endurance time during constant work rate exercise in healthy untrained individuals. However, unlike the findings in healthy untrained individuals, this review found no significant difference in these physiological measures at isowork and in endurance time between interval and continuous training for people with COPD.
It has been previously proposed that interval exercise is superior to continuous exercise as a mode of training for people with COPD as interval exercise is associated with lower haemodynamic and metabolic perturbations (Sabapathy 2004). In addition, individuals with COPD are known to be able to complete a significantly greater volume of work during an interval exercise test and thus are more likely to tolerate this type of exercise (Sabapathy 2004). Acute responses in oxygen uptake, minute ventilation and plasma lactate concentration were found to be significantly lower during an interval exercise test than a continuous exercise test at the same absolute intensity (or power output) in healthy untrained older men (Morris 2003) and in individuals with COPD (Sabapathy 2004). In addition, less dynamic hyperinflation and dyspnoea were reported during interval exercise in people with COPD (Sabapathy 2004; Vogiatzis 2004). However, the results from this meta‐analysis do not support this proposed superiority of interval exercise training in COPD. The study by Sabapathy and colleagues compared a single bout of both continuous and interval exercise at the same absolute intensity but with the duration of the interval period adjusted to achieve the same effective exercise duration as that of the continuous exercise (Sabapathy 2004). This approach is in one of the categories we listed a priori when selecting studies for the review (see Category (b) under 'Types of interventions' in Methods section). However, we found no training study of such category. More research is needed in this approach to exercise prescription as it would be interesting to determine whether interval and continuous training of the same effective duration would change any of the outcomes and conclusions of this review.
A similar meta‐analysis comparing continuous and interval training has been recently published elsewhere (Beauchamp 2010). Our findings were similar to that analysis and lend further support to the understanding that there are no differences between the effects of continuous and interval training on improving exercise capacity, functional capacity, dyspnoea and HRQoL in people with COPD. However, the main disadvantage of interval training that may warrant some consideration in clinical practice is the need for a higher therapist‐to‐patient ratio to ensure that the work rates and work:rest intervals are being adhered to. Commonly in clinical practice, an intermittent (rather than interval) type of exercise training is performed where patients exercise at a higher intensity and rest as needed and continue when able. Intermittent training in clinical practice is not strictly the same as interval training done in a research study.
Caution is recommended when interpreting the findings of this review. The overall quality of evidence in the meta‐analysis is low to moderate due to small sample sizes in each study. Another limitation of this meta‐analysis is the diverse nature of the training protocols. The duration of high‐intensity exercise component in the interval training ranged from 30 seconds to 3 minutes. While different ratios of exercise to rest or to low intensity periods were reported, a 1:1 ratio was the most commonly used method. Lengths of training programme ranged from 3 to 16 weeks and frequency of sessions was two to five times a week, with 15 sessions as the lowest total number of training sessions performed. Progression of workload also varied between studies. Similarly, the intensity and duration of continuous training varied between studies. Cycling and walking exercise modes were also used. Despite the diversity in protocol designs, homogeneity was found in most outcomes suggesting that a low percentage of the variability in effect estimates was due to heterogeneity rather than chance sampling error and that adjusting several training parameters would be unlikely to have much of an effect on the outcomes. Other limitations in the designs of included studies were poor allocation concealment, high drop‐out rates and potential selective reporting.
Authors' conclusions
Implications for practice.
Training intensity: In conclusion, it was difficult to draw any conclusions on the effects of different levels of training intensity on exercise capacity, dyspnoea and health‐related quality of life (HRQoL) in people with moderate to severe chronic obstructive pulmonary disease (COPD) due to insufficient data and possible confounding effects associated with study design.
Training type: There was no significant difference between interval training and continuous training in improving exercise capacity, functional exercise capacity, symptoms and HRQoL in people with moderate to severe COPD, except for a greater improvement in VO2 at isotime which favours interval training and a greater reduction in the Chronic Respiratory Disease Questionnaire (CRQ) Dyspnoea domain score favouring continuous training when studies with equivalent volume of work done in the two intervention groups were pooled. However, the difference in improvement between the training types for both outcomes was not clinically important. Thus, based on current evidence, the choice of whether to use continuous or interval training may depend on patient or therapist preference, or both. Overall, continuous and interval training appears to be equally effective in optimising exercise capacity in people with moderate to severe COPD.
Implications for research.
The small number of studies comparing higher training intensity and lower training intensity in COPD underscores the need for more studies in which the aim should be to identify the minimal effective training intensities necessary to produce physiological benefit while maintaining patient compliance. We recommend that future comparisons be made by altering intensity but keeping volume of work the same as well as comparing the same mode of training (cycle or walking) to minimise any potential confounding factors. The effect of disease severity on the response to training intensity also requires investigation. More training studies should consider walking training at different levels of intensity in order to better reflect effects of training intensity on 6MWD.
The effects of interval training and continuous training could be further investigated in people with COPD by comparing these interventions at the same intensities with an equivalent volume of work as there are currently no such studies. In addition, future studies should consider determining if people with COPD are able to perform and tolerate higher total volume of work during interval training than continuous training, theoretically resulting in greater training benefits. This recommendation is based on evidence that people with COPD are able to tolerate the high‐intensity periods during interval training without reaching a ventilatory limitation (Sabapathy 2004; Vogiatzis 2004).
What's new
| Date | Event | Description |
|---|---|---|
| 5 June 2014 | Amended | PLS title amended |
Acknowledgements
We would like to thank Dr Mark Elkins for his guidance in the initial stages of submitting the review question to the Cochrane Airways Group and Assoc/Prof Rob Herbert for his advice relating to the protocol.
Appendices
Appendix 1. MEDLINE independent search strategy (1948 to September 2010)
| # | Searches | Results |
| 1 | Lung diseases, Obstructive/ OR Pulmonary disease, Chronic obstructive | 32737 |
| 2 | Physical endurance/ OR Exercise tolerance/ OR Anaerobic threshold/ OR Physical exertion/ph[Physiology] |
27165 |
| 3 | Exercise(focus)/ OR Exercise/ph[Physiology] | 41236 |
| 4 | 1 AND (2 OR 3) AND limit to humans | 1490 |
Appendix 2. AMED independent search strategy (1985 to September 2010)
| # | Searches | Results |
| 1 | Lung diseases, Obstructive/ OR Pulmonary disease, Chronic obstructive |
1235 |
| 2 | Physical endurance/ OR Exercise tolerance/ OR Anaerobic threshold/ OR Physical exertion/ph[Physiology] |
995 |
| 3 | Exercise(focus)/ OR Exercise/ph[Physiology] | 0 |
| 4 | 1 AND (2 OR 3) AND limit to humans | 83 |
Appendix 3. CINAHL independent search strategy (1979 to September 2010)
| Search ID # | Search Terms | Search options | Results |
| S1 | (MH"Lung diseases, Obstructive") OR (MH"Pulmonary disease, Chronic obstructive") | Search modes – Boolean/Phrase | 7247 |
| S2 | (MH"Physical endurance") OR (MH"Exercise tolerance") OR (MH"Anaerobic threshold") OR (MH"Exertion/PH") OR (MH"Exercise Intensity") | Search modes – Boolean/Phrase | 8312 |
| S3 | (MH"Exercise/PH") | Search modes – Boolean/Phrase | 11 |
| S4 | S1 AND (S2 OR S3) | Limiters ‐ Human | 256 |
Appendix 4. PubMed independent search strategy (1948 to September 2010)
| Search | Most recent queries | Results |
| #1 | Search "Lung diseases, Obstructive"{Mesh] OR "Pulmonary disease, Chronic obstructive"[Mesh] | 137871 |
| #2 | Search "Physical endurance"[Mesh] OR "Exercise tolerance"[Mesh] OR "Anaerobic threshold"[Mesh] OR "Physical exertion/physiology"[Mesh] | 26384 |
| #3 | Search "Exercise"[Majr] OR "Exercise/physiology"[Mesh] | 40467 |
| #4 | Search #1 AND (#2 OR #3) Limits: Humans | 1764 |
Appendix 5. EMBASE independent search strategy (1945 to September 2010)
| Search query | Results |
| #1 'chronic obstructive lung disease'/de | 48065 |
| #2 'exercise tolerance'/de | 7256 |
| #3 'endurance training'/de | 83 |
| #4 'exercise intensity'/de | 1551 |
| #5 'anaerobic threshold'/de | 1358 |
| #6 #2 OR #3 OR #4 OR #5 | 9972 |
| #7 #1 AND #6 AND [humans]/lim | 928 |
Data and analyses
Comparison 1. Higher intensity versus lower intensity.
| Outcome or subgroup title | No. of studies | No. of participants | Statistical method | Effect size |
|---|---|---|---|---|
| 1 Peak work rate (W) | 1 | Mean Difference (IV, Random, 95% CI) | Totals not selected | |
| 2 Lactate threshold (L/min) | 1 | Mean Difference (IV, Random, 95% CI) | Totals not selected | |
| 3 Isowork oxygen consumption (L/min) | 1 | Mean Difference (IV, Random, 95% CI) | Totals not selected | |
| 4 Isowork minute ventilation (L/min) | 1 | Mean Difference (IV, Random, 95% CI) | Totals not selected | |
| 5 Isowork lactate (mmol/L) | 1 | Mean Difference (IV, Random, 95% CI) | Totals not selected | |
| 6 Isotime oxygen consumption (L/min) | 1 | Mean Difference (IV, Random, 95% CI) | Totals not selected | |
| 7 Isotime minute ventilation (L/min) | 1 | Mean Difference (IV, Random, 95% CI) | Totals not selected | |
| 8 Endurance time (min) | 3 | 231 | Mean Difference (IV, Random, 95% CI) | 1.07 [‐1.53, 3.67] |
| 8.1 Same volume of work (duration manipulated) | 2 | 203 | Mean Difference (IV, Random, 95% CI) | 1.67 [‐2.22, 5.57] |
| 8.2 Different volume of work (same exercise duration) | 1 | 28 | Mean Difference (IV, Random, 95% CI) | ‐0.30 [‐4.19, 3.59] |
| 9 Six‐minute walk distance (metres) | 2 | 212 | Mean Difference (IV, Random, 95% CI) | 2.75 [‐10.08, 15.59] |
| 9.1 Same volume of work (duration manipulated) | 1 | 184 | Mean Difference (IV, Random, 95% CI) | 3.0 [‐10.09, 16.09] |
| 9.2 Different volume of work (same exercise duration) | 1 | 28 | Mean Difference (IV, Random, 95% CI) | ‐3.5 [‐69.60, 62.60] |
| 10 Peak dyspnoea (points) | 1 | Mean Difference (IV, Random, 95% CI) | Totals not selected | |
| 11 CRQ ‐ Dyspnoea (points) | 1 | Mean Difference (IV, Random, 95% CI) | Totals not selected | |
| 12 CRQ ‐ Fatigue (points) | 1 | Mean Difference (IV, Random, 95% CI) | Totals not selected | |
| 13 CRQ ‐ Emotional (points) | 1 | Mean Difference (IV, Random, 95% CI) | Totals not selected | |
| 14 CRQ ‐ Mastery (points) | 1 | Mean Difference (IV, Random, 95% CI) | Totals not selected | |
| 15 SGRQ ‐ Total (points) | 2 | 212 | Mean Difference (IV, Random, 95% CI) | 1.73 [‐1.01, 4.47] |
| 15.1 Same volume of work (duration manipulated) | 1 | 184 | Mean Difference (IV, Random, 95% CI) | 1.40 [‐1.53, 4.33] |
| 15.2 Different volume of work (same exercise duration) | 1 | 28 | Mean Difference (IV, Random, 95% CI) | 4.0 [‐3.71, 11.71] |
| 16 SGRQ ‐ Symptoms (points) | 2 | 212 | Mean Difference (IV, Random, 95% CI) | 5.60 [1.05, 10.15] |
| 16.1 Same volume of work (duration manipulated) | 1 | 184 | Mean Difference (IV, Random, 95% CI) | 6.1 [1.23, 10.97] |
| 16.2 Different volume of work (same exercise duration) | 1 | 28 | Mean Difference (IV, Random, 95% CI) | 2.20 [‐10.48, 14.88] |
| 17 SGRQ ‐ Impacts (points) | 2 | 212 | Mean Difference (IV, Random, 95% CI) | 0.56 [‐2.63, 3.75] |
| 17.1 Same volume of work (duration manipulated) | 1 | 184 | Mean Difference (IV, Random, 95% CI) | 0.20 [‐3.20, 3.60] |
| 17.2 Different volume of work (same exercise duration) | 1 | 28 | Mean Difference (IV, Random, 95% CI) | 3.20 [‐6.05, 12.45] |
| 18 SGRQ ‐ Activity (points) | 2 | 212 | Mean Difference (IV, Random, 95% CI) | 1.45 [‐3.47, 6.37] |
| 18.1 Same volume of work (duration manipulated) | 1 | 184 | Mean Difference (IV, Random, 95% CI) | 0.20 [‐4.05, 4.45] |
| 18.2 Different volume of work (same exercise duration) | 1 | 28 | Mean Difference (IV, Random, 95% CI) | 6.5 [‐3.99, 16.99] |
Comparison 2. Continuous versus interval.
| Outcome or subgroup title | No. of studies | No. of participants | Statistical method | Effect size |
|---|---|---|---|---|
| 1 Peak work rate (W), subgroup analysis by volume of work | 8 | 367 | Mean Difference (IV, Random, 95% CI) | ‐0.55 [‐2.84, 1.74] |
| 1.1 Similar volume of work | 7 | 283 | Mean Difference (IV, Random, 95% CI) | ‐0.77 [‐3.38, 1.83] |
| 1.2 Different volume of work | 1 | 84 | Mean Difference (IV, Random, 95% CI) | 0.20 [‐4.61, 5.01] |
| 2 Peak work rate (W), subgroup analysis by training modes | 8 | 367 | Mean Difference (IV, Random, 95% CI) | ‐0.55 [‐2.84, 1.74] |
| 2.1 Cycle training | 7 | 326 | Mean Difference (IV, Random, 95% CI) | ‐0.74 [‐3.13, 1.65] |
| 2.2 Combination of cycle and treadmill walk training | 1 | 41 | Mean Difference (IV, Random, 95% CI) | 1.5 [‐6.49, 9.49] |
| 3 Peak oxygen consumption (L/min), subgroup analysis by training modes | 5 | 188 | Mean Difference (IV, Random, 95% CI) | 0.00 [‐0.05, 0.05] |
| 3.1 Cycle training | 4 | 147 | Mean Difference (IV, Random, 95% CI) | 0.00 [‐0.05, 0.05] |
| 3.2 Combination of cycle and treadmill walk training | 1 | 41 | Mean Difference (IV, Random, 95% CI) | 0.03 [‐0.27, 0.33] |
| 4 Peak ventilation (L/min), subgroup analysis by training modes | 3 | 130 | Mean Difference (IV, Random, 95% CI) | 0.42 [‐1.94, 2.79] |
| 4.1 Cycle training | 2 | 89 | Mean Difference (IV, Random, 95% CI) | 0.48 [‐1.95, 2.91] |
| 4.2 Combination of cycle and treadmill walk training | 1 | 41 | Mean Difference (IV, Random, 95% CI) | ‐0.60 [‐11.07, 9.87] |
| 5 Lactate threshold (L/min) | 3 | 94 | Mean Difference (IV, Random, 95% CI) | ‐0.01 [‐0.07, 0.06] |
| 6 Isowork oxygen consumption (L/min), subgroup analysis by training modes | 2 | 77 | Mean Difference (IV, Random, 95% CI) | ‐0.00 [‐0.13, 0.13] |
| 6.1 Cycle training | 1 | 36 | Mean Difference (IV, Random, 95% CI) | ‐0.01 [‐0.15, 0.13] |
| 6.2 Combination of cycle and treadmill walk training | 1 | 41 | Mean Difference (IV, Random, 95% CI) | 0.03 [‐0.23, 0.29] |
| 7 Isowork minute ventilation (L/min), subgroup analysis by training modes | 2 | 77 | Mean Difference (IV, Random, 95% CI) | ‐0.05 [‐4.26, 4.15] |
| 7.1 Cycle training | 1 | 36 | Mean Difference (IV, Random, 95% CI) | ‐0.10 [‐4.90, 4.70] |
| 7.2 Combination of cycle and treadmill walk training | 1 | 41 | Mean Difference (IV, Random, 95% CI) | 0.10 [‐8.57, 8.77] |
| 8 Isotime oxygen consumption (L/min), subgroup analysis by training modes | 3 | 133 | Mean Difference (IV, Random, 95% CI) | 0.08 [0.01, 0.16] |
| 8.1 Cycle training | 2 | 92 | Mean Difference (IV, Random, 95% CI) | 0.09 [0.01, 0.17] |
| 8.2 Combination of cycle and treadmill walk training | 1 | 41 | Mean Difference (IV, Random, 95% CI) | 0.01 [‐0.21, 0.23] |
| 9 Isotime minute ventilation (L/min), subgroup analysis by training modes | 3 | 133 | Mean Difference (IV, Random, 95% CI) | 0.10 [‐4.44, 4.65] |
| 9.1 Cycle training | 2 | 92 | Mean Difference (IV, Random, 95% CI) | 0.32 [‐5.80, 6.44] |
| 9.2 Combination of cycle and treadmill walk training | 1 | 41 | Mean Difference (IV, Random, 95% CI) | ‐0.80 [‐7.63, 6.03] |
| 10 Endurance time (min) | 1 | Mean Difference (IV, Random, 95% CI) | Totals not selected | |
| 11 Six‐minute walk distance (metres), subgroup analysis by volume of work | 5 | 274 | Mean Difference (IV, Random, 95% CI) | ‐3.10 [‐17.88, 11.69] |
| 11.1 Similar volume of work | 4 | 189 | Mean Difference (IV, Random, 95% CI) | ‐2.44 [‐20.37, 15.50] |
| 11.2 Different volume of work | 1 | 85 | Mean Difference (IV, Random, 95% CI) | ‐4.5 [‐30.61, 21.61] |
| 12 Six‐minute walk distance (metres), subgroup analysis by training modes | 5 | 274 | Mean Difference (IV, Random, 95% CI) | ‐3.10 [‐17.88, 11.69] |
| 12.1 Cycle training | 4 | 233 | Mean Difference (IV, Random, 95% CI) | 0.45 [‐16.24, 17.14] |
| 12.2 Combination of cycle and treadmill walk training | 1 | 41 | Mean Difference (IV, Random, 95% CI) | ‐16.0 [‐47.84, 15.84] |
| 13 Peak dyspnoea (points) | 5 | 223 | Std. Mean Difference (IV, Random, 95% CI) | 0.09 [‐0.18, 0.35] |
| 14 Peak leg fatigue (points) | 3 | 141 | Std. Mean Difference (IV, Random, 95% CI) | ‐0.11 [‐0.44, 0.22] |
| 15 Isowork dyspnoea (points) | 1 | Mean Difference (IV, Random, 95% CI) | Totals not selected | |
| 16 CRQ ‐ Total (points), subgroup analysis by volume of work | 3 | 162 | Mean Difference (IV, Random, 95% CI) | 2.51 [‐1.32, 6.34] |
| 16.1 Similar volume of work | 2 | 77 | Mean Difference (IV, Random, 95% CI) | 2.76 [‐2.24, 7.76] |
| 16.2 Different volume of work | 1 | 85 | Mean Difference (IV, Random, 95% CI) | 0.40 [‐8.23, 9.03] |
| 17 CRQ ‐ Total (points), subgroup analysis by training modes | 3 | 162 | Mean Difference (IV, Random, 95% CI) | 2.51 [‐1.32, 6.34] |
| 17.1 Cycle training | 2 | 121 | Mean Difference (IV, Random, 95% CI) | 3.20 [‐0.88, 7.28] |
| 17.2 Combination of cycle and treadmill walk training | 1 | 41 | Mean Difference (IV, Random, 95% CI) | ‐2.5 [‐13.54, 8.54] |
| 18 CRQ ‐ Dyspnoea (points), subgroup analysis by volume of work | 4 | 212 | Mean Difference (IV, Random, 95% CI) | 1.26 [‐0.01, 2.54] |
| 18.1 Similar volume of work | 3 | 137 | Mean Difference (IV, Random, 95% CI) | 1.60 [0.16, 3.05] |
| 18.2 Different volume of work | 1 | 75 | Mean Difference (IV, Random, 95% CI) | 0.10 [‐2.59, 2.79] |
| 19 CRQ ‐ Dyspnoea (points), subgroup analysis by training modes | 4 | 212 | Mean Difference (IV, Random, 95% CI) | 1.26 [‐0.01, 2.54] |
| 19.1 Cycle training | 3 | 171 | Mean Difference (IV, Random, 95% CI) | 1.32 [‐0.07, 2.70] |
| 19.2 Combination of cycle and treadmill walk training | 1 | 41 | Mean Difference (IV, Random, 95% CI) | 1.0 [‐2.18, 4.18] |
| 20 CRQ ‐ Fatigue (points), subgroup analysis by volume of work | 3 | 162 | Mean Difference (IV, Random, 95% CI) | ‐0.27 [‐1.72, 1.18] |
| 20.1 Similar volume of work | 2 | 77 | Mean Difference (IV, Random, 95% CI) | ‐0.23 [‐2.20, 1.73] |
| 20.2 Different volume of work | 1 | 85 | Mean Difference (IV, Random, 95% CI) | ‐0.32 [‐2.47, 1.83] |
| 21 CRQ ‐ Fatigue (points), subgroup analysis by training modes | 3 | 162 | Mean Difference (IV, Random, 95% CI) | ‐0.27 [‐1.72, 1.18] |
| 21.1 Cycle training | 2 | 121 | Mean Difference (IV, Random, 95% CI) | ‐0.26 [‐2.07, 1.56] |
| 21.2 Combination of cycle and treadmill walk training | 1 | 41 | Mean Difference (IV, Random, 95% CI) | ‐0.30 [‐2.73, 2.13] |
| 22 CRQ ‐ Emotional (points), subgroup analysis by volume of work | 3 | 162 | Mean Difference (IV, Random, 95% CI) | 0.59 [‐1.30, 2.47] |
| 22.1 Similar volume of work | 2 | 77 | Mean Difference (IV, Random, 95% CI) | 0.60 [‐1.78, 2.98] |
| 22.2 Different volume of work | 1 | 85 | Mean Difference (IV, Random, 95% CI) | 0.49 [‐2.86, 3.84] |
| 23 CRQ ‐ Emotional (points), subgroup analysis by training modes | 3 | 162 | Mean Difference (IV, Random, 95% CI) | 0.59 [‐1.30, 2.47] |
| 23.1 Cycle training | 2 | 121 | Mean Difference (IV, Random, 95% CI) | 0.99 [‐1.07, 3.06] |
| 23.2 Combination of cycle and treadmill walk training | 1 | 41 | Mean Difference (IV, Random, 95% CI) | ‐1.5 [‐6.17, 3.17] |
| 24 CRQ ‐ Mastery (points), subgroup analysis by volume of work | 3 | 162 | Mean Difference (IV, Random, 95% CI) | ‐0.02 [‐1.65, 1.61] |
| 24.1 Similar volume of work | 2 | 77 | Mean Difference (IV, Random, 95% CI) | ‐0.79 [‐2.56, 0.98] |
| 24.2 Different volume of work | 1 | 85 | Mean Difference (IV, Random, 95% CI) | 1.24 [‐0.93, 3.41] |
| 25 CRQ ‐ Mastery (points), subgroup analysis by training modes | 3 | 162 | Mean Difference (IV, Random, 95% CI) | ‐0.02 [‐1.65, 1.61] |
| 25.1 Cycle training | 2 | 121 | Mean Difference (IV, Random, 95% CI) | 0.70 [‐0.93, 2.34] |
| 25.2 Combination of cycle and treadmill walk training | 1 | 41 | Mean Difference (IV, Random, 95% CI) | ‐1.60 [‐4.12, 0.92] |
2.2. Analysis.
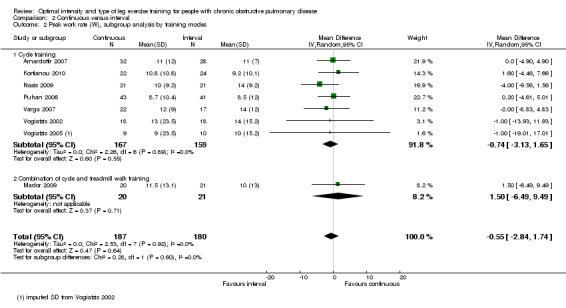
Comparison 2 Continuous versus interval, Outcome 2 Peak work rate (W), subgroup analysis by training modes.
2.12. Analysis.
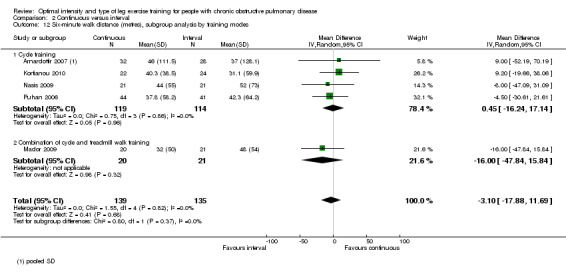
Comparison 2 Continuous versus interval, Outcome 12 Six‐minute walk distance (metres), subgroup analysis by training modes.
2.17. Analysis.
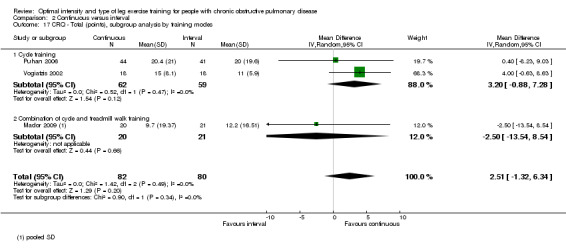
Comparison 2 Continuous versus interval, Outcome 17 CRQ ‐ Total (points), subgroup analysis by training modes.
2.19. Analysis.
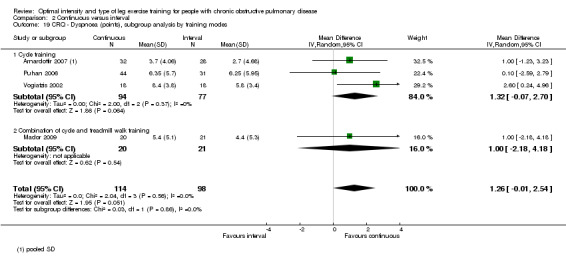
Comparison 2 Continuous versus interval, Outcome 19 CRQ ‐ Dyspnoea (points), subgroup analysis by training modes.
2.21. Analysis.
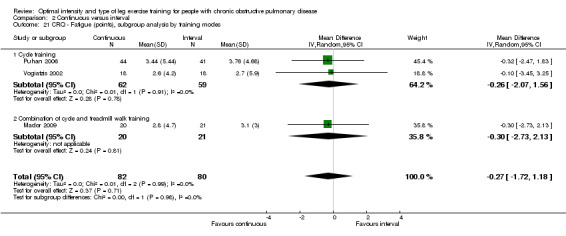
Comparison 2 Continuous versus interval, Outcome 21 CRQ ‐ Fatigue (points), subgroup analysis by training modes.
2.23. Analysis.
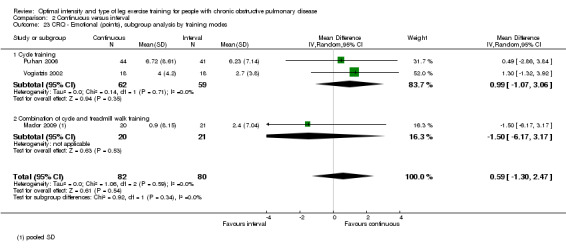
Comparison 2 Continuous versus interval, Outcome 23 CRQ ‐ Emotional (points), subgroup analysis by training modes.
2.25. Analysis.
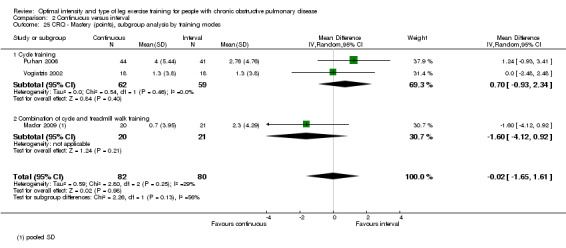
Comparison 2 Continuous versus interval, Outcome 25 CRQ ‐ Mastery (points), subgroup analysis by training modes.
Characteristics of studies
Characteristics of included studies [ordered by study ID]
Arnardottir 2007.
| Methods | STUDY DESIGN: parallel RCT INCLUSION CRITERIA: COPD, FEV1 < 60% predicted and FEV1/FVC < 0.7 post‐bronchodilator EXCLUSION CRITERIA: any diseases limiting exercise such as ischaemic coronary disease and musculoskeletal problems |
|
| Participants | 2 outpatient centres in Sweden, 60 participants (9 males, 51 females; FEV1 range 14% to 59% predicted, age range 43 to 80) Continuous group (n = 32, 26 females): mean (SD) age 64 (8) years, FEV1 32 (10)% predicted Interval group (n = 28, 25 females): mean (SD) age 65 (7) years, FEV1 35 (13)% predicted |
|
| Interventions | Continuous: cycling at 65% peak W for 27 minutes, plus warm‐up and cool‐down at 30% to 40% peak W for 6 minutes each; total effective training time was 27 minutes per session Interval: cycling at 80% peak W (3 minutes) and 30% to 40% peak W (3 minutes), allowing 5 parts of 80% peak W alternating with 4 parts of 30% to 40% peak W, plus warm‐up and cool‐down at 30% to 40% peak W for 6 minutes each; total effective training time was 27 minutes per session Programme: 2 days a week for 16 weeks; plus breathing exercises, relaxation exercises and resistance training |
|
| Outcomes | 1) Peak VO2, VCO2, VE, peak W, peak Borg dyspnoea (CR‐10) and fatigue 2) 12‐minute walk distance (12MWD) 2) Isotime VO2, Borg dyspnoea (CR‐10) and RPE 3) CRQ ‐ Dyspnoea domain, SF‐36 Physical function domain |
|
| Notes | 1) A criterion for fulfilling training completion was at least 24 out of 32 sessions 2) Out of 100 participants included, only 60 completed. Forty participants did not complete 24 sessions and were excluded 3) The drop‐outs had significantly higher functional residual capacity, residual volume and total lung capacity, thus indicating a more severe disease 4) Reasons for drop‐out: exacerbations (n = 24), lack of motivation or transport problems (n = 10), other diseases (n = 5) and family problem (n = 1) 5) Peak test: incremental cycle test started at 20 W with 10 W increment every minutes (no gas exchange analysis) 6) Semi‐steady state cycle ergometer test with breath‐by‐breath analysis: started at 20 W with increment of 5 to 30 W, depending on outcome of peak test, at every level (3 to 4 minutes) until VO2, VE plateau 7) Progression performed but not explicitly explained |
|
| Risk of bias | ||
| Bias | Authors' judgement | Support for judgement |
| Random sequence generation (selection bias) | Low risk | After stratification (FEV1 ≥ 40% predicted as moderate, and FEV1 < 40% as severe), participants were randomised into "blocks of 4" |
| Allocation concealment (selection bias) | Low risk | Stated "closed envelope" |
| Blinding (performance bias and detection bias) All outcomes | Unclear risk | No information given |
| Incomplete outcome data (attrition bias) All outcomes | High risk | The proportion of withdrawals (non‐completers) in each group is not explicit, although the reasons for exclusion were explained. Apart from having more severe lung function, "no other baseline values were different from the patients who completed the programme". A 40% drop‐out was significant and no intention‐to‐treat analysis was performed. This might be a potential source of bias |
| Selective reporting (reporting bias) | Low risk | All pre‐specified outcome measures are reported in the study |
Casaburi 1991.
| Methods | STUDY DESIGN: parallel RCT INCLUSION CRITERIA: COPD with history of smoking, FEV1 < 80% predicted and FEV1/FVC < 0.8, and no disease limiting exercise EXCLUSION CRITERIA: end exercise lactate < 3 mEq/L, presentation of ectopics with peak exercise test |
|
| Participants | Outpatient pulmonary rehabilitation in Italy; 19 males with COPD (mean FEV1 56% predicted, mean age 52 years) Higher‐intensity group (n = 11): mean (SD) age 49 (11) years, FEV1 56 (14)% predicted Lower‐intensity group (n = 8): mean (SD) age 54 (8) years, FEV1 56 (12)% predicted |
|
| Interventions | Higher intensity: continuous cycling at 60% of the difference between peak work rate and the work rate where anaerobic threshold (AT) occurs or 80% peak work rate if AT was not detected (45 minutes per session) Lower intensity: continuous cycling at 90% of the work rate where AT occurs or 50% peak work rate if AT was not detected (duration proportionate to ratio of intensity, i.e. 45 minutes x higher intensity/lower intensity = estimated at 72 minutes per session) Programme: 5 days a week for 8 weeks |
|
| Outcomes | 1) Major outcome: peak lactate 2) Lactate threshold 3) Endurance time 4) Isowork and isotime VO2, VCO2, VE, lactate |
|
| Notes | 1) Withdrawals: 5 participants were pre‐excluded based on exercise testing (2 developed complex ectopy, 3 failed to exceed blood lactate level of 3 mEq/L 2) Peak exercise test: incremental cycle test, 3 minutes unloaded and 10 W increment every minute until volitional exhaustion 3) Two constant‐work rate cycle test (CWR): a) High intensity CWR at 60% (peak W ‐ AT work rate) or 80% peak work rate if AT was not detected b) Low intensity CWR at 90% AT work rate or 50% peak work rate if AT was not detected |
|
| Risk of bias | ||
| Bias | Authors' judgement | Support for judgement |
| Random sequence generation (selection bias) | Unclear risk | Stated "by random assignment" |
| Allocation concealment (selection bias) | Unclear risk | Not stated |
| Blinding (performance bias and detection bias) All outcomes | Unclear risk | Not stated |
| Incomplete outcome data (attrition bias) All outcomes | Low risk | No missing outcome data |
| Selective reporting (reporting bias) | Low risk | All pre‐specified outcome measures mentioned in the protocol are reported explicitly either in text, tables or figures |
Kortianou 2010.
| Methods | STUDY DESIGN: parallel RCT INCLUSION CRITERIA: COPD; FEV1 < 80% predicted, FEV1/FVC < 0.7 post bronchodilation; adherence to the medical therapy and the training sessions EXCLUSION CRITERIA: cardiovascular, metabolic, orthopaedic or neuromuscular diseases limiting exercise |
|
| Participants | In Greece, 46 participants with COPD (mean FEV1 42% predicted) Continuous group (n = 22, 21 males): mean (SD) age 67 (7) years, FEV1 45 (19)% predicted Interval group (n = 24, 23 males): mean (SD) age 64 (10) years, FEV1 40 (19)% predicted |
|
| Interventions | Continuous: cycling at 60% peak W for 40 minutes per session Interval: cycling at 100% peak W (30 seconds) and rest (30 seconds) for 40 minutes per session Programme: supervised exercise 3 days a week for 10 weeks |
|
| Outcomes | 1) Peak W 2) 6MWD 3) SGRQ 4) Peak dyspnoea |
|
| Notes | 1) Withdrawals: 2 withdrew due to exacerbation in continuous group; 1 withdrew due to exacerbation in interval group 2) Peak test: incremental cycle test, 3 minutes unloaded, 5 to 10 W increment every minute until exhaustion 3) Only abstract was available, no full‐text found; author corresponded with unpublished data |
|
| Risk of bias | ||
| Bias | Authors' judgement | Support for judgement |
| Random sequence generation (selection bias) | Unclear risk | From correspondence, author stated: the subjects were matched at the beginning of the study according to age, FFMI, baseline lung function and exercise capacity parameters. However, no actual process of randomisation was stated |
| Allocation concealment (selection bias) | Unclear risk | Not stated by author in correspondence |
| Blinding (performance bias and detection bias) All outcomes | Low risk | Participants and trainers were blinded, but not assessors |
| Incomplete outcome data (attrition bias) All outcomes | Unclear risk | Difficult to ascertain as unpublished data were obtained through correspondence |
| Selective reporting (reporting bias) | Unclear risk | Difficult to ascertain as unpublished data were obtained through correspondence |
Mador 2009.
| Methods | STUDY DESIGN: parallel RCT INCLUSION CRITERIA: COPD, quit smoking ≥ 3 months EXCLUSION CRITERIA: not stated |
|
| Participants | Veterans Affairs New York Healthcare; 41 participants with COPD (mean FEV1 45% predicted, mean age 72 years) Continuous group (n = 20, 16 males): mean (SD) age 72 (8) years, FEV1 42 (13)% predicted Interval group (n = 21, 17 males): mean (SD) age 72 (7) years, FEV1 45 (14)% predicted |
|
| Interventions | Continuous: cycling at 50% peak W (20 minutes) and treadmill at 80% of average speed in 6MWT and 0% elevation (20 minutes); total training duration was 40 minutes per session Interval: cycling and treadmill at 150% of continuous target (1 minute) and 75% of target (2 minute) for 21 minutes; total training duration was 42 minutes per session Programme: 3 days a week for 8 weeks; plus education and callisthenics |
|
| Outcomes | 1) Peak VO2, peak W 2) 6MWD, endurance time from endurance cycle test 3) Isowork, isotime VO2, VE, VCO2 4) CRQ ‐ all domains 5) Muscle strength (twitch force) |
|
| Notes | 1) Withdrawals: 3 failed to complete the programme in the continuous group; 3 failed to complete and 1 did not complete post‐rehabilitation measures in the interval group 2) Peak test: incremental cycle test, 1 minute unloaded, 10 W increment every minute until exhaustion 3) Constant workload test: 1 minute unloaded and a further 2 minutes at 10 W, and finally 60% to 70% peak W until exhaustion 4) Training progression in both groups: cycling workload increased by 10% and treadmill speed increased by 5% to 10% |
|
| Risk of bias | ||
| Bias | Authors' judgement | Support for judgement |
| Random sequence generation (selection bias) | Low risk | Random assignment of classes of 3 to 5 participants |
| Allocation concealment (selection bias) | Unclear risk | Stated "randomisation was concealed", but no specific detail on method of concealment |
| Blinding (performance bias and detection bias) All outcomes | Unclear risk | Assessor‐blinded only for 6MWT and CRDQ measures |
| Incomplete outcome data (attrition bias) All outcomes | Low risk | No missing outcome data. Drop‐outs are accounted for and balanced in both groups, therefore are unlikely to impact on data |
| Selective reporting (reporting bias) | Low risk | All pre‐specified outcome measures mentioned in the protocol are reported explicitly either in text, tables or figures |
Maltais 2008.
| Methods | STUDY DESIGN: parallel non‐inferiority RCT INCLUSION CRITERIA: stable COPD, no change in medications and symptoms for at least 4 weeks before the study; participants ≥ 40 years old; current/former smokers ≥ 10 pack‐years; FEV1 < 70% predicted, FEV1/FVC < 0.7; Medical Research Council Dyspnoea ≥ 2; naive to pulmonary rehabilitation programme; understood written and spoken French or English EXCLUSION CRITERIA: previous diagnosis of asthma, congestive left heart failure as the primary diagnosis, terminal disease, and dementia and any uncontrolled psychiatric disease |
|
| Participants | 10 multi‐centre academic and community medical centres in Canada; 252 participants (140 males) with COPD (mean FEV1 39% predicted, mean age 70 years) Higher‐intensity group (n = 114): mean (SD) age 66 (9) years, FEV1 43 (13)% predicted Lower‐intensity group (n = 119): mean (SD) age 66 (9) years, FEV1 46 (13)% predicted |
|
| Interventions | Higher intensity (supervised outpatient): continuous cycling at 80% peak W for 30 minutes per session Lower intensity (home rehabilitation): continuous cycling at 60% peak W for 40 minutes per session Programme: 3 days a week for 8 weeks; include strength training programme of same intensity in both groups. Training programme commenced after 4 weeks of standardised education in both groups. |
|
| Outcomes | 1) CRQ domains ‐ primary outcome 2) 6MWD 3) Cycle endurance time 4) SGRQ |
|
| Notes | 1) Withdrawals: 11 withdrawn on consent and 1 lost to follow‐up in the higher‐intensity group; 6 withdrawn on consent and 1 lost to follow‐up in the lower‐intensity group 2) Participants were followed up at 3 months and 1 year. Primary outcome was only reported on those who stayed until 1 year. Secondary outcomes were reported as per protocol. Drop‐outs had similar characteristics as participants. 3) Peak test: symptom‐limited incremental cycle test 4) Constant workload cycle test: at 80% peak W 5) Study protocol permitted adjustment of training intensity according to dyspnoea level, heart rate, dizziness and unusually severe chest and leg discomfort |
|
| Risk of bias | ||
| Bias | Authors' judgement | Support for judgement |
| Random sequence generation (selection bias) | Low risk | Centrally administered, computer‐generated permuted block randomisation scheme using blocks of 2, stratified by gender and testing sites |
| Allocation concealment (selection bias) | Unclear risk | Stated: "Study personnel were unaware of the permuted block size", but no specific detail on method of concealment |
| Blinding (performance bias and detection bias) All outcomes | High risk | Editor's statement: "The study was unblinded" |
| Incomplete outcome data (attrition bias) All outcomes | Low risk | Drop‐outs were accounted for and reasons for drop‐outs explained. Intention‐to‐treat analysis was used. |
| Selective reporting (reporting bias) | Low risk | Study protocol was clearly explained and all pre‐specified outcome measures are reported in the study |
Nasis 2009.
| Methods | STUDY DESIGN: parallel RCT INCLUSION CRITERIA: COPD, age < 75 years, FEV1 ≤ 80% predicted with ≤ 12% reversibility post‐bronchodilator EXCLUSION CRITERIA: no co‐existing disease affecting ability to exercise |
|
| Participants | In Greece; 42 participants (33 males) with COPD (mean FEV1 42% predicted, mean age 66 years) Continuous group: mean (SD) age 66 (14) years, FEV1 44 (19)% predicted Interval group: mean (SD) age 65 (14) years, FEV1 40 (18)% predicted |
|
| Interventions | Continuous: cycling at 60% peak W for 30 minutes per session Interval: cycling at 100% peak W (30 seconds) and rest (30 seconds) for 40 minutes per session Programme: 3 days a week for 10 weeks; plus education and breathing exercises |
|
| Outcomes | 1) Peak W 2) 6MWD 3) Borg (CR‐10) dyspnoea and RPE (leg fatigue) 4) BODE Index |
|
| Notes | 1) Withdrawals: None 2) Peak test: Incremental cycle test, 3 minutes unloaded, 5 to 10 W increment every minute 3) Progression of total workload increased weekly for each group but not explicitly explained |
|
| Risk of bias | ||
| Bias | Authors' judgement | Support for judgement |
| Random sequence generation (selection bias) | Unclear risk | Stratified randomisation: FEV1 (≤ or > 50% predicted) and peak WR (≤ or > 50 W) |
| Allocation concealment (selection bias) | Unclear risk | Not stated |
| Blinding (performance bias and detection bias) All outcomes | Unclear risk | Not stated |
| Incomplete outcome data (attrition bias) All outcomes | Low risk | No withdrawals stated |
| Selective reporting (reporting bias) | Low risk | All pre‐specified outcome measures mentioned in the protocol are reported explicitly either in text, tables or figures |
Puhan 2006.
| Methods | STUDY DESIGN: Non‐inferiority parallel RCT INCLUSION CRITERIA: COPD, FEV1/FVC < 0.7, FEV1 ≤ 50% predicted post‐bronchodilator, German‐speaking EXCLUSION CRITERIA: any cardiovascular, neurological and musculoskeletal inhibiting exercise, and cancer (except skin) within past 2 years and undergoing treatment |
|
| Participants | Inpatient pulmonary rehabilitation programme in Switzerland; 86 participants with COPD (mean FEV1 34% predicted, mean age 69 years) Continuous group (n = 44): mean (SD) age 69 (9) years, FEV1 34 (8)% predicted Interval group (n = 42): mean (SD) age 69 (9) years, FEV1 35 (9)% predicted |
|
| Interventions | Continuous: cycling at 70% peak W for 20 minutes plus warm‐up at 20% peak W for 2 minutes and cool‐down for 2 minutes (gradual decrease from 70% to zero) Interval: cycling at 50% short‐term peak exercise* (20 seconds) and 10% short‐term peak exercise (40 seconds) for 20 minutes plus warm‐up at 10% short‐term peak exercise for 2 minutes and cool‐down for 2 minutes (gradual decrease from 70% to zero) Programme: sessions of 24 minutes, 5 days a week for 3 weeks; plus breathing and relaxation therapy, education |
|
| Outcomes | 1) Peak W 2) 6MWD 3) CRQ ‐ all domains 4) Hospital Anxiety and Depression Scale |
|
| Notes | 1) Withdrawals: continuous ‐ 2 patients with exacerbations, 1 musculoskeletal pain, 1 chest pain, 1 accident and 1 newly diagnosed lung cancer; interval ‐ 3 exacerbations, 2 musculoskeletal pain 2) Peak test: a) incremental cycle test, 3 minutes at 20 W and 7.5 W increment every minute b) short‐term peak test, 2 minutes unloaded, and 25 W every 10 seconds (steep ramp) *50% short‐term peak exercise determined by a steep ramp test corresponds to 90% to 100% of normal peak exercise capacity from an incremental test 3) Progression: workload increased by 10% of baseline for each group |
|
| Risk of bias | ||
| Bias | Authors' judgement | Support for judgement |
| Random sequence generation (selection bias) | Low risk | Online central randomisation using a computerised minimisation |
| Allocation concealment (selection bias) | Low risk | Stated the computerised minimisation procedure ensured "concealment of randomisation" |
| Blinding (performance bias and detection bias) All outcomes | Low risk | Exercise testers blinded to exercise sessions and group assignment and researchers remained blinded to group assignment when data entry and analysis was performed |
| Incomplete outcome data (attrition bias) All outcomes | Low risk | Appropriate imputation of data and intention‐to‐treat analysis performed for missing data |
| Selective reporting (reporting bias) | Low risk | Pre‐specified outcome measures all reported and statistical analysis explained clearly and executed in the protocol |
Santos 2010.
| Methods | STUDY DESIGN: parallel RCT INCLUSION CRITERIA: stable COPD, FEV1/FVC < 70% and medical referral for exercise training EXCLUSION CRITERIA: unable to attend 3 times/week programme, infectious disease, metastatic neoplasia, unstable cardiac disease, neuromusculoskeletal disorder, psychiatric or cognitive disorder |
|
| Participants | In Portugal; 34 participants (22 males) with COPD Higher‐intensity group (n = 13): mean (SD) age 67 (10) years, FEV1 52 (17)% predicted Lower‐intensity group (n = 15): mean (SD) age 67 (11) years, FEV1 53 (19)% predicted |
|
| Interventions | Higher intensity: continuous cycling or treadmill (according to participant's preference) at 80% peak W for 30 minutes per session Lower intensity: continuous cycling or treadmill (according to participant's preference) at 60% peak W for 30 minutes per session Programme: 3 days a week for 20 sessions |
|
| Outcomes | 1) Peak W, peak dyspnoea (modified Borg) 2) 6MWD 3) Endurance time 4) SGRQ ‐ all domains; LCADL 5) Mahler Dyspnoea Index |
|
| Notes | 1) Withdrawals: 4 withdrew due to drop‐out, intestinal surgery, thyroid dysfunction and atrial fibrillation, lower limb effort‐related pain in higher‐intensity group; 2 withdrew due to professional commitments, respiratory infection in lower‐intensity group 2) Peak test: incremental cycle test, 10 W increment every minute until exhaustion; incremental treadmill test 0.5 Km/h per minute at 0% until fast walking without running and then 2% per minute 3) Constant work rate test: 3 minutes of warm‐up and 80% of peak work rate from maximal incremental test 4) Only abstract was available, no full‐text found; author corresponded with unpublished data |
|
| Risk of bias | ||
| Bias | Authors' judgement | Support for judgement |
| Random sequence generation (selection bias) | Low risk | Author reply: "Allocation of randomisation by computer generated table of pseudo‐random numbers. Block randomisation of size 2 with allocation ratio of 1:1 and stratification by FEV1 cut off 50%, resulting in COPD mild‐moderate and COPD severe‐very severe patients". |
| Allocation concealment (selection bias) | Unclear risk | Author reply: "Allocation concealment was applied according to the sequence of readiness of maximal exercise incremental test as admission criteria for pulmonary rehabilitation program". However, it does not explain how allocation was concealed. |
| Blinding (performance bias and detection bias) All outcomes | Low risk | Author reply: patients were blinded |
| Incomplete outcome data (attrition bias) All outcomes | Unclear risk | Difficult to ascertain as unpublished data were obtained through correspondence |
| Selective reporting (reporting bias) | Unclear risk | Difficult to ascertain as unpublished data were obtained through correspondence |
Varga 2007.
| Methods | STUDY DESIGN: parallel RCT INCLUSION CRITERIA: not specified EXCLUSION CRITERIA: severe cardiovascular, neurological and exercise limiting joint diseases |
|
| Participants | In Hungary; 79 participants with COPD; only 39 participants in groups appropriate for review (30 males) (mean FEV1 57% predicted, mean age 64 years) Continuous group (n = 22, 19 males): mean (SD) age 61 (12) years, FEV1 51 (16)% predicted Interval group (n = 17, 11 males): mean (SD) age 67 (10) years, FEV1 64 (29)% predicted |
|
| Interventions | Continuous: cycling at 80% peak W for 45 minutes per session Interval: cycling at 90% peak W (2 minutes) and 50% peak W (1 minute) for 30 minutes plus warm‐up and cool‐down at 50% peak W for 7.5 minutes each; total exercise duration was 45 minutes per session Programme: 3 days a week for 8 weeks |
|
| Outcomes | 1) Peak VO2, peak W, lactate threshold 2) Isotime VO2, VE 3) Borg (CR‐10) scores of dyspnoea and RPE |
|
| Notes | 1) No withdrawals 2) Peak test: incremental cycle test, 3 minutes at 20 W and 5, 10 or 15 W increment every minute according to FEV1 (FEV1 < 1.0 L ‐ 5 W, FEV1 > 1.0 L ‐ 10 W, FEV1 > 1.5 L ‐ 15 W) 3) Also included an unsupervised self paced group on cycle, walk and climb stairs in own environment; and the allocation of this group was based on unreasonable travel distances to the study centre 4) Progression of exercise duration time to a target of 45 minutes, but proportion and frequency of progression not explicitly explained |
|
| Risk of bias | ||
| Bias | Authors' judgement | Support for judgement |
| Random sequence generation (selection bias) | Unclear risk | Not stated |
| Allocation concealment (selection bias) | Unclear risk | Not stated |
| Blinding (performance bias and detection bias) All outcomes | Unclear risk | Not stated |
| Incomplete outcome data (attrition bias) All outcomes | Low risk | No missing data |
| Selective reporting (reporting bias) | Low risk | All outcomes and data analysis pre‐specified in the protocol are reported in the study |
Vogiatzis 2002.
| Methods | STUDY DESIGN: parallel RCT INCLUSION CRITERIA: COPD, FEV1/FVC < 0.65, FEV1 ≤ 60% predicted without significant reversibility (< 15% change) EXCLUSION CRITERIA: no cardiovascular and neurological disease limiting exercise |
|
| Participants | Outpatient pulmonary rehabilitation centre in Greece; 36 participants (30 males) with COPD (mean FEV1 45% predicted, mean age 68 years) Continuous group (n = 18, 14 males): mean (SD) age 69 (8) years, FEV1 44 (15)% predicted Interval group (n = 17, 11 males): mean (SD) age 67 (8) years, FEV1 45 (16)% predicted |
|
| Interventions | Continuous: cycling at 50% peak W for 40 minutes per session Interval: cycling at 100% peak W (30 seconds) and rest (30 seconds) for 40 minutes per session Programme: 40 minutes session, 2 days a week for 12 weeks; plus breathing exercises, education, relaxation exercises, secretion clearance techniques and psychosocial support |
|
| Outcomes | 1) Peak VO2, peak W, lactate threshold 2) Isowork VO2, VCO2, VE 3) Borg (CR‐10) scores of dyspnoea 4) CRQ ‐ all domains |
|
| Notes | 1) Withdrawals: 4 patients from continuous group and 5 from interval due to pulmonary infection and non‐compliance. No difference in baseline characteristics. 2) Peak test: incremental cycle test, 2 minutes unloaded and 5 to 10 W ramp increment every minute 3) Progression monthly equal in magnitude in both groups |
|
| Risk of bias | ||
| Bias | Authors' judgement | Support for judgement |
| Random sequence generation (selection bias) | Unclear risk | Stratified randomisation: FEV1 (≤ or > 50% predicted) and peak WR (≤ or > 70 W) |
| Allocation concealment (selection bias) | Unclear risk | Not stated |
| Blinding (performance bias and detection bias) All outcomes | Unclear risk | Not stated |
| Incomplete outcome data (attrition bias) All outcomes | Low risk | No missing data |
| Selective reporting (reporting bias) | Low risk | All pre‐specified outcome measures reported either in text or figures |
Vogiatzis 2005.
| Methods | STUDY DESIGN: parallel RCT INCLUSION CRITERIA: COPD, FEV1/FVC < 0.7, FEV1 ≤ 50% predicted post‐bronchodilator without > 12% change EXCLUSION CRITERIA: no cardiovascular and neurological disease limiting exercise |
|
| Participants | Outpatient pulmonary rehabilitation centre in Greece; 19 participants (16 males) with COPD (mean FEV1 42% predicted, mean age 65 years) Continuous group (n = 10): mean (SD) age 67 (6) years, FEV1 39 (18)% predicted Interval group (n = 9): mean (SD) age 64 (9) years, FEV1 44 (19)% predicted |
|
| Interventions | Continuous: cycling at 60% peak W for 30 minutes per session; Interval: cycling at 100% peak W (30 seconds) and rest (30 seconds) for 45 minutes per session Programme: supervised exercise 3 days a week for 10 weeks; plus breathing exercises, education, relaxation exercises, secretion clearance techniques and psychosocial support |
|
| Outcomes | 1) Main outcomes: skeletal muscle fibre typing, cross‐sectional area, capillarisation and enzyme activity 2) Peak VO2, peak W, lactate threshold |
|
| Notes | 1) Peak test: incremental cycle test, 3 minutes unloaded and 5 to 10 W ramp increment every minute 2) Progression monthly equal in magnitude in both groups |
|
| Risk of bias | ||
| Bias | Authors' judgement | Support for judgement |
| Random sequence generation (selection bias) | Unclear risk | Stratified randomisation: FEV1 (≤ or > 40% predicted) and peak WR (≤ or > 50 W) |
| Allocation concealment (selection bias) | Unclear risk | Not reported |
| Blinding (performance bias and detection bias) All outcomes | Low risk | Author reply: participants and assessors were blinded |
| Incomplete outcome data (attrition bias) All outcomes | Low risk | No missing outcome data |
| Selective reporting (reporting bias) | High risk | Although all pre‐specified primary outcomes of the study are reported as per protocol, the primary outcomes are not of interest to the review. On the other hand, some of the secondary outcomes (i.e. exercise capacity) which are of interest are either reported incompletely (missing SEMs in VO2) or lack of comparison of an outcome measure between groups (only isowork VE of interval group reported) |
6MWT: six‐minute walk test; AT: anaerobic threshold; BODE: The BODE Index is a composite marker of disease taking into consideration the systemic nature of COPD, (B) body mass index; (O) airflow obstruction measured by the forced expiratory volume in one second (FEV1); (D) dyspnoea measured by the modified Medical Research Council (MRC) scale; and (E) exercise capacity measured by the 6‐minute walk distance (6MWD); COPD: chronic obstructive pulmonary disease; CRQ: Chronic Respiratory Disease Questionnaire; CWR: constant‐work rate; FEV1: forced expiratory volume in one second; FFMI: Fat Free Mass Index; FVC: forced vital capacity; LCADL: London Chest Activity of Daily Living scale; RCT: randomised controlled trial; RPE: Rating of Perceived Exertion Scales; SD: standard deviation; SEM: standard error of the mean; SGRQ: St George's Respiratory Questionnaire; VO2: oxygen consumption; VCO2: carbon dioxide production; VE: minute ventilation; W: watts; WR: work rate
Characteristics of excluded studies [ordered by study ID]
| Study | Reason for exclusion |
|---|---|
| Alison 1981 | Not RCT |
| Belman 1982 | No comparison group with different intensity |
| Bjornshave 2005 | Different duration of training session and frequency per week |
| Borghi‐Silva 2009 | Usual care group had no exercise training |
| Cambach 1997 | Usual care group had no exercise training; only prescription of drugs |
| Carrieri‐Kohlman 2005 | Different number of training sessions (lengths of programme) |
| Casaburi 1997 | Not RCT |
| Christensen 2004 | Different modes of exercise |
| Clark 1996 | Control group had no exercise training |
| Coppoolse 1999 | The 'interval training' group performed a mixed training protocol of both interval training for 3 days and continuous training for 2 days while the 'continuous training' group performed a continuous training protocol for all 5 days. The mixed protocol is not of a strictly interval nature and thus, renders the study ineligible for the review. |
| Costes 2004 | No comparison group with different intensity |
| Debigare 1999 | Not RCT |
| Fink 2005 | Not RCT |
| Franco 1998 | No exercise training; only exercise tests |
| Franssen 2004 | No comparison group with different intensity |
| Gigliotti 2003 | Not RCT |
| Gimenez 2000 | Different modes of training (i.e. cycle training versus walking training) |
| Gosselin 2003 | Not RCT |
| Guell 2008 | Different modes of training (i.e. cycle training versus walking training) |
| Helgerud 2010 | Not RCT |
| Hentschel 2002 | Control group had no exercise training |
| Hernandez 2000 | Control group had no exercise training |
| Hsieh 2007 | Not RCT (participants are not randomised) |
| Kaelin 1999 | Abstract and intensity of exercise prescribed not explicitly reported. Author of study did not respond to review author's request for data. No full text published. |
| Kaelin 2001 | No comparison group with different intensity/type |
| Kirsten 1998 | Control group had no exercise training |
| Lonsdorfer‐Wolf 2004 | No exercise training; only exercise tests |
| Mador 2000 | No exercise training; only exercise tests |
| Maltais 1997 | Not RCT |
| Marrara 2008 | Different body parts training programme (lower limbs versus upper limbs) and control group had no exercise training |
| Matthews 1989 | No exercise training; only exercise tests |
| Normandin 2002 | Different modes of training (i.e. treadmill and cycle training versus callisthenics) |
| Noseda 1992 | No exercise training; only exercise tests |
| O'Donnell 1995 | Control group had no exercise training |
| O'Donnell 1998 | No comparison group with different intensity |
| O'Donnell 2006 | No exercise training; only exercise tests |
| Oga 2004 | No exercise training; only exercise tests |
| Pineda 1986 | Not RCT |
| Pitta 2004 | Control group had no exercise training |
| Porszasz 2005 | Not RCT |
| Probst 2006 | Not RCT |
| Puente‐Maestu 2000 | The intensity for the lower‐intensity training group was not explicitly measured, but was only estimated |
| Puente‐Maestu 2003a | Different duration of training session and frequency per week |
| Puente‐Maestu 2003b | No exercise training; only exercise tests |
| Puente‐Maestu 2005 | No exercise training; only exercise tests |
| Puente‐Maestu 2006 | Control group had no exercise training |
| Punzal 1991 | Not RCT |
| Ramirez‐Venegas 1997 | Not RCT |
| Ruiz 2004 | Different frequency of sessions per week |
| Sabapathy 2004 | No exercise training; only exercise tests |
| Santiworakul 2009 | Control group had no exercise training |
| Serres 1997 | Control group had no exercise training |
| Strijbos 1996 | No comparison to different intensity |
| Vallet 1997 | Same training intensity groups |
| Varga 2005 | Different combinations of modes of training compared |
| Vogiatzis 2004 | No exercise training; only exercise tests |
| Wijkstra 1996 | Usual care had no exercise training |
| Wurtemberger 2001 | Aerobic training versus strength training |
| Zacarias 2000 | Not RCT |
RCT: randomised controlled trial
Characteristics of studies awaiting assessment [ordered by study ID]
Moon 2009.
| Methods | STUDY DESIGN: parallel controlled trial |
| Participants | 41 participants; mean (SD) FEV1 61 (21) % predicted |
| Interventions | 12 weeks of home‐based pulmonary rehabilitation programme consisting of aerobic walking exercise, muscle strength training, stretching and education. Walking exercise intensity at 60% VO2max. Training 3 times a week, 20 minutes per session. Higher‐level exercise group: energy consumption > 10 Kcal/kg/day) Lower‐level exercise group: energy consumption < 10 Kcal/kg/day) |
| Outcomes | 1) VO2max 2) 6MWD 3) Quality of life: SGRQ |
| Notes | 1) Abstract with insufficient outcome data 2) Intensity allocated for each level exercise group is unclear 3) No contact details |
Wen 2008.
| Methods | STUDY DESIGN: parallel RCT |
| Participants | Rehabilitation programme of bicycle exercise training: 32 participants with moderate to severe COPD Higher‐intensity group (n = 17) Lower‐intensity group (n = 15) |
| Interventions | Bicycle exercise training 2 days a week for 12 weeks Higher‐intensity group: exercise at the highest level of intensity tolerated Lower‐intensity group: exercise at an intensity corresponding to anaerobic threshold |
| Outcomes | 1) VO2peak % predicted 2) Isowork minute ventilation, breathing frequency, tidal volume 3) HR, oxygen pulse 4) Dyspnoea |
| Notes | 1) Data obtained from abstract 2) Full text is in a foreign language and has yet to be translated |
6MWD: distance walked in a six‐minute walk test; COPD: chronic obstructive pulmonary disease; FEV1: forced expiratory volume in one second; HR: heart rate; RCT: randomised controlled trial; SD: standard deviation; SGRQ: St George's Respiratory Questionnaire; VO2: oxygen consumption
Differences between protocol and review
Types of intervention ‐ the criterion for trials of four weeks or more was changed to a criterion for trials of 12 sessions or more.
Dealing with missing data ‐ added a method of calculating SD change by using the method of pooling the SDs of baseline and post‐intervention means.
Outcome measures ‐ added lactate threshold, VE and isotime/isowork measures.
Subgroup analyses ‐ severity is not technically a subgroup analysis and was removed. We included training modes (cycle or treadmill‐walking training) as an additional subgroup analysis based on peer review comments.
Statistical significance for common effect size and heterogeneity ‐ Chi2 test was changed from 0.05 to 0.10 due to low number of studies.
The title was changed from Intensity and type of exercise for lower limb endurance training to optimise exercise capacity for people with chronic obstructive pulmonary disease to Optimal intensity and type of leg exercise training for people with chronic obstructive pulmonary disease.
Contributions of authors
Rahizan Zainuldin: protocol initiation, development and write‐up; study selection, data extraction, analysis and manuscript preparation.
Martin Mackey: protocol initiation and development; study selection, data extraction, and manuscript review.
Jennifer Alison: protocol initiation and development; review data extraction and manuscript review.
Sources of support
Internal sources
University of Sydney, Australia.
External sources
No sources of support supplied
Declarations of interest
None known.
Edited (no change to conclusions)
References
References to studies included in this review
Arnardottir 2007 {published data only}
Casaburi 1991 {published data only}
- Casaburi R, Patessio A, Ioli F, Zanaboni S, Donner C, Wasserman K. Reductions in exercise lactic acidosis and ventilation as a result of exercise training in patients with obstructive lung disease. American Review of Respiratory Disease 1991;143:9‐18. [DOI] [PubMed] [Google Scholar]
- Patessio A, Carone M, Ioli F, Donner CF. Ventilatory and metabolic changes as a result of exercise training in COPD patients. Chest 1992; Vol. 101, issue 5 Suppl:274S‐8S. [DOI] [PubMed]
Kortianou 2010 {unpublished data only}
- Kortianou E, Cherouveim E, Spetsioti S, Nasis I, Daskalakis A, Terzis G, et al. Effect of interval versus continuous exercise training on exercise tolerance, quality of life and muscle fibre morphology in patients with COPD. European Respiratory Journal 2010;36(54S):E2167. [Google Scholar]
Mador 2009 {published data only}
Maltais 2008 {published data only}
- Maltais F, Bourbeau J, Shapiro S, Lacasse Y, Perrault H, Baltzan M, et al. Effects of home‐based pulmonary rehabilitation in patients with chronic obstructive pulmonary disease: a randomized trial. [Summary for patients in Ann Intern Med. 2008 Dec 16;149(12):I56; PMID: 19075202]. Annals of Internal Medicine 2008; Vol. 149, issue 12:869‐78. [DOI] [PubMed]
Nasis 2009 {published data only}
Puhan 2006 {published data only}
- Puhan MA, Busching G, Schunemann HJ, VanOort E, Zaugg C, Frey M. Interval versus continuous high‐intensity exercise in chronic obstructive pulmonary disease: a randomized trial. [Summary for patients in Ann Intern Med. 2006 Dec 5;145(11):I49; PMID: 17146063]. Annals of Internal Medicine. 2006; Vol. 145, issue 11:816‐25. [DOI] [PubMed]
Santos 2010 {unpublished data only}
- Santos C, Santos J, Morais L, Rodrigues F, Barbara C. Pulmonary rehabilitation in COPD: effects of two aerobic exercise intensity in patient‐centered outcomes ‐ a randomised controlled trial. European Respiratory Journal 2010;36(54S):P2835. [DOI] [PubMed] [Google Scholar]
Varga 2007 {published data only}
Vogiatzis 2002 {published data only}
Vogiatzis 2005 {published data only}
References to studies excluded from this review
Alison 1981 {published data only}
Belman 1982 {published data only}
Bjornshave 2005 {published data only}
Borghi‐Silva 2009 {published data only}
Cambach 1997 {published data only}
- Cambach W, Chadwich‐Straver RVM, Wagenaar RC, Keimpema ARJ, Kemper HCG. The effects of a community‐based pulmonary rehabilitation programme on exercise tolerance and quality‐of‐life: a randomised controlled trial. European Respiratory Journal 1997;10:104‐13. [DOI] [PubMed] [Google Scholar]
Carrieri‐Kohlman 2005 {published data only}
Casaburi 1997 {published data only}
Christensen 2004 {published data only}
Clark 1996 {published data only}
Coppoolse 1999 {published data only}
Costes 2004 {published data only}
Debigare 1999 {published data only}
- Debigare R, Maltais F, Whittom F, Deslauriers J, LeBlanc P. Feasibility and efficacy of home exercise training before lung volume reduction. Journal of Cardiopulmonary Rehabilitation 199;19:235‐41. [DOI] [PubMed] [Google Scholar]
Fink 2005 {published data only}
- Fink G, Rozenberg I. Training programs for patients with severe chronic obstructive pulmonary disease. Israel Medical Association Journal 2005; Vol. 7, issue 3:196‐7. [PubMed]
Franco 1998 {published data only}
Franssen 2004 {published data only}
Gigliotti 2003 {published data only}
- Gigliotti F, Coli C, Bianchi R, Romagnoli I, Lanini B, Binazzi B, et al. Exercise training improves exertional dyspnea in patients with COPD: evidence of the role of mechanical factors. Chest 2003;123(6):1794‐802. [DOI] [PubMed] [Google Scholar]
Gimenez 2000 {published data only}
Gosselin 2003 {published data only}
Guell 2008 {published data only}
- Guell MR, Lucas P, Galdiz JB, Montemayor T, Gonzalez‐Moro JMR, Gorostiza A, et al. Home vs hospital‐based pulmonary rehabilitation for patients with chronic obstructive pulmonary disease: a Spanish multicenter trial. Archivos de Bronconeumologia 2008; Vol. 44, issue 10:512‐8. [PubMed]
Helgerud 2010 {published data only}
Hentschel 2002 {published data only}
Hernandez 2000 {published data only}
Hsieh 2007 {published data only}
Kaelin 1999 {published data only}
- Kaelin ME, Barnard K, Swank A, Adams K, Ponto A. Results of 6 minute ambulation and MET tolerance of patients with severe chronic obstructive pulmonary disease (COPD) utilizing 2 different aerobic training regimes: Interval training versus continuous training. American Society of Exercise Physiologists 2nd Annual Meeting 1999.
Kaelin 2001 {published data only}
- Kaelin ME, Swank AM, Barnard KL, Adams KJ, Beach P, Newman J. Physical fitness and quality of life outcomes in a pulmonary rehabilitation program utilizing symptom limited interval training and resistance training. Journal of Exercise Physiology Online 2001; Vol. 4, issue 3:30‐7.
Kirsten 1998 {published data only}
Lonsdorfer‐Wolf 2004 {published data only}
Mador 2000 {published data only}
Maltais 1997 {published data only}
Marrara 2008 {published data only}
Matthews 1989 {published data only}
Normandin 2002 {published data only}
Noseda 1992 {published data only}
- Noseda A, Carpiaux JP, Schmerber J, Yernault JC. Dyspnoea assessed by visual analogue scale in patients with chronic obstructive lung disease during progressive and high intensity exercise. Thorax 1992; Vol. 47, issue 5:363‐8. [DOI] [PMC free article] [PubMed]
O'Donnell 1995 {published data only}
O'Donnell 1998 {published data only}
O'Donnell 2006 {published data only}
Oga 2004 {published data only}
Pineda 1986 {published data only}
Pitta 2004 {published data only}
Porszasz 2005 {published data only}
Probst 2006 {published data only}
Puente‐Maestu 2000 {published data only}
- Puente‐Maestu L, Sanz ML, Sanz P, Cubillo JM, Mayol J, Casaburi R. Comparison of effects of supervised versus self‐monitored training programmes in patients with chronic obstructive pulmonary disease. European Respiratory Journal 2000;15(3):517‐25. [DOI] [PubMed] [Google Scholar]
- Puente‐Maestu L, Sanz ML, Sanz P, Ruiz de Ona JM, Rodriguez‐Hermosa JL, Whipp BJ. Effects of two types of training on pulmonary and cardiac responses to moderate exercise in patients with COPD. European Respiratory Journal 2000; Vol. 15, issue 6:1026‐32. [DOI] [PubMed]
Puente‐Maestu 2003a {published data only}
Puente‐Maestu 2003b {published data only}
Puente‐Maestu 2005 {published data only}
Puente‐Maestu 2006 {published data only}
Punzal 1991 {published data only}
Ramirez‐Venegas 1997 {published data only}
Ruiz 2004 {published data only}
- Ruiz De Ona Lacasta JM, Garcia De Pedro J, Puente Maestu L, Llorente Inigo D, Celdran Gil J, Cubillo Marcos JM. Effects of muscle training on breathing pattern in patients with severe chronic obstructive pulmonary disease. Archivos de Bronconeumologia 2004; Vol. 40, issue 1:20‐3. [PubMed]
Sabapathy 2004 {published data only}
- Sabapathy S, Kingsley RA, Schneider DA, Adams L, Morris NK. Continuous and intermittent exercise responses in individuals with chronic obstructive pulmonary disease. Thorax 2004; Vol. 59, issue 12:1026‐31. [DOI] [PMC free article] [PubMed]
Santiworakul 2009 {published data only}
- Santiworakul A, Jarungjitaree S, Jalayondeja W, Chantarothorn S, Supaibulpipat S. Effect of lower extremity exercise on muscle strength and physical capacity in COPD patients. Journal of the Medical Association of Thailand 2009; Vol. 92, issue 4:556‐63. [PubMed]
Serres 1997 {published data only}
Strijbos 1996 {published data only}
- Strijbos JH, Postma DS, Altena R, Gimeno F, Koeter GH. A comparison between an outpatient hospital‐based pulmonary rehabilitation program and home‐care pulmonary rehabilitation program in patients with COPD. A follow‐up of 18 months. Chest 1996;109:366‐72. [DOI] [PubMed] [Google Scholar]
Vallet 1997 {published data only}
Varga 2005 {published data only}
- Varga J, Boda K, Somfay A. The effect of controlled and uncontrolled dynamic lower extremity training in the rehabilitation of patients with chronic obstructive pulmonary disease. Orvosi Hetilap 2005; Vol. 146, issue 44:2249‐55. [PubMed]
Vogiatzis 2004 {published data only}
Wijkstra 1996 {published data only}
- Wijkstra PJ, Mark TW, Kraan J, Altena R, Koater GH, Postma DS. Effects of home rehabilitation on physical performance in patients with chronic obstructive pulmonary disease (COPD). European Respiratory Journal 1996;9:104‐10. [DOI] [PubMed] [Google Scholar]
Wurtemberger 2001 {published data only}
Zacarias 2000 {published data only}
- Zacarias EC, Neder JA, Cendom SP, Nery LE, Jardim JR. Heart rate at the estimated lactate threshold in patients with chronic obstructive pulmonary disease: effects on the target intensity for dynamic exercise training. Journal of Cardiopulmonary Rehabilitation 2000; Vol. 20, issue 6:369‐76. [DOI] [PubMed]
References to studies awaiting assessment
Moon 2009 {published data only}
- Moon JW, Lee SS, Park YB. The effect of exercise intensity of home‐based pulmonary rehabilitation (HB‐PR) for patients with COPD [Abstract]. Respirology 2009; Vol. 14, issue Suppl 3:A190 [PD 05–04].
Wen 2008 {published data only}
- Wen H, Gao Y, An JY. Comparison of high‐intensity and anaerobic threshold programs in rehabilitation for patients with moderate to severe chronic obstructive pulmonary disease [Chinese]. Chung‐Hua Chieh Ho Ho Hu Hsi Tsa Chih Chinese Journal of Tuberculosis & Respiratory Diseases 2008; Vol. 31, issue 8:571‐6. [PubMed]
Additional references
ACSM 1998
- American College of Sports Medicine. American College of Sports Medicine Position Stand: The recommended quantity and quality of exercise for developing and maintaining cardiorespiratory and muscular fitness, and flexibility in healthy adults. Medicine & Science in Sports & Exercise 1998;30(6):975‐91. [DOI] [PubMed] [Google Scholar]
ACSM 2006
- American College of Sports Medicine. Other clinical conditions influencing exercise prescription: Pulmonary diseases. ACSM's Guidelines for Exercise Testing and Prescription. 7th Edition. Baltimore, Maryland: Lippincott Williams & Wilkins, 2006:227‐9. [Google Scholar]
Beauchamp 2010
- Beauchamp MK, Nonoyama M, Goldstein RS, Hill K, Dolmage TE, Mathur S, et al. Interval versus continuous training in individuals with chronic obstructive pulmonary disease ‐ a systematic review. Thorax 2010;65:157‐64. [DOI] [PubMed] [Google Scholar]
Borg 1982
- Borg GA. Psychophysical bases of perceived exertion. Medicine and Science in Sports and Exercise 1982;14:377‐81. [PubMed] [Google Scholar]
Brown 2007
BTS 2001
- British Thoracic Society Standards of Care Subcommittee on Pulmonary Rehabilitation. Pulmonary rehabilitation. Thorax 2001; Vol. 56, issue 11:827‐34. [DOI] [PMC free article] [PubMed]
Butcher 2006
- Butcher SJ, Jones RL. The impact of exercise training intensity on change in physiological function in patients with chronic obstructive pulmonary disease. Sports Medicine 2006;36(4):307‐25. [DOI] [PubMed] [Google Scholar]
Casaburi 1992
- Casaburi R. Principles of exercise training. Chest 1992;101(5):263S‐7S. [PubMed] [Google Scholar]
Clini 2009
- Clini EM, Crisafulli E, Costi S, Rossi G, Lorenzi C, Fabbri LM, et al. Effects of early inpatient rehabilitation after acute exacerbation of COPD. Respiratory Medicine 2009;103(10):1526‐31. [DOI] [PubMed] [Google Scholar]
Cockram 2006
Cooper 2001
Dunst 2004
- Dunst C, Hamby D, Trivette C. Guidelines for calculating effect sizes for practice‐based research syntheses. Centrescope 2004;3(1):1‐10. [Google Scholar]
GOLD 2010
- GOLD. Global Initiative for Chronic Obstructive Lung Disease. Global strategy for the diagnosis, management, and prevention of chronic obstructive pulmonary disease (updated 2010). Available from www.goldcopd.org 2010.
Gorostiaga 1991
Gosselink 1997
GRADE Working Group 2004
- GRADE Working Group. Grading quality of evidence and strength of recommendations. BMJ 2004;328:1490‐4. [DOI] [PMC free article] [PubMed] [Google Scholar]
Higgins 2009
- Higgins JPT, Green S (editors). Cochrane Handbook for Systematic Reviews of Interventions Version 5.0.2. Chichester: John Wiley & Sons, 2009. [Google Scholar]
Jaeschke 1989
- Jaeschke R, Singer J, Guyatt GH. Measurement of health status: ascertaining the minimal clinically important difference. Controlled Clinical Trials 1989;10:407‐15. [DOI] [PubMed] [Google Scholar]
Jones 1992
Jones 2000
Jones 2006
Leung 2010
Maltais 1996a
Maltais 1996b
Man 2003
Man 2004
- Man WDC, Polkey MI, Donaldson N, Gray BJ, Moxham J. Community pulmonary rehabilitation after hospitalisation for acute exacerbations of chronic obstructive pulmonary disease: randomised controlled study. BMJ 2004;329(7476):1209‐13. [DOI] [PMC free article] [PubMed] [Google Scholar]
Morris 2003
- Morris N, Gass G, Thompson M, Conforti D. Physiological responses to intermittent and continuous exercise at the same relative intensity in older men. European Journal of Applied Physiology 2003;90:620‐5. [DOI] [PubMed] [Google Scholar]
Nici 2006
Orwin 1994
- Orwin RG. Evaluating coding decisions. In: Cooper H, Hedges LV editor(s). The Handbook of Research Synthesis. New York: Russell Sage Foundation, 1994. [Google Scholar]
Palange 2007
Pepin 2007
- Pepin V, Saey D, Laviolette L, Maltais F. Exercise capacity in chronic obstructive pulmonary disease: mechanism of limitation. COPD: Journal of Chronic Obstructive Pulmonary Disease 2007;4:195‐204. [DOI] [PubMed] [Google Scholar]
Puente‐Maestu 2009
- Puente‐Maestu L, Villar F, Miguel J, Stringer WW, Sanz P, Sanza ML, et al. Clinical relevance of constant power exercise duration changes in COPD. European Respiratory Journal 2009;34(2):340‐5. [DOI] [PubMed] [Google Scholar]
Puhan 2005
- Puhan MA, Schunemann HJ, Frey M, Scharplatz M, Bachmann LM. How should COPD patients exercise during respiratory rehabilitation? Comparison of exercise modalities and intensities to treat skeletal muscle dysfunction. Thorax 2005; Vol. 60, issue 5:367‐75. [DOI] [PMC free article] [PubMed]
Puhan 2008
RevMan 2011 [Computer program]
- The Nordic Cochrane Centre, The Cochrane Collaboration. Review Manager (RevMan). Version 5.1. Copenhagen: The Nordic Cochrane Centre, The Cochrane Collaboration, 2011.
Ries 1995
Ries 2005
- Ries AL. Minimally Clinically Important Difference for the UCSD Shortness of Breath Questionnaire, Borg Scale, and Visual Analog Scale. COPD: Journal of Chronic Obstructive Pulmonary Disease 2005;2(1):105‐10. [DOI] [PubMed] [Google Scholar]
Ries 2007
Roca 1997
- Roca J, Whipp BJ, Agusti AGN, Anderson SD, Casaburi R, Cotes JE, et al. Clinical exercise testing with reference to lung diseases: indications, standardization and interpretation strategies. ERS Task Force on Standardization of Clinical Exercise Testing. European Respiratory Society. European Respiratory Journal 1997; Vol. 10, issue 11:2662‐89. [DOI] [PubMed]
Singh 2008
Sutherland 2004
Swain 2002
Troosters 2000
Troosters 2005
Vogiatzis 1999
Wasserman 2004
- Wasserman K, Hansen JE, Sue DY, Casaburi R, Whipp BJ. Principles of Exercise Testing and Interpretation including Pathophysiology and Clinical Applications. 4th Edition. Maryland: Lippincott Williams and Wilkins, 2004. [Google Scholar]