

Abstract
Understanding the impacts and constraints of climate change on the geographical distribution of wild Akebia trifoliata is crucial for its sustainable management and economic development as a medicinal material or fruit. In this study, according to the first‐hand information obtained from field investigation, the distribution and response to climate change of A. trifoliata were studied by the MaxEnt model and ArcGIS. The genetic diversity and population structure of 21 natural populations of A. trifoliata were studied by simple sequence repeat (SSR) markers. The results showed that the most important bioclimatic variable limiting the distribution of A. trifoliata was the Mean Temperature of Coldest Quarter (bio11). Under the scenarios SSP1‐2.6 and SSP2‐4.5, the suitable area of A. trifoliata in the world will remain stable, and the suitable area will increase significantly under the scenarios of SSP3‐7.0 and SSP5‐8.5. Under the current climate scenario, the suitable growth regions of A. trifoliata in China were 79.9–122.7°E and 21.5–37.5°N. Under the four emission scenarios in the future, the geometric center of the suitable distribution regions of Akebia trifoliata in China will move to the north. The clustering results of 21 populations of A. trifoliata analyzed by SSR markers showed that they had a trend of evolution from south to north.
Keywords: ArcGIS, climate change, geographical distribution, MaxEnt, SSR markers, suitable distribution regions
Precipitation and temperature were the two most important climatic factors that restrict the geographic distribution of Akebia trifoliata. Under the current climate scenario, the suitable growth regions of A. trifoliata in China were 91.7–121.9°E and 21.6–37.5°N. Combined with the evolutionary relationship and prediction results, 21 populations of A. trifoliata tended to migrate to the north. The distribution center of A. trifoliata in China will shift to high latitude regions with the increase of temperature in the future.

1. INTRODUCTION
Akebia trifoliata fruit, a popular edible berry in Asia, is widely consumed as daily fruits or functional foods. The fruit of A. trifoliata is sweet and rich in vitamin C (108–930 mg/100 g), which is beneficial to health and has great value in the third generation of the new fruit industry (Zou et al., 2018, 2019). A. trifoliata has a long medicinal history in China for more than 2000 years. Its roots, stems, seeds, and fruits, as raw materials of traditional Chinese medicine, have high research value in the field of medicine. In recent years, the demand for A. trifoliata, especially as traditional Chinese medicine and fruit, has increased rapidly, resulting in the overexploitation of A. trifoliata, the destruction of its wild resources and the loss of its many excellent traits genes. Therefore, the protection and supervision of A. trifoliata are imminent, which require us to make clear the geographical distribution of A. trifoliata. Previous studies on A. trifoliata mainly focused on pharmacological activities (Lu et al., 2019; Wang et al., 2020; Xue et al., 2008) and chemical components (Gao & Wang, 2006; Guan et al., 2008; Iwanaga et al., 2012; Wang et al., 2015), but there is a gap in understanding the natural distribution of A. trifoliata and its response to climate change.
Due to the progress of human society and global climate change, the ecological environment has been deeply affected. Climate, to a certain extent, determines the spatiotemporal distribution of species, and the change of species’ geographic distribution also reflects the change of climate (Allen & Lendemer, 2016; Descombes et al., 2015). Climate change has a considerable impact on species’ geographic distribution, phenology, and other ecological symptom and progresses, which will lead to the accelerated prosperity or disappearance of species (Acevedo et al., 2020; Lenoir et al., 2008). Understanding how wild species respond to climate change is important for durative protection and supervision of wild species (Yi et al., 2016). Therefore, analyzing the response relationship between climatic variables and species (including Akebia trifoliata) is a key step to study the potential geographical distribution change of species, and a necessary way to study the impact of climate change on species survival.
Niche model can be used to predict the potential geographic distribution regions of species and habitat suitability evaluation, which can provide information for ecological research. It is an excellent choice to use the maximum entropy (MaxEnt) model to forecast the potential geographical distribution of species according to the existing species distribution information and various environmental data (Elith & Graham, 2009; Phillips, Anderson, et al., 2006; Phillips & Dudík, 2008. MaxEnt, based on the maximum entropy theory, has good accuracy even when the information on species distribution is insufficient (Saatchi et al., 2008; Yi et al., 2017). The model takes the climatic variables of the existing distribution points of species as the constraint conditions, supposing that the species will appear in all regions with suitable climatic conditions, but not in any regions not suitable for climatic conditions; the greater the entropy of species, the closer the probability distribution of species is to reality (Phillips, Anderson, et al., 2006). At present, MaxEnt has been used to forecast species distribution, and has been applied by many researchers to study the response relationship between species and climatic variables (Abdelaal et al., 2019; Li, Fan, et al., 2020; Yang et al., 2013; Zhang et al., 2019).
In this study, the MaxEnt model was used to predict the suitable distribution of A. trifoliata under different climate scenarios. The objectives of this study include: (1) to find and evaluate the key climatic variables affecting the distribution of A. trifoliata; (2) according to the current distribution data, to predict the suitable distribution regions for the growth of A. trifoliata; (3) to analyze the change trend of suitable distribution regions of A. trifoliata in different scenarios in the future (Focus on the distribution data concentration region, and the data records mainly occur in China.); (4) according to the prediction results and simple sequence repeat (SSR) markers (The genetic diversity and population structure of 21 Akebia trifoliata population were analyzed to determine its evolutionary relationship.), to analyze the migration trend of A. trifoliata in China.
2. MATERIALS AND METHODS
2.1. Species occurrence record
The occurrence record (Figure 1) of A. trifoliata was obtained from the field survey in 2017–2019 (including 566 points) and downloaded (including 132 points) from the Global Biodiversity Information Facility (GBIF, https://www.gbif.org). The survey covered Northern China, Central China, and Southern China. For the point information from GBIF, we deleted the data lacking longitude and latitude information and fuzzy geographic location information and deleted the wrong or repeated data that cannot be used. Geographical data was gathered from habitats of wild A. trifoliata by using GPS device (GARMIN GPSMAP 63SC, Kansas City, KS, USA). The actual distribution of A. trifoliata was analyzed by ArcGIS (version 10.2, ESRI, Redlands, CA, USA) software. The geographic distribution map of richness ×1° was drawn by using a geographic information system (GIS).
FIGURE 1.

Occurrence record of Akebia trifoliata in China
2.2. Climatic variables
In this study, the climate scenarios used include current climate scenarios (1970–2000), past climate scenarios (the Last Interglacial, the Last Glacial Maximum, and the Mid‐Holocene) (www.worldclim.org/data/v1.4/paleo1.4.html), and future climate scenarios (SSP1‐2.6, SSP2‐4.5, SSP3‐7.0, and SSP5‐8.5) (www.worldclim.org/data/cmip6/cmip6climate.html) (www.carbonbrief.org/cmip6‐the‐next‐generation‐of‐climate‐models‐explained). All climate scenarios contain 19 bioclimatic variables (bio1‐19, the variable value is the average value of the time scale used in the climate scenario) (Table 1), and all climate scenarios were from WorldClim (www.worldclim.org) (Fick & Hijmans, 2017). According to CO2 emissions, the four scenarios in the future can be classified as low emission scenario (SSP1‐2.6), medium emission scenario (SSP2‐4.5), medium‐high emission scenario (SSP3‐7.0), and high emission scenario (SSP5‐8.5). The spatial resolution of all climate data is 2.5 minutes.
TABLE 1.
List of climate variables
| Variables | Abbreviation | Units |
|---|---|---|
| Annual Mean Temperature | Bio1 | ℃ |
| Mean Diurnal Range (Mean of monthly (max temp–min temp)) | Bio2 | ℃ |
| Isothermality (BIO2/BIO7) (×100) | Bio3 | – |
| Temperature Seasonality (standard deviation × 100) | Bio4 | ℃ |
| Max Temperature of Warmest Month | Bio5 | ℃ |
| Min Temperature of Coldest Month | Bio6 | ℃ |
| Temperature Annual Range (BIO5‐BIO6) | Bio7 | ℃ |
| Mean Temperature of Wettest Quarter | Bio8 | ℃ |
| Mean Temperature of Driest Quarter | Bio9 | ℃ |
| Mean Temperature of Warmest Quarter | Bio10 | ℃ |
| Mean Temperature of Coldest Quarter | Bio11 | ℃ |
| Annual Precipitation | Bio12 | mm |
| Precipitation of Wettest Month | Bio13 | mm |
| Precipitation of Driest Month | Bio14 | mm |
| Precipitation Seasonality (Coefficient of Variation) | Bio15 | – |
| Precipitation of Wettest Quarter | Bio16 | mm |
| Precipitation of Driest Quarter | Bio17 | mm |
| Precipitation of Warmest Quarter | Bio18 | mm |
| Precipitation of Coldest Quarter | Bio19 | mm |
The time span of each climate scenario in the future is 80 years from 2021 to 2100, which is divided into four time scales: 2021–2040, 2041–2060, 2061–2080, and 2081–2100 (In order to facilitate recording, the time scale of the whole 20 years is marked with the starting year. For example, 2021–2040 is only marked as 2021.). The values of 19 climatic variables are the average values of every 20 years.
2.3. Prediction of Akebia trifoliata suitable distribution by MaxEnt
In this study, MaxEnt (MaxEnt 3.4.1) was used to predict the potential suitable distribution regions of A. trifoliata (Phillips, DudíK, et al., 2006). 75% distribution points were randomly selected as training set and 25% as test set. Maximum iterations were set to 5000 to allow the model to have adequate time for convergence. If the model doesn't have enough time to converge (in the form of number of iterations), the model may overpredict or underpredict the relationships. The model was run 10 times to calculate the average value. Other parameters were software default values. The response curve of climatic variables was generated to reflect the relationship between the values of climatic variables and the occurrence probability of species. In addition, the results of the model also include the receiver operator characteristic (ROC) curves, Jackknife test, climatic variable contribution rate statistical table, and so on.
ROC curve analysis is used to verify the accuracy of the MaxEnt model (Wang et al., 2021). In this method, the area under curve, namely AUC value (the value range is 0–1), is used to judge the prediction accuracy of the model. When the AUC value is >0.9, the accuracy of the prediction results is high (Phillips, Anderson, et al., 2006).
In order to avoid the overfitting of the model caused by the collinearity among variables and improve the operation efficiency, the climatic variables were screened after running the full variable prediction (Li, Fan, et al., 2020, 2020; Sillero & Barbosa, 2020). Using the remaining climatic variables after screening, recompile the MaxEnt model, and the calculation efficiency and prediction accuracy of the model will be improved. The screening process was as follows:
Calculate the correlation between climatic variables with the Pearson correlation coefficient in SPSS (Statistical Product and Service Solutions, version 26.0, Armonk, NY, USA) software (Table S1).
Delete variables (percent contribution is <1%) whose contribution percentage is less than the contribution threshold setting at the first full variable prediction (Table S2). Among the remaining variables with high correlation (the correlation coefficient is >0.8 or <−0.8), the variable with the highest contribution rate is retained as the variable used to recompile the model.
2.4. Suitability division of distribution regions of Akebia trifoliata
The ASCII file exported by MaxEnt was converted into raster layer by using To Raster tool in ArcGIS, and the raster layer that contains the suitable distribution region of A. trifoliata was obtained. The fitness value (species existence probability) predicted by the model is continuous raster data, and the range of value is 0–1. The map layer that contains the suitable distribution region was divided into four grades by using the tool of Reclassify of ArcGIS and artificial grading method: no suitability (0 ≤ probability of existence < .15), low suitability (.15 ≤ probability of existence <.33), medium suitability (.33 ≤ probability of existence <.66), and high suitability (probability of existence >.66).
2.5. Obtaining the geometric centers of distribution regions
Because the boundary of the suitable distribution regions was irregular, it is difficult to describe the migration of the suitable distribution regions through the change of the boundary. The method of this study was to use the change of geometric centers of suitable distribution regions to describe migration.
Analysis of the geometric centers of the distribution regions of A. trifoliata involved three tools in ArcGIS: Raster Calculator, Raster Domain, and Mean Center. First, Raster Calculator was used to cut the raster layer that contains the suitable distribution regions of A. trifoliata, and the raster layer of suitable distribution regions were left. Then, Raster Domain was used to convert the raster layer of suitable distribution regions to plane geometry graphics. Finally, Mean Center was used to find the geometric centers of the plane geometry graphics.
2.6. Genetic diversity and population structure of Akebia trifoliata
To further reveal the migration status of A. trifoliata community in China, the genetic diversity and population structure of 21 A. trifoliata natural populations were studied by using SSR markers (detailed information about SSR primers used in this experiment was shown in Table S3). We used 8 pairs of primers to detect 194 alleles in 578 individuals of 21 natural populations. The distance between individuals should be at least 50 meters to avoid collecting asexually reproduced individuals.
3. RESULTS
3.1. Performance analysis of the model
The average AUC of the prediction results of this model was 0.935 (Figure 2a), which indicates that accuracy of prediction results was high.
FIGURE 2.
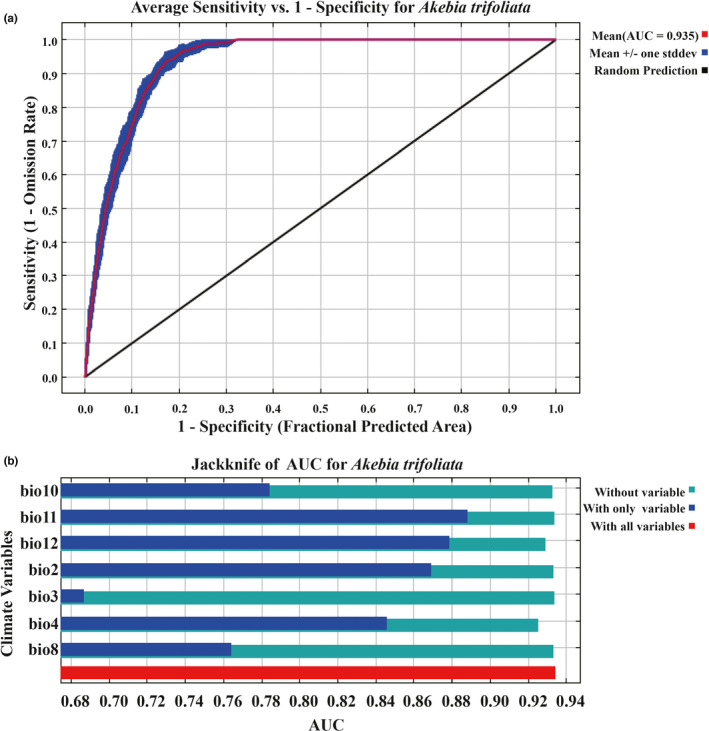
ROC curve, Jackknife test of MaxEnt. (a) ROC curve of the Maxent model (10 runs). (b) Jackknife test of the Maxent model
3.2. Climatic variables analysis
According to the screening mechanism of the method part in this paper, combined with the contribution rate of 19 climatic variables (bio1‐19) in MaxEnt model and the correlation test of them, the remaining 7 climatic variables (bio2, bio3, bio4, bio8, bio10, bio11 and bio12) were used to run MaxEnt model again.
Jackknife test (using AUC on test data) was used to analyze the impact of climatic variables on the prediction results to determine the importance of each climatic factor (Figure 2b). When a climatic variable was used alone, the four variables with greater gain were bio2, bio4, bio11, and bio12. Bio11 has the highest gain value. This shows that the above four climatic variables were the main influencing factors for predicting the suitable distribution regions of A. trifoliata. The response curves of four important climatic variables and the existence probability of A. trifoliata were shown in Figure 3.
FIGURE 3.

Response curves between the probability of presence and climate variables (10 runs). Blue: mean ±one standard deviation. (a) the Mean Diurnal Range (bio2). (b) the Temperature Seasonality (bio4). (c) the Mean Temperature of Coldest Quarter (bio11). (d) the Annual Precipitation (bio12)
Bio2, bio4, and bio11 are temperature‐related climatic variables. When bio 2 is less than 14℃, the existence probability of A. trifoliata is >0, and with the continuous decrease of bio 2, the existence probability shows an overall upward trend, which indicates that stable temperature conditions are more conducive to the survival of A. trifoliata. When bio4 is equal to 655℃, the existence probability of A. trifoliata can reach a peak. If bio4 continues to decrease, the existence probability decreases rapidly and then increases slowly. When bio4 is less than 286℃, the existence probability will remain above .5. However, when bio4 increases on the basis of 655℃, the probability of existence will eventually become 0. When bio11 is <−10℃, the existence probability of A. trifoliata is close to 0. When bio11 is >−0℃, the existence probability begins to increase and reaches the peak at 10℃. From this point, the existence probability decreases rapidly with the continuous increase of bio11. Bio12 is a precipitation related variable. When bio12 is <400 mm, the existence probability of A. trifoliata is close to 0. Then, with the continuous increase of bio12, the existence probability also increases. When bio12 reaches 4500 mm, the existence probability can reach more than 0.9.
3.3. Geographical distribution prediction of Akebia trifoliata
3.3.1. Current suitable distribution regions
Figure 4a shows the suitable distribution regions of A. trifoliata in the world, and Figure 4b shows the suitable distribution regions of A. trifoliata in China. All the prediction results were predicted according to the distribution data of A. trifoliata in China.
FIGURE 4.

Current suitable distribution regions of Akebia trifoliata. (a) Distribution of Akebia trifoliata in the world. (b) Distribution of Akebia trifoliata in China
In the world model, the total suitable area of A. trifoliata is 1690.88 × 104 km2, and the suitable distribution regions is mainly distributed in the temperate zone and less in tropical zone. In China, the suitable growth regions of A. trifoliata are 79.9–122.7°E and 21.6–37.6°N (the suitable distribution regions are basically consistent with Figure 1), and the total suitable area is 192.01 × 10⁴ km2. The detailed values of suitable area in the world were shown in Tables S4, and S5 shows the detailed values of suitable area in China.
3.3.2. Suitable distribution regions of Akebia trifoliata in the past
Figure S1 shows the suitable distribution regions of A. trifoliata in the past. In the Last Interglacial scenario (Figure S1a), the total suitable area of A. trifoliata was 661.15 × 10⁴ km2. In the Last Glacial Maximum scenario (Figure S1b), the total suitable area was 910.81 × 10⁴ km2. The total suitable area in these two scenarios was much smaller than that in the current scenario. In the Mid‐Holocene scenario (Figure S1c), the total suitable area was 1596.03 × 104 km2, slightly different from the total suitable area under the current scenario. However, in the Mid‐Holocene scenario, the suitable distribution regions were mainly concentrated in the tropics. The detailed values of suitable area in the past were shown in Table S6.
3.3.3. Suitable distribution regions of Akebia trifoliata in the future
The prediction of suitable distribution regions of A. trifoliata under four emission scenarios (SSP1‐2.6, SSP2‐4.5, SSP3‐7.0 and SSP5‐8.5) was shown in Figures 5 and [Link], [Link], [Link]. The detailed values of suitable area in the world were shown in Tables S4 and S5 shows the detailed values of suitable area in China.
FIGURE 5.

The suitable distribution regions of Akebia trifoliata in scenario SSP5‐8.5. (a) The suitable distribution regions in 2021. (b) The suitable distribution regions in 2041. (c) The suitable distribution regions in 2061. (d) The suitable distribution regions in 2081
According to the broken line diagram of the suitable area of A. trifoliata in the world (Figure 6a), it is found that the suitable area of this species fluctuates slightly in emission scenarios SSP1‐2.6 and SSP2‐4.5. In scenario SSP3‐7.0, the suitable area increases significantly after 2041. In scenario SSP5‐8.5, the change of suitable area is the most obvious, and the suitable area increases greatly in 2041 and 2061 and begins to decrease after 2061.
FIGURE 6.

The broken line diagram of the suitable area of Akebia trifoliata. (a) The total suitable area of Akebia trifoliata in the world. (b) The total suitable area of Akebia trifoliata in China
In China, the suitable area of A. trifoliata remains stable in scenario SSP1‐2.6 (Figure 6b), and only increases slightly in the interval between 2061 and 2081. In the other three scenarios, the change of suitable area is larger. Overall, the range of change of suitable area increases with the upgrading of emission scenarios.
3.4. Geometric centers of suitable distribution regions of Akebia trifoliata
Figure 7 shows the distribution of geometric centers of suitable distribution regions of Akebia trifoliata in China under five scenarios (including geometric centers under the current scenario and four future scenarios). Enlarge Figure 7a to get 7b. In scenario SSP1‐2.6 (Figure 7c), the geometric centers in 2021, 2041, and 2061 were in the northwest of the original geometric center (current scenario), and the migration distance is small. In 2081, the geometric center moved to the northeast of the original geometric center, with a large migration distance. The fluctuation range is 28.51–29.13°N, and the fluctuation value is 0.62° (fluctuation upper limit minus lower limit).
FIGURE 7.

Geometric centers of suitable distribution regions of Akebia trifoliata in China. (a–b) Geometric centers under current scenario and four future scenarios (enlarge a to get b). (c–f) Geometric centers in SSP1‐2.6, SSP2‐4.5, SSP3‐7.0 and SSP5‐8.5 scenarios
In scenario SSP2‐4.5, the fluctuation range of geometric centers were 28.51–29.49°N (Figure 7d), and the fluctuation value was 0.98°. In scenario SSP3‐7.0, the fluctuation range of the geometric centers were 28.37–29.37°N (Figure 7e), and the fluctuation value was 1.00°. In scenario SSP5‐8.5, the fluctuation range of the geometric centers were 28.51–29.60°N (Figure 7f), and the fluctuation value was 1.09°.
With the upgrading of emission scenarios, the fluctuation value of geometric center is also increasing, which indicates that the change of suitable distribution regions of A. trifoliata in high emission scenario is more active than that in low emission scenario. In addition, in scenario SSP3‐7.0 in 2021, the geometric center moves to the south of the original geometric center, but all the other geometric centers are in the north of the original geometric center. Overall, the suitable distribution regions of A. trifoliata in China may migrate to the north in the future.
3.5. Clustering results of 21 natural populations of Akebia trifoliata
The clustering results of 21 A. trifoliata populations by neighbor‐joining method revealed the evolutionary relationship of these 21 populations, as shown in Figure 8a. The geographic location information of these 21 populations was shown in Figure 8b. These 21 populations can be divided into three parts: A (I and II), B (III–XV), and C (XVI–XXI). In these three parts, the genetic relationship of A is closer to the ancestor, B is farther from the ancestor, and C is farthest from the ancestor. The genetic relationship among these three parts and ancestor may be the result of ancestral population migration. The migration direction was shown by the purple arrow in Figure 8b (from Southeast China to Southwest China and Central China, and then to Northern China).
FIGURE 8.

Clustering results and evolutionary relationship of 21 Akebia trifoliata populations. (a) Clustering results by Neighbor‐joining Method of 21 Akebia trifoliata populations. (b) Distribution of 21 Akebia trifoliata populations
4. DISCUSSION
4.1. Main climatic variables affecting the distribution of Akebia trifoliata
Temperature and precipitation are two key factors limiting plant growth. When the climate factors related to temperature and precipitation change too much and exceed the current threshold of plant growth, it will lead to the migration of its population (Camille & Gary, 2003). Water is particularly important for plants. It not only has a significant impact on the photosynthesis of plants, but also determines the growth status of plants. Therefore, precipitation is an important factor limiting the distribution of plants (Zhang et al., 2018). The longer growing season is helpful for the plant population to migrate to more suitable regions, and the increase of precipitation in the driest month can prolong the growth season (Vaganov et al., 1999). Extreme low and high temperatures also limit the growth of plants. Plants will suffer from freezing damage if they are exposed to low temperature for a long time, and the decrease of the lowest temperature in the coldest month will undoubtedly aggravate the damage (Harsch & HilleRisLambers, 2016). However, high temperature will destroy the water balance in plants, leading to protein condensation and accumulation of harmful metabolites (Lemmens et al., 2006). If the highest temperature in the warmest month increases, the growth of plants will be hindered to a certain extent.
In this study, the 19 variables used to predict the distribution of species belong to the category of temperature and precipitation factors. The results of Jackknife test showed that bio2, bio4, bio11, and bio12 were the four key variables limiting the distribution of A. trifoliata. Among them, the most critical variable is bio11, which belongs to the variable related to temperature factor. The research on A. quinata shows that the key variable limiting its distribution is bio12 (Zhang et al., 2021), which is related to precipitation factors. This indicates that the priority of temperature conditions on the restriction of A. trifoliata may be higher than that of precipitation conditions, and the priority of precipitation condition to the limitation of A. quinata may be higher than that of temperature condition.
4.2. Change trend of suitable distribution regions of Akebia trifoliata
Species respond differently to climate change. In the future, the suitable area of A. trifoliata in the world will tend to be stable under low emission scenarios (SSP1‐2.6) and medium emission scenarios (SSP2‐4.5). In the medium‐high emission scenarios (SSP3‐7.0) and high emission scenarios (SSP5‐8.5), the suitable area has increased significantly. In the study of two species of peony (Zhang et al., 2018), the suitable area of Paeonia rockii was increased in both of emission scenario (RCP2.6) and emission scenario (RCP8.5) (for a detailed description of the climate scenario, see www.carbonbrief.org/cmip6‐the‐next‐generation‐of‐climate‐models‐explained). The research on Tricholoma matsutake shows that in the scenario RCP8.5, its suitable area will be greatly reduced, and the distribution regions will even be fragmented (Guo et al., 2017). Under the four different emission scenarios in the future, the geometric center of the suitable distribution regions of A. quinata in East Asia continues to move to the northeast with the upgrading of the emission scenario, which is caused by the continuous reduction of the suitable area in China (Zhang et al., 2021). Due to climate change, the suitable distribution area of species will also change (Hampe & Petit, 2005; Ramírez‐Preciado et al., 2019; Thuiller et al., 2008). The expansion or contraction of species distribution region, species migration, and even the fragmentation of distribution region is the reason for the change of geometric center of species distribution area (Li, Li, et al., 2020, 2020; Zhang et al., 2021). In the future scenario, the geometric centers of the suitable distribution regions of A. trifoliata move north, which may be because it has the trend of northward expansion.
4.3. Analysis on evolutionary relationship of Akebia trifoliata population
The genetic diversity of plant populations is closely related to the climatic factors of their habitats (Eckert et al., 2010; Howe et al., 2003; Nybom, 2004; Turpeinen et al., 2001; Wróblewska, 2014). The process of species migration and adaptation to new habitats must be accompanied by changes in climate factors, which will promote the genetic variation of species. The evolutionary relationship of 21 A. trifoliata populations in China may be related to the change of habitat during the migration of this species.
5. CONCLUSIONS
Predicting how climate change will affect the distribution of A. trifoliata is of great significance for its conservation. The Mean Diurnal Range (bio2), the Temperature Seasonality (bio4), the Mean Temperature of Coldest Quarter (bio11), and the Annual Precipitation (bio12) are the main climatic variables that affect the distribution of A. trifoliata. In the future, the suitable area of A. trifoliata in the world will remain stable in low emission scenario (SSP1‐2.6) and medium emission scenario (SSP2‐4.5) and increase significantly in medium‐high and high emission scenarios (SSP3‐7.0 and SSP5‐8.5). The geometric center of the distribution area of A. trifoliata in China will move to the north. There was a migration trend of A. trifoliata in China from south to north.
CONFLICT OF INTEREST
The authors report no conflict of interest.
AUTHOR CONTRIBUTIONS
Jun‐Ming Zhang: Writing – original draft (equal). Xiang‐Yong Peng: Data curation (equal); Investigation (equal). Min‐Li Song: Writing – review & editing (equal). Zhen‐Jian Li: Investigation (equal); Writing – review & editing (equal). Xin‐Qiao Xu: Project administration (equal); Writing – review & editing (equal). Wei Wang: Data curation (equal); Investigation (equal); Project administration (equal); Writing – original draft (equal).
Supporting information
Fig S1
Fig S2
Fig S3
Fig S4
Supplementary Material
Table S1
Table S2
Table S3
Table S4
Table S5
Table S6
ACKNOWLEDGMENTS
The authors gratefully acknowledge financial support from the Central Non‐profit Research Institution of CAF (CAFYBB2017ZA004‐7), the National Natural Science Foundation of China (41501059), and the Central Public‐interest Scientific Institution Basal Research Funds (ZDRIF201711).
Zhang, J.‐M. , Peng, X.‐Y. , Song, M.‐L. , Li, Z.‐J. , Xu, X.‐Q. , & Wang, W. (2022). Effects of climate change on the distribution of wild Akebia trifoliata . Ecology and Evolution, 12, e8714. 10.1002/ece3.8714
DATA AVAILABILITY STATEMENT
The original contributions presented in the study are included in the article/[Link], [Link], [Link], [Link], [Link], [Link], [Link], [Link], [Link], [Link], [Link]; further inquiries can be directed to the corresponding author/s.
REFERENCES
- Abdelaal, M. , Fois, M. , Fenu, G. , & Bacchetta, G. (2019). Using MaxEnt modeling to predict the potential distribution of the endemic plant Rosa arabica Crép. Egypt. Ecological Informatics, 50(1), 68–75. 10.1016/j.ecoinf.2019.01.003 [DOI] [Google Scholar]
- Acevedo, M. A. , Beaudrot, L. , Meléndez‐Ackerman, E. J. , & Tremblay, R. L. (2020). Local extinction risk under climate change in a neotropical asymmetrically dispersed epiphyte. Journal of Ecology, 108(4), 1553–1564. 10.1111/1365-2745.13361 [DOI] [Google Scholar]
- Allen, J. L. , & Lendemer, J. C. (2016). Climate change impacts on endemic, high‐elevation lichensin a biodiversity hots. Biodiversity and Conservation, 25(3), 555–568. 10.1007/s10531-016-1071-4 [DOI] [Google Scholar]
- Camille, P. , & Gary, Y. (2003). A globally coherent fingerprint of climate change impacts across natural systems. Nature, 421(6918), 37–42. 10.1038/nature01286 [DOI] [PubMed] [Google Scholar]
- Descombes, P. , Wisz, M. S. , Leprieur, F. , Parravicini, V. , Heine, C. , Olsen, S. M. , Swingedouw, D. , Kulbicki, M. , Mouillot, D. , & Pellissier, L. (2015). Forecasted coral reef decline in marine biodiversity hotspots under climate change. Global Change Biology, 21(7), 2479–2487. 10.1111/gcb.12868 [DOI] [PubMed] [Google Scholar]
- Eckert, A. J. , van Heerwaarden, J. , Wegrzyn, J. L. , Nelson, C. D. , Ross‐Ibarra, J. , González‐Martínez, S. C. , & Neale, D. B. (2010). Patterns of population structure and environmental associations to aridity across the range of loblolly pine (Pinus taeda L., Pinaceae). Genetics, 185(3), 969–982. [DOI] [PMC free article] [PubMed] [Google Scholar]
- Elith, J. , & Graham, C. H. (2009). Do they? How do they? WHY do they differ? On finding reasons for differing performances of species distribution models. Ecography, 32(1), 66–77. 10.1111/j.1600-0587.2008.05505.x [DOI] [Google Scholar]
- Fick, S. E. , & Hijmans, R. J. (2017). WorldClim 2: New 1‐km spatial resolution climate surfaces for global land areas. International Journal of Climatology, 37(12), 4302–4315. 10.1002/joc.5086 [DOI] [Google Scholar]
- Gao, H. , & Wang, Z. (2006). Triterpenoid saponins and phenylethanoid glycosides from stem of Akebia trifoliata var. australis . Phytochemistry, 67(24), 2697–2705. 10.1016/j.phytochem.2006.09.003 [DOI] [PubMed] [Google Scholar]
- Guan, S. , Xia, J. , Lu, Z. , Chen, G. , Jiang, B. , Liu, X. , & Guo, D. (2008). Structure elucidation and NMR spectral assignments of three new lignan glycosides from Akebia trifoliata . Magnetic Resonance in Chemistry, 46(2), 186–190. 10.1002/mrc.2152 [DOI] [PubMed] [Google Scholar]
- Guo, Y. , Li, X. , Zhao, Z. , Wei, H. , Gao, B. , & Gu, W. (2017). Prediction of the potential geographic distribution of the ectomycorrhizal mushroom Tricholoma matsutake under multiple climate change scenarios. Scientific Reports, 7, 46221. 10.1038/srep46221 [DOI] [PMC free article] [PubMed] [Google Scholar]
- Hampe, A. , & Petit, R. J. (2005). Conserving biodiversity under climate change: The rear edge matters. Ecology Letters, 8(5), 461–467. 10.1111/j.1461-0248.2005.00739.x [DOI] [PubMed] [Google Scholar]
- Harsch, M. A. , & HilleRisLambers, J. (2016). Climate warming and seasonal precipitation change interact to limit species distribution shifts across Western North America. PLoS One, 11(7), e0159184. 10.1371/journal.pone.0159184 [DOI] [PMC free article] [PubMed] [Google Scholar]
- Howe, G. T. , Aitken, S. N. , Neale, D. B. , Jermstad, K. D. , Wheeler, N. C. , & Chen, T. H. (2003). From genotype to phenotype: Unraveling the complexities of cold adaptation in forest trees. Canadian Journal of Botany, 81(12), 1247–1266. 10.1139/b03-141 [DOI] [Google Scholar]
- Iwanaga, S. , Warashina, T. , & Miyase, T. (2012). Triterpene Saponins from the Pericarps of Akebia trifoliata . Chemical and Pharmaceutical Bulletin, 60(10), 1264–1274. 10.1248/cpb.c12-00448 [DOI] [PubMed] [Google Scholar]
- Lemmens, C. , Boeck, H. J. D. , Gielen, B. , Bossuyt, H. , Malchair, S. , Carnol, M. , Merckx, R. , Nijs, I. , & Ceulemans, R. (2006). End‐of‐season effects of elevated temperature on ecophysiological processes of grassland species at different species richness levels. Environmental and Experimental Botany, 56(3), 245–254. 10.1016/j.envexpbot.2005.02.009 [DOI] [Google Scholar]
- Lenoir, J. , Gegout, J. C. , Marquet, P. A. , De Ruffray, P. , & Brisse, H. (2008). A significant upward shift in plant species optimum elevation during the 20th century. Science, 320(5884), 1768–1771. 10.1126/science.1156831 [DOI] [PubMed] [Google Scholar]
- Li, J. , Fan, G. , & He, Y. (2020). Predicting the current and future distribution of three Coptis herbs in China under climate change conditions, using the MaxEnt model and chemical analysis. Science of the Total Environment, 698, 134141. 10.1016/j.scitotenv.2019.134141 [DOI] [PubMed] [Google Scholar]
- Li, Y. , Li, M. , Li, C. , & Liu, Z. (2020). Optimized maxent model predictions of climate change impacts on the suitable distribution of Cunninghamia lanceolata in China. Forests, 11(3), 302. 10.3390/f11030302 [DOI] [Google Scholar]
- Lu, W.‐L. , Yang, T. , Song, Q.‐J. , Fang, Z.‐Q. , Pan, Z.‐Q. , Liang, C. , Jia, D.‐W. , & Peng, P.‐K. (2019). Akebia trifoliata (Thunb.) Koidz Seed Extract inhibits human hepatocellular carcinoma cell migration and invasion in vitro. Journal of Ethnopharmacology, 234, 204–215. 10.1016/j.jep.2018.11.044 [DOI] [PubMed] [Google Scholar]
- Nybom, H. (2004). Comparison of different nuclear DNA markers for estimating intraspecific genetic diversity in plants. Molecular Ecology, 13(5), 1143–1155. 10.1111/j.1365-294X.2004.02141.x [DOI] [PubMed] [Google Scholar]
- Phillips, S. J. , Anderson, R. P. , & Schapire, R. E. (2006). Maximum entropy modeling of species geographic distributions. Ecological Modelling, 190(3–4), 231–259. 10.1016/j.ecolmodel.2005.03.026 [DOI] [Google Scholar]
- Phillips, S. J. , & Dudík, M. (2008). Modeling of species distributions with Maxent: New extensions and a comprehensive evaluation. Ecography, 31(2), 161–175. 10.1111/j.2007.0906-7590.05203.x [DOI] [Google Scholar]
- Phillips, S. J. , DudíK, M. , & Schapire, R. E. (2006). Maxent software for modeling species niches and distributions (Version 3.4.1). http://biodiversityinformatics.amnh.org/open_source/maxent/ [Google Scholar]
- Ramírez‐Preciado, R. P. , Gasca‐Pineda, J. , & Arteaga, M. C. (2019). Effects of global warming on the potential distribution ranges of six Quercus species (Fagaceae). Flora, 251, 32–38. 10.1016/j.flora.2018.12.006 [DOI] [Google Scholar]
- Saatchi, S. , Buermann, W. , ter Steege, H. , Mori, S. , & Smith, T. B. (2008). Modeling distribution of Amazonian tree species and diversity using remote sensing measurements. Remote Sensing of Environment, 112(5), 2000–2017. 10.1016/j.rse.2008.01.008 [DOI] [Google Scholar]
- Sillero, N. , & Barbosa, A. M. (2020). Common mistakes in ecological niche models. International Journal of Geographical Information Science, 35(2), 213–226. 10.1080/13658816.2020.1798968 [DOI] [Google Scholar]
- Thuiller, W. , Albert, C. , Araújo, M. B. , Berry, P. M. , Cabeza, M. , Guisan, A. , Hickler, T. , Midgley, G. F. , Paterson, J. , Schurr, F. M. , Sykes, M. T. , & Zimmermann, N. E. (2008). Predicting global change impacts on plant species’ distributions: Future challenges. Perspectives in Plant Ecology, Evolution and Systematics, 9(3–4), 137–152. 10.1016/j.ppees.2007.09.004 [DOI] [Google Scholar]
- Turpeinen, T. , Tenhola, T. , Manninen, O. , Nevo, E. , & Nissilä, E. (2001). Microsatellite diversity associated with ecological factors in Hordeum spontaneum populations in Israel. Molecular Ecology, 10(6), 1577–1591. 10.1046/j.1365-294X.2001.01281.x [DOI] [PubMed] [Google Scholar]
- Vaganov, E. A. , Hughes, M. K. , Kirdyanov, A. V. , Schweingruber, F. H. , & Silkin, P. P. (1999). Influence of snowfall and melt timing on tree growth in subarctic Eurasia. Nature, 400(6740), 149–151. 10.1038/22087 [DOI] [Google Scholar]
- Wang, J. , Ren, H. , Xu, Q.‐L. , Zhou, Z.‐Y. , Wu, P. , Wei, X.‐Y. , Cao, Y. , Chen, X.‐X. , & Tan, J.‐W. (2015). Antibacterial oleanane‐type triterpenoids from pericarps of Akebia trifoliata . Food Chemistry, 168, 623–629. 10.1016/j.foodchem.2014.07.105 [DOI] [PubMed] [Google Scholar]
- Wang, W. , Li, Z. J. , Zhang, Y. L. , & Xu, X. Q. (2021). Current situation, global potential distribution and evolution of six almond species in China. Frontiers in Plant Science, 12, 619883. 10.3389/fpls.2021.619883 [DOI] [PMC free article] [PubMed] [Google Scholar]
- Wang, X. , Yu, N. , Wang, Z. , Qiu, T. , Jiang, L. , Zhu, X. , & Xiong, H. (2020). Akebia trifoliata pericarp extract ameliorate inflammation through NF‐κB /MAPKs signaling pathways and modify gut microbiota. Food & Function, 11(5), 4682–4696. 10.1039/c9fo02917f [DOI] [PubMed] [Google Scholar]
- Wróblewska, A. (2014). Genetic diversity and spatial genetic structure of Chamaedaphne calyculata (Ericaceae) at the western periphery in relation to its main continuous range in Eurasia. Folia Geobotanica, 49(2), 193–208. 10.1007/s12224-013-9165-1 [DOI] [Google Scholar]
- Xue, X. , Xiao, Y. , Gong, L. , Guan, S. , Liu, Y. , Lu, H. , Qi, X. , Zhang, Y. , Li, Y. , Wu, X. , & Ren, J. (2008). Comparative 28‐day repeated oral toxicity of Longdan Xieganwan, Akebia trifoliate (Thunb.) koidz., Akebia quinata (Thunb.) Decne. and Caulis aristolochiae manshuriensis in mice. Journal of Ethnopharmacology, 119(1), 87–93. 10.1016/j.jep.2008.05.037 [DOI] [PubMed] [Google Scholar]
- Yang, X. Q. , Kushwaha, S. P. S. , Saran, S. , Xu, J. , & Roy, P. S. (2013). Maxent modeling for predicting the potential distribution of medicinal plant, Justicia adhatoda L. in Lesser Himalayan foothills. Ecological Engineering, 51, 83–87. 10.1016/j.ecoleng.2012.12.004 [DOI] [Google Scholar]
- Yi, Y. , Cheng, X. , Yang, Z. , Wieprecht, S. , Zhang, S. , & Wu, Y. (2017). Evaluating the ecological influence of hydraulic projects: A review of aquatic habitat suitability models. Renewable and Sustainable Energy Reviews, 68, 748–762. 10.1016/j.rser.2016.09.138 [DOI] [Google Scholar]
- Yi, Y. , Cheng, X. , Yang, Z. , & Zhang, S. (2016). Maxent modeling for predicting the potential distribution of endangered medicinal plant (H. riparia Lour) in Yunnan, China. Ecological Engineering, 92, 260–269. 10.1016/j.ecoleng.2016.04.010 [DOI] [Google Scholar]
- Zhang, J.‐M. , Song, M.‐L. , Li, Z.‐J. , Peng, X.‐Y. , Su, S. , Li, B. , Xu, X.‐Q. , & Wang, W. (2021). Effects of climate change on the distribution of Akebia quinata . Frontiers in Ecology and Evolution, 9. 10.3389/fevo.2021.752682 [DOI] [PMC free article] [PubMed] [Google Scholar]
- Zhang, K. , Yao, L. , Meng, J. , & Tao, J. (2018). Maxent modeling for predicting the potential geographical distribution of two peony species under climate change. Science of the Total Environment, 634, 1326–1334. 10.1016/j.scitotenv.2018.04.112 [DOI] [PubMed] [Google Scholar]
- Zhang, K. , Zhang, Y. , Zhou, C. , Meng, J. , Sun, J. , Zhou, T. , & Tao, J. (2019). Impact of climate factors on future distributions of Paeonia ostii across China estimated by MaxEnt. Ecological Informatics, 50, 62–67. 10.1016/j.ecoinf.2019.01.004 [DOI] [Google Scholar]
- Zou, S. , Yao, X. , Zhong, C. , Zhao, T. , & Huang, H. (2018). Genetic analysis of fruit traits and selection of superior clonal lines in Akebia trifoliate (Lardizabalaceae). Euphytica, 214(7), 111. 10.1007/s10681-018-2198-z [DOI] [Google Scholar]
- Zou, S. , Yao, X. , Zhong, C. , Zhao, T. , & Huang, H. (2019). Effectiveness of recurrent selection in Akebia trifoliata (Lardizabalaceae) breeding. Scientia Horticulturae, 246, 79–85. 10.1016/j.scienta.2018.10.060 [DOI] [Google Scholar]
Associated Data
This section collects any data citations, data availability statements, or supplementary materials included in this article.
Supplementary Materials
Fig S1
Fig S2
Fig S3
Fig S4
Supplementary Material
Table S1
Table S2
Table S3
Table S4
Table S5
Table S6
Data Availability Statement
The original contributions presented in the study are included in the article/[Link], [Link], [Link], [Link], [Link], [Link], [Link], [Link], [Link], [Link], [Link]; further inquiries can be directed to the corresponding author/s.