Abstract
Human beings often explore and perceive the characteristics of objects by touching with their fingers. During this process, the contact pressure and shear stress acting on the skin also modulate the tactile sensation. The external environment is an important factor that influences tactile perception as well as the finger friction characteristics. The purpose of this study was to investigate the effects of fluid environments, such as air, deionized water (DW) and thickened water (TW), on perceived roughness and relevant friction behaviour during finger movement. Two studies were performed to analyse the effect of fluid environment as well as the influence of lubricant viscosity on finger tactile friction behaviour. Participants conducted perception and sliding friction tests with their index finger in air and submerged in DW and TW, respectively. Perception tests were performed using a pairwise comparison, scoring the perceived roughness difference between a reference sample and the test sample. The statistical analysis showed that there was no significant difference in the roughness perception between air and DW, while the sensitivity of perception reduced with increasing lubricant viscosity. An approximate calculation of the film thickness was combined with classical lubrication theory to investigate the relationship between perception and friction. In TW, the thick film formed between the finger and the polytetrafluoroethylene plate changed the contact of the asperities with the skin, thus changing the subjective judgement and friction.
Keywords: tactile perception, finger friction, fluid environment, lubrication theory
1. Introduction
Four types of mechanoreceptors in the finger are used to sense the characteristics of touched objects [1]. These characteristics include hardness, coldness, slipperiness and roughness. Hardness is related to the elasticity or compliance of the material, coldness relates to the heat capacity and thermal conductivity, slipperiness can be linked to the friction between the material and the skin and roughness to the height differences on the surface of the touched material [2]. Roughness is one of the most important features for discriminating surface profiles or textures and is frequently analysed in the context of tactile perception. The sensation of ‘roughness’ is the product of an active and integrative neural process producing a conscious feeling when sliding the finger against the physical surface topography. To avoid any misunderstanding in this study, ‘subjective roughness' and ‘perceived roughness’ were employed to specifically describe the sensation of roughness used in the psychology of perception, and ‘surface microgeometry’ and ‘surface asperities’ for the concept in the engineering field. Several studies [3–5] investigated a positive correlation between subjective roughness and physical surface asperity. Smith et al. [6] found that the rate of change of the tangential force may be an important determinant of subjective roughness on surface texture.
Most tactile friction research is performed in an air environment. However, the external environment and the changing state of finger skin are important factors that influence tactile perception and finger tribological properties. Xiao et al. [7] found that the acclimation to temperature and relative humidity affected the receptor thresholds and the touch sensation. Nacht et al. [8] revealed an inverse correlation between perceived greasiness and changes in skin friction after the use of moisturizers. Nonomura et al. [9] found that the wettability of substrates influenced the tactile perception since water and silicone oil on a glass substrate were not distinguishable and both had a large frictional resistance. In a follow-up study, they [10] also observed that frictional resistance was a distinguishing characteristic between water and thickened aqueous solutions. Aktar et al. [11] concluded that the capability to discriminate between different surface asperities reduced with increased viscosity of the lubricant, while the temperature was not found to be significant. Carré et al. [12] observed that wearing a latex glove increased the friction in dry conditions and the opposite was found in wet conditions, and the use of gloves reduced the amplitude threshold of vibration perception. These studies indicate that the environmental conditions, which include temperature, relative humidity, use of moisturizers, lubricants and gloves, will influence touch perception and finger friction. Nevertheless, the mechanisms relating the tribological properties of the finger to the tactile perception in different fluid environments need more attention.
Analysing the behaviour of finger tactile friction in different environments will deepen our understanding of the mechanisms involved in tactile perception and, therefore, be helpful for optimizing hand-operated activities under liquid and moist conditions [13], as well as for the design and operation of intelligent robots in a liquid environment. Also, it would be beneficial for research and development of cosmetic products, such as moisturizers and lotions [14–17]. Finally, finger-based tactile testing is used as a non-oral based method to characterize oral perception because of the similar sensory assessment of tactility and food texture [11,18]. This means that research into finger touch perception in different liquid conditions could also be helpful for oral perception analysis.
The purpose of this study was to investigate the effect of different fluid environments on roughness perception and finger friction. Aktar et al. [11] studied the influence of air, water and Newtonian fluids with different viscosities on roughness discrimination and showed that the roughness perception reduces with increasing viscosity of the lubricants. To quantitatively understand the perceptual difference from a tribological perspective, two studies were performed sequentially based on Aktar's research. First, participants performed both a perception test and a tribological test in air, deionized water (DW) and thickened water (TW) to examine the effect of different fluid environments. Subsequently, a study was conducted using three concentrations of thickener in water to investigate different viscosities of lubricants and their effect on tactile perception and finger friction.
2. Participants and materials
Thirty-five participants aged between 22 and 44 years were recruited in these two studies, including 10 females and 25 males with an average age of 28.63 years and standard deviation (s.d.) of 5.47 years. They were postgraduate students and staff from Imperial College London, UK. The index finger of the dominant hand was used in the research. All measurements were performed in situ and were noninvasive. The study was approved by the Science, Engineering and Technology Research Ethics Committee (SETREC) of Imperial College London, reference 20IC6258.
Polytetrafluoroethylene (PTFE) plates were selected as the tactile stimuli in the experiments, purchased from Gilbert Curry Industrial Plastics Co. Ltd, UK. The samples were denoted as PTFE0, PTFE#240, PTFE#80, PTFE#40 and PTFE#24, machined to create a range of surface microgeometry parameters, such as root mean square height of surface asperities (RMS, Sq), skewness (Rsk) and kurtosis (Rku) parameters, as shown in table 1. The designation PTFE0 related to the original PTFE material, as received, i.e. without any additional manufacturing. The surface asperities of specimens PTFE#240, #80, #40 and #24 were altered from those of PTFE0 through pressing 240 grit, 80 grit, 40 grit and 24 grit sandpaper respectively, using a hydraulic press. The PTFE plates were cut into pieces of 30 × 70 × 1.5 mm3 and were cleaned after each test. Figure 1 displays optical images and three-dimensional topographies of the PTFE samples, measured using a confocal laser microscope (Olympus, OLS5000), showing obvious surface asperity differences.
Table 1.
Surface microgeometry parameters of PTFE samples.
| sample | PTFE0 | PTFE#240 | PTFE#80 | PTFE#40 | PTFE#24 |
|---|---|---|---|---|---|
| Sq (μm) | 4.11 | 9.09 | 20.76 | 67.17 | 80.17 |
| Rsk | 0.23 | −0.54 | −1.74 | −1.19 | −1.27 |
| Rku | 3.44 | 6.6 | 6.72 | 4.18 | 4.09 |
Figure 1.
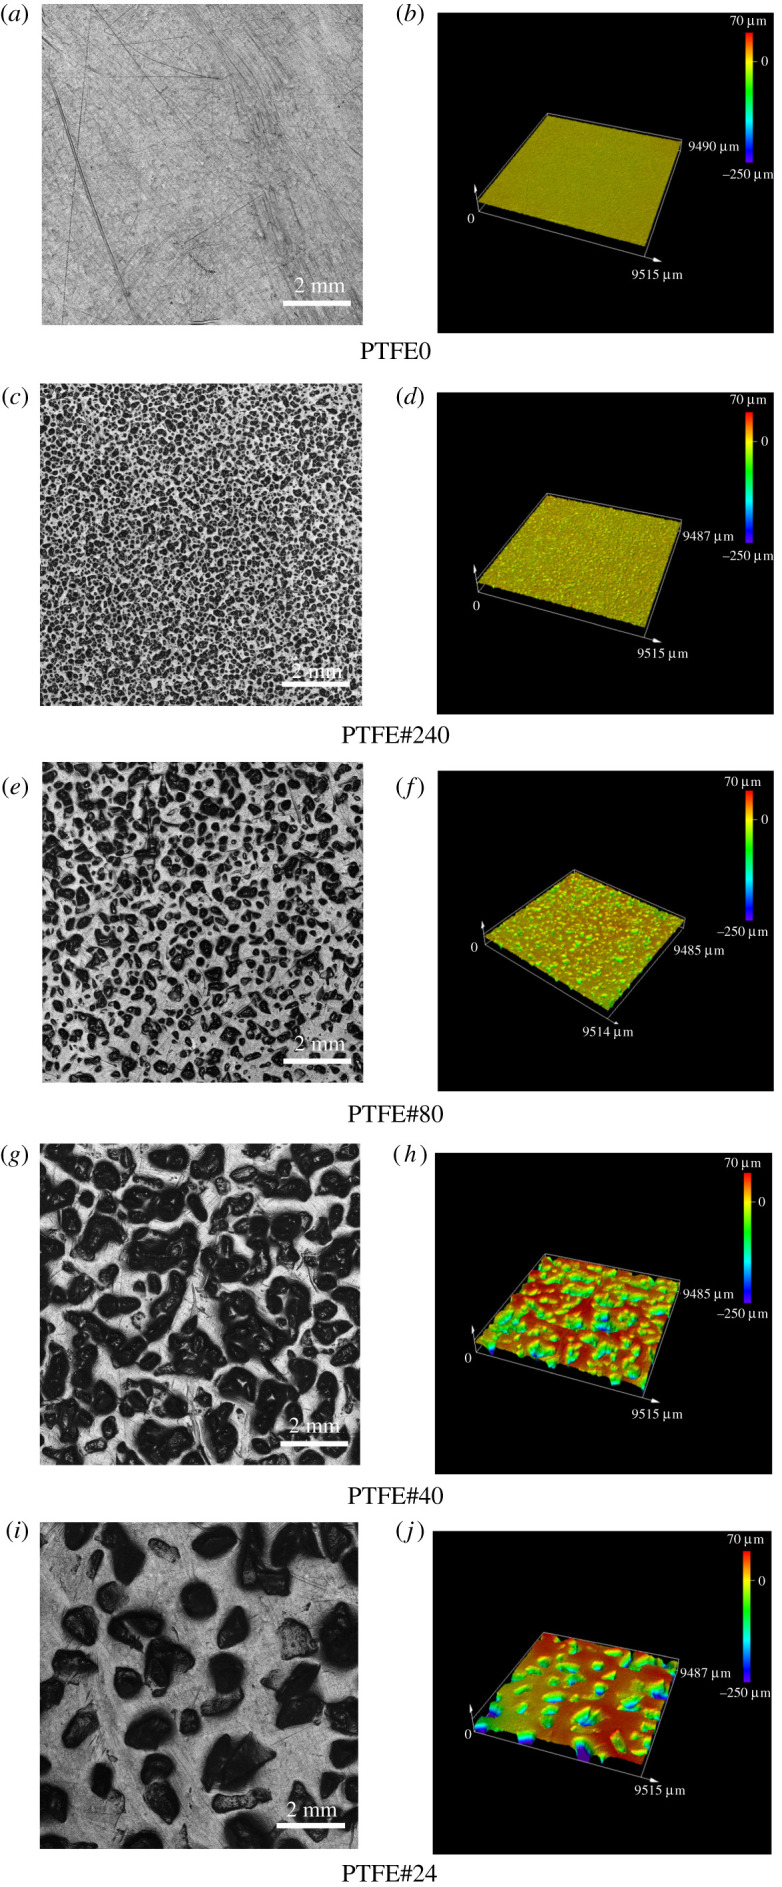
The used PTFE samples in this study: (a,c,e,g,i) optical images and (b,d,f,h,j) three-dimensional topographies.
3. Study 1: air, deionized water and thickened water experiments
3.1. Experimental conditions
Three types of fluid environments were chosen in this first study: air, DW and TW with a concentration of 6 wt% thickener and a dynamic viscosity of 2.481 ± 0.191 Pa s at 25°C measured using a TA Instruments Discovery HR-1 Hybrid Rheometer. The TW was made by combining 6 wt% alginic acid sodium salt and DW. Alginic acid sodium is hydrophilic and forms a viscous gum when hydrated. Alginic acid is widely used in the fields of food industry, as a catalyst, and in water treatment due to its excellent water solubility, film formation, biodegradability and biocompatibility [19,20]. The PTFE samples were glued onto the bottom of Petri dishes with an inside diameter of 88.1 mm and a depth of 15.5 mm. The finger–PTFE contact was submerged by filling the Petri dish to approximately two-thirds of the total volume.
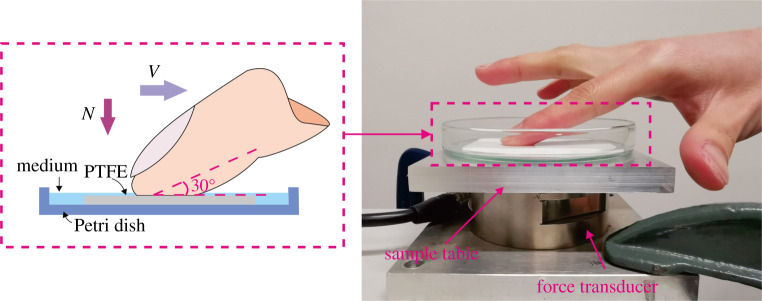
Thirty volunteers, 9 females and 21 males, from the previously mentioned 35 were invited in the first study. Their ages ranged between 22 and 43 years, with an average age of 28.2 years and s.d. of 5.09 years. They were tasked to actively slide the index finger of their dominant hand in the proximal direction (toward their body), along the entire length of the 70 mm long sample, over a period of 7 s, corresponding to an approximate sliding speed of 10 mm s−1. The angle of orientation between the finger and the sample surface was measured using a protractor to be approximately 30°, under a moderate loading force of 1 N, as shown in figure 2. Prior to commencing the formal set of tests, each participant was allowed to familiarize themselves with the motion conditions (force, velocity and finger orientation) and how to keep these constant. During the test, participants could observe the applied normal force signal in real time on a computer screen, enabling them to adjust the applied load accordingly. In addition, a timer was used to assist participants in keeping a constant sliding speed. They were also asked to keep the angle of the hand as constant as possible during the test. All measurements were conducted at room temperature (24 ± 1°C with a relative humidity of 27–55%).
Figure 2.
Schematic of finger–PTFE contact and experimental device for the friction measurement.
3.2. Perception experiment
3.2.1. Procedure of test
Participants cleaned their fingers with hand sanitizer before commencing the experimental programme. After 3 min of drying, a corneometer (Courage and Khazaka CM825) was employed to measure the hydration of the skin. The corneometer uses measured capacitance as an indicator for the hydration of the stratum corneum, and the results are expressed in arbitrary units with a range of 0–120. For each participant, the measurement of skin hydration was performed three times.
In the perception test, participants were blindfolded and asked to score the perceived difference in roughness between each of the rough test specimens (PTFE#240, PTFE#80, PTFE#40) and the smooth reference specimen (PTFE0) on a scale of 0 to 9. In this, a rated roughness difference of 0 meant that there was no perceived difference between the rough test sample and the smooth reference, and a score of 9 meant a large difference. To define the total perceived range of roughness tested, an additional reference on the rough end of the scale was provided by presenting the roughest available sample (PTFE#24, corresponding to a score of 9) once before the formal test programme. The programme was performed in pairwise comparison, participants were asked to first assess the reference surface, followed by the test surface. The various rough samples were presented in random order, while the order of fluid environments was varied considering Latin-Square counterbalance. All specimens and environments were assessed three times and all data from the perception tests and the tribological tests were statistically analysed using SPSS v. 24 with the significance level set at p = 0.05.
3.2.2. Results of the perception tests
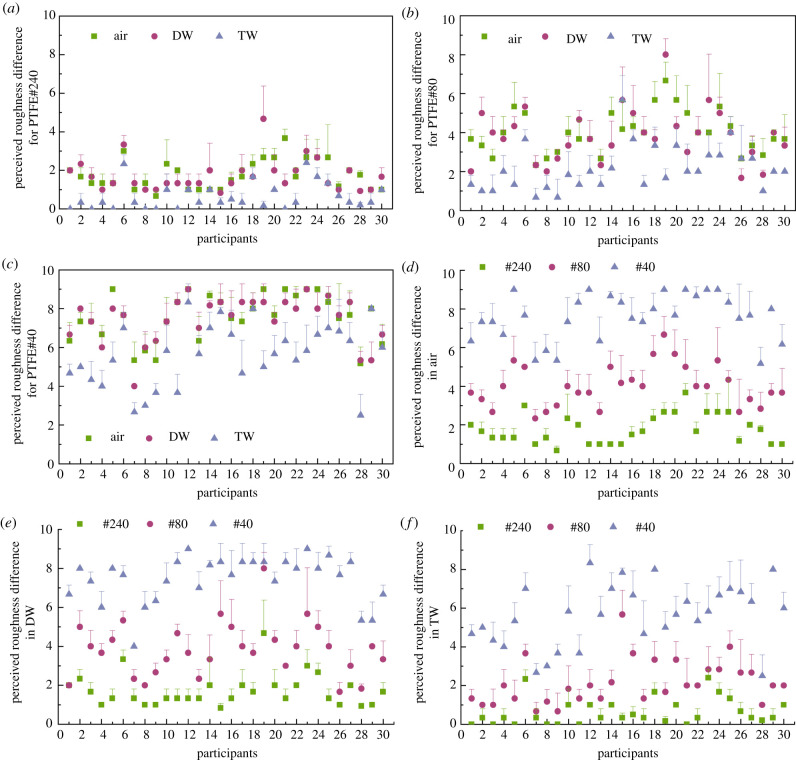
Figure 3 shows the mean skin hydration measured in air for the 30 participants. It can be observed that skin hydration strongly varied between the subjects. The results of the perception tests in air, DW and TW for the different test samples are shown in figure 4. The perceived roughness difference between the specimen and the smooth reference varied with each individual. Figure 4a–c revealed that the score measured for TW was lowest and similar for air and DW for most participants. Figure 4d–f showed that the score of perceived roughness increased with increasing RMS of surface asperities in all fluid environments.
Figure 3.
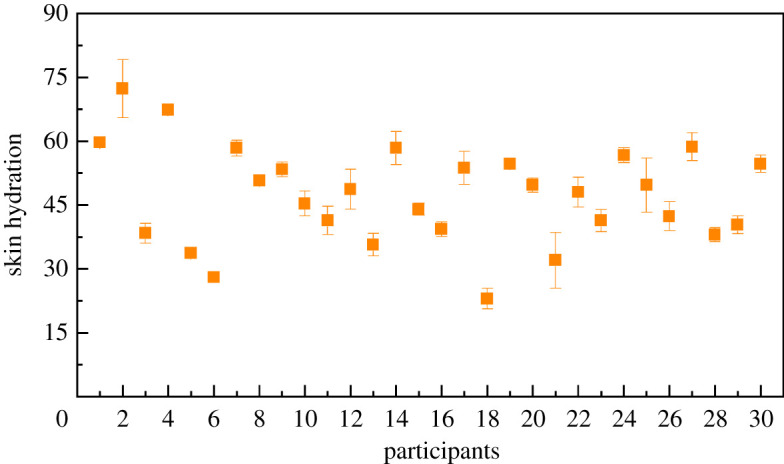
Skin hydration measured in air for 30 participants. Each test was performed three times; the error bars indicate the standard deviation.
Figure 4.
Perceived roughness difference measured in air, DW and TW for (a) PTFE#240, (b) PTFE#80 and (c) PTFE#40 and perceived roughness difference measured for PTFE#240, PTFE#80, PTFE#40 in (d) air, (e) DW and (f) TW. Each test was performed three times. The error bars indicate the standard deviation; error bars shown only in one direction for clarity.
A Pearson correlation analysis showed that there is no simple correlation between skin hydration and perceived roughness (p < 0.05). A 3 × 3 repeated measures ANOVA was employed, representing the three fluid environments: air, DW and TW and the three surface asperity samples: #240, #80 and #40. It should be noted that for the homogeneity of variance, Mauchly's test of sphericity and least significant difference (LSD) were employed. For the heterogeneity of variance, the Greenhouse–Geisser and Bonferroni corrections were investigated. The results of this analysis revealed a main effect of the fluid environment (F2,58 = 66.08, p < 0.01, ), the surface asperities (F2,58 = 670.24, p < 0.01, ), as well as the relevant interaction (F4,116 = 4.42, p < 0.01, ). Further, a main effect analysis showed that there was no significant difference between results obtained in air and in DW (p > 0.05 for all test samples), while a significant effect existed on roughness perception in TW compared to air and DW (p < 0.01 for all test samples). Finally, a significant difference existed between test samples (p < 0.01 for all fluid environments), meaning that the perceived roughness was positively correlated to the surface asperities of the samples and that the different fluid environments did not affect the order of perceived roughness difference among the test samples: higher score for PTFE#40, then for PTFE#80, lowest score for PTFE#240.
Some key observations are summarized as follows:
-
(1)
There is no simple correlation between skin hydration and the perceived roughness in air.
-
(2)
There is a significant main effect of different fluid environments, the surface asperities, as well as the relevant interaction.
-
(3)
There was no significant difference on roughness perception in air and TW, while roughness perception decreased in TW comparing with air and DW, indicating that the fluid environment could change the perceived roughness.
-
(4)
The perceived roughness was positively correlated to the surface asperities of samples. Different fluid environments did not alter the order of perceived roughness difference among the test samples.
3.3. Tribological experiment
3.3.1. Experimental device and procedure
The same subjects who participated in the perception experiment described in §3.2 performed a tribological experiment to investigate the friction behaviour involved in the perception test. A six-axis force/torque sensor (Gamma, ATI industrial automation) was used in the experiment, as shown in figure 2, with sensing ranges of 65 N in the lateral directions and a resolution of 12.5 mN and a normal sensing range of 200 N and a resolution of 25 mN. A Petri dish with a fixed PTFE sample was fixed on the force sensor, allowing participants to actively slide their index finger in the proximal direction. The experimental conditions were set consistent with the perception test, i.e. a nominal sliding speed of 10 mm s−1, a finger orientation angle of 30° and a normal load of 1 ± 0.1 N. Three repeats were carried out for each friction test. The rough surface samples and fluids were presented to each participant in random order.
3.3.2. Results of the friction tests
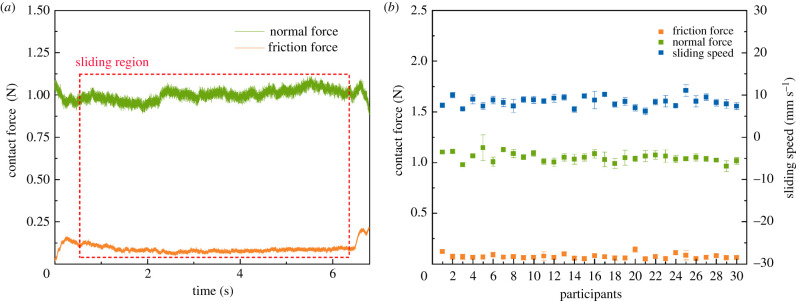
Figure 5a shows a typical friction measurement result obtained from a single participant, sliding their finger against PTFE#80 in TW. The graph shows the measured friction force and normal force. The total resistive force comprises a friction component and a viscous flow component, but the latter has been shown to be very small and is, therefore, ignored. The phase where active sliding occurred is indicated by the red dotted box. During this phase, the friction force and normal force were relatively constant without large fluctuation. Figure 5b shows the average friction force and normal force, as well as calculated sliding speed for all 30 participants in the same experimental condition. The normal force fluctuated around 1 N. The sliding speed of the finger varied between participants, with average values ranging between 7 and 10 mm s−1.
Figure 5.
(a) A typical measurement obtained for a single participant including normal force and friction force against PTFE#80 in TW. (b) The average friction force, normal force and calculated sliding speed for 30 participants sliding against PTFE#80 in TW.
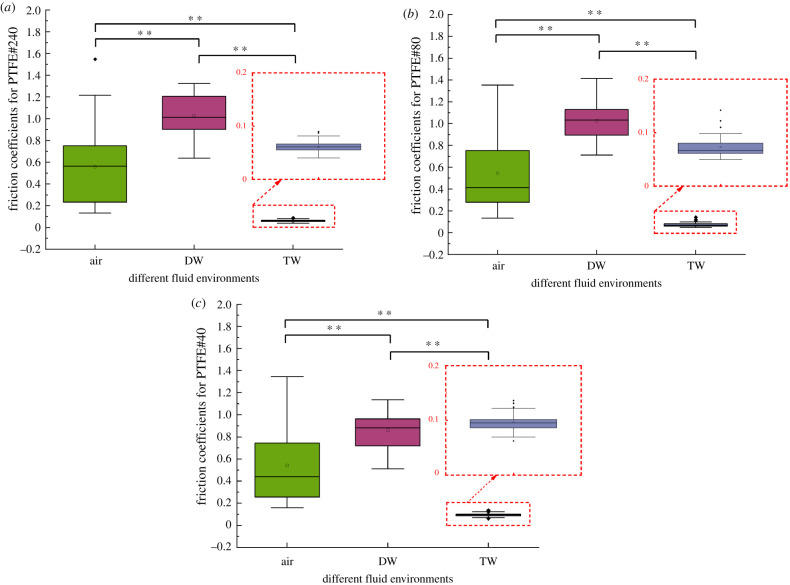
The distribution of friction coefficients measured in air, DW and TW (μair , μDW and μTW) for the three test samples are shown in the boxplots of figure 6a–c. The square marker indicates the average value, while the horizontal line indicates the sample median. The size of the box corresponds to the first and third quartiles. The error bar indicates the total range of values obtained, excluding any outliers. Outliers are marked as small black diamonds. The friction in air μair showed a strong variation between the different participants. The values for μDW fluctuated around 1 while values for μTW were close to 0.1. With reference to the results of the perception tests, we split the data by fluid environment to examine the task performance under different surface asperities. A main effect analysis was used in this part. LSD was employed for the homogeneity of variance and Bonferroni corrections for the heterogeneity of variance. The results showed a significant difference between air and DW, between DW and TW and between air and TW (p < 0.01 for all test samples), indicating μTW < μair < μDW.
Figure 6.
Friction coefficients measured in different fluid environments for (a) PTFE#240, (b) #80, (c) #40. The ‘* *’ indicates a significant difference (p < 0.01) between two variables. The square marker indicates the average value, while the horizontal line indicates the sample median. The size of the box corresponds to the first and third quartiles. The error bar indicates the total range of values obtained, excluding any outliers. Outliers are marked as small black diamonds.
4. Study 2: varied thickened water environments
The first study showed that the environment influenced the tactile perception and finger friction, but also that there was no significant difference in perception between air and water, while the friction values were different. To further understand the effect of different viscosities on perception and friction, a second study was carried out in which the viscosity of the water was changed.
4.1. Experimental conditions and procedure
TW was made with 4 wt%, 6 wt% and 8.5 wt% alginic acid sodium salt resulting in dynamic viscosities of 0.458 ± 0.03 Pa s, 2.481 ± 0.191 Pa s and 8.992 ± 0.444 Pa s measured at 25°C.
Thirty participants, 7 females and 23 males, from the 35 mentioned above were recruited in this study. Ages ranged between 23 and 44 years, with an average age of 28.7 years and a standard deviation of 5.62 years. Of these 30 participants, 25 also participated in the first study. The experimental variables and the range of PTFE samples were the same as those used in the first study; however, participants were not told that this study used the same samples. In addition, the time between the two studies was one month, to avoid any form of learnt behaviour in the participants. In this study, the participants carried out the perception and tribological test simultaneously, i.e. the score of perceived roughness difference and the frictional properties were recorded at the same time. The procedure followed during the perception test was similar to that in the first study. Participants were blindfolded and rated the roughness difference between each test sample and the smooth reference sample on a scale of 0 to 9. The applied normal force and the resulting friction force were measured using the ATI gamma force transducer. Participants familiarized themselves with performing tests under the target motion conditions before the formal test.
4.2. Results
4.2.1. Results of the perception tests
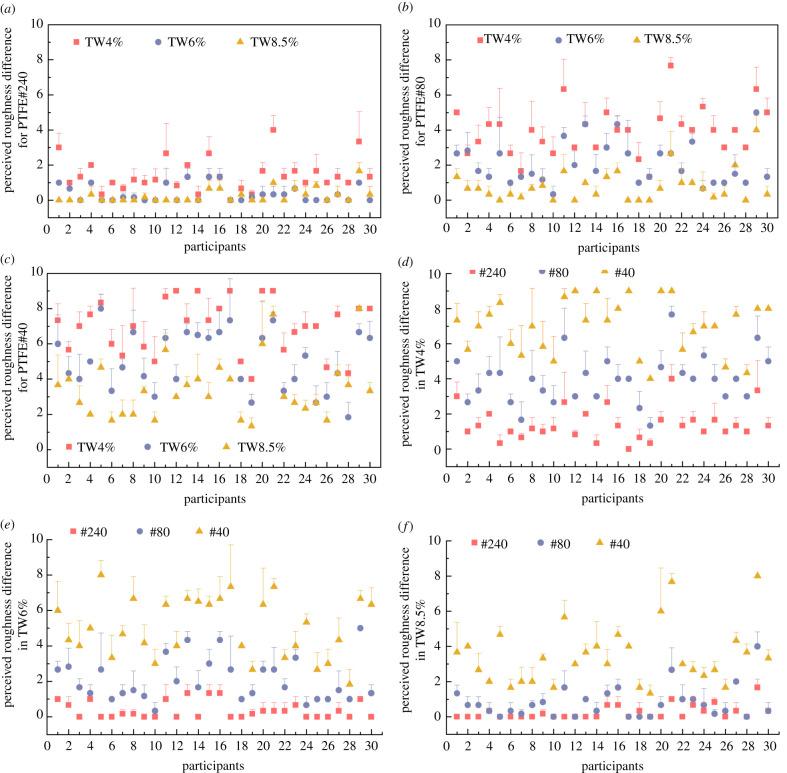
Figure 7a–c shows the perceived roughness differences for the three TWs for all test samples. For sample PTFE#240, the scores measured in TW6% and TW8.5% were similar while the score in TW4% was higher. For sample PTFE#80 and PTFE#40, the scores decreased with increasing viscosity. Figure 7d–f shows that the score of perceived roughness difference increased with the surface asperities of samples in all TWs. A 3 (viscosities: TW4%, TW6% and TW8.5%) × 3 (surface asperity samples: #240, #80 and #40) repeated measures ANOVA revealed a main effect of the viscosity (F2,58 = 188.62, p < 0.01, ), the surface asperities (F2,58 = 439.41, p < 0.01, ), as well as the relevant interaction (F4,116 = 24.86, p < 0.01, ). Further, a main effect analysis showed that there was no significant difference between TW6% and TW8.5% for sample PTFE#240 (p > 0.05) and that a significant effect existed for the other cases (p < 0.01). In addition, a significant difference existed between all test samples (p < 0.01 for all viscosities), meaning that different viscosities did not alter the order of perceived roughness difference among the test samples: higher score for PTFE#40, then for PTFE#80, lowest score for PTFE#240.
Figure 7.
Perceived roughness difference measured in different TWs for (a) PTFE#240, (b) PTFE#80 and (c) PTFE#40 and perceived roughness difference measured for PTFE#240, PTFE#80, PTFE#40 in (d) TW4%, (e) TW6% and (f) TW8.5%. Each test was performed three times. The error bars indicate the standard deviation; error bars shown only in one direction for clarity.
Key observations include:
-
(1)
There is a significant main effect of different viscosities, the surface asperities, as well as the relevant interaction.
-
(2)
The perception of roughness reduced with increasing liquid viscosity.
-
(3)
The effect of viscosity on the roughness perception also depended on the surface asperities of the sample: for smooth surfaces the effect of viscosity was large, while for rough surfaces the effect of viscosity on roughness perception was small, meaning that more viscous lubricants make smoother surfaces feel smoother but the same is not true for rougher surfaces.
-
(4)
Different viscosities did not alter the order of perceived roughness difference among the test samples.
4.2.2. Results of the friction tests
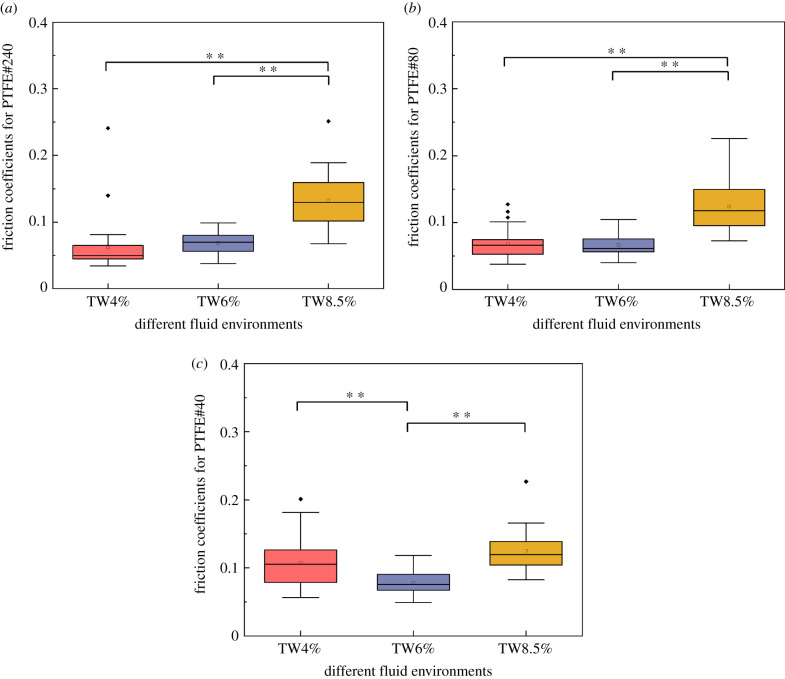
Figure 8 displays boxplots representing the measured friction coefficients (μTW4%, μTW6% and μTW8.5%) obtained for the different fluid environments. For PTFE#240 and PTFE#80, the values of μTW4% and μTW6% were close to each other and μTW8.5% was elevated. In TW8.5% the friction varied significantly between participants, as represented by the larger sized box. For PTFE#40, the mean value of μTW6% was lower than μTW4% and μTW8.5%. With reference to the results of the perception tests, we split the data by viscosity to examine the task performance under different surface asperities. A main effect analysis showed that there was no significant difference between TW4% and TW6% for both PTFE#240 and PTFE#80; also no significant difference was found between TW4% and TW8.5% for PTFE#40 (p > 0.05). Significant differences were identified for other cases (p < 0.01), showing:
Figure 8.
Friction coefficients measured in different fluid environments for (a) PTFE#240, (b) #80, (c) #40. The ‘* *’ indicates the significant difference (p < 0.01) between two variables. The square marker indicates the average value, while the horizontal line indicates the sample median. The size of the box corresponds to the first and third quartiles. The error bar indicates the total range of values obtained, excluding any outliers. Outliers are marked as small black diamonds.
For PTFE#240, μTW8.5% > μTW4%, μTW8.5% > μTW6%, μTW4% ∼ μTW6%.
For PTFE#80, μTW8.5% > μTW4%, μTW8.5% >μTW6%, μTW4% ∼ μTW6%.
For PTFE#40, μTW8.5% ∼ μTW4% > μTW6%.
5. Discussion
5.1. Study 1: air, water and thickened water
Study 1 was performed to investigate the effect of different fluid environments on tactile perception and finger friction. It was observed that roughness judgement decreased when participants perceived samples in TW compared to in air and DW, while there was no significant difference on roughness perception between air and DW. The statistical analysis showed that the viscosity of lubricant negatively affected the roughness judgement. The friction test (figure 6) showed that friction coefficients measured in DW were higher than those in air and TW, while the friction coefficients obtained for TW were lowest. The friction coefficients measured between participants varied greatly in air, then in DW, and the smallest variations were observed in TW. In addition, a correlation analysis between skin hydration levels and the friction results in air showed that there was no simple linear trend between hydration level and friction between different individuals (p > 0.05). Part of the reason may be that there is no method that provides a direct unambiguously quantified value for skin hydration. A more detailed hydration measurement [21], e.g. using dermal Fourier transform infrared spectroscopy of the skin [22], could be considered in future work.
5.1.1. Effect of air and deionized water on roughness perception and friction
There was no significant difference on roughness perception in air and DW, indicating that water did not affect the perception of roughness. It is hypothesized that in the DW case there was no obvious hydrodynamic film generating effect; water was easily pushed away from the contact and the water film formed between the finger and the sample surface did not affect the contact of the asperities on the PTFE surface with the skin. As a result, the participants perceived the actual asperities of the PTFE surfaces in DW, resulting in a similar roughness sensation as was observed in air.
However, the friction in air and DW showed significant differences, showing that the presence of water affected the friction behaviour of finger skin. The stratum corneum, which is the outmost layer of the epidermis, consists of dead or keratinized cells [23] which allows water to form bonds with the side-chain endings, easing absorption of water [24–26]. The plasticization of stratum corneum with water is caused by ‘free water’ which breaks hydrogen bonds in keratin [27]. Tomlinson et al. [24] found that water absorption is the principal mechanism responsible for the increase in friction, followed by capillary adhesion. Both these mechanisms increase friction by increasing the area of contact and, therefore, adhesion. Therefore, the friction coefficient increased compared to in air.
The results of study 1 indicate that the perceived roughness is not directly related to the absolute level of friction in the finger–surface contact. In addition, in TW, a reduction of both roughness perception and friction was found. The effect of TW will be discussed in more detail in the next section.
5.2. Study 2: aqueous environments with different viscosities
The second study, in which the viscosity was varied again comprised a perception test and a tribological test, to understand the effects of viscosity on the tactile friction behaviour of the finger. The results showed a reduction of roughness perception with the increase of thickener content of lubricants. The effect of viscosity on the roughness perception also depended on the surface asperities of the sample. Different tribological behaviors occurred in different fluid environments.
Lubrication theory may help explain the observed differences in perception and friction. Following classical lubrication theory, three regimes of lubrication can be distinguished [28–30]: boundary lubrication, mixed lubrication and full film lubrication. In the case of finger–surface contact, the latter regime can be described as isoviscous elastohydrodynamic lubrication (IEHL). The term isoviscous means that the viscosity of liquid is unaffected by the relatively low contact pressures associated with a soft contact [28]. The film thickness in the IEHL regime was calculated using the model developed by Moes [31] for elliptical contacts with relevant experimental parameters in electronic supplementary material, table S2, providing the film thickness hc values shown in table 2.
Table 2.
Calculation of film thickness for different fluid environments.
| fluid environments | DW | TW4% | TW6% | TW8% |
|---|---|---|---|---|
| dynamic viscosity (Pa s) | 0.00089 | 0.458 | 2.481 | 8.992 |
| film thickness hc (μm) | 0.58 | 24.07 | 64.71 | 136 |
The dimensionless film thickness parameter λ [32] discriminates between the possible regimes in different contact situations. The relationship between λ and the film thickness hc is
| 5.1 |
with the root mean square roughness of the solid i. A value of λ < 1 indicates that the contact operates in the boundary lubrication regime, while a value λ > 3 means a full film has developed between the two contacting surfaces. In between these two regimes, a value of λ between 1 and 3 indicates the mixed lubrication regime.
It should be noted that finger–PTFE contact only occurs at the tops of the fingerprint ridges, while the bottoms of the ridges do not interact with the counter surface. It is, therefore, hypothesized that the film build-up occurs between the tops of the fingerprint ridges and the PTFE, meaning that the fingerprint geometry can be ignored and that the RMS of surface asperities of the PTFE samples as listed in table 1 and the calculated central film thickness of table 2 are to be used to calculate λ and determine the predominant lubrication regime.
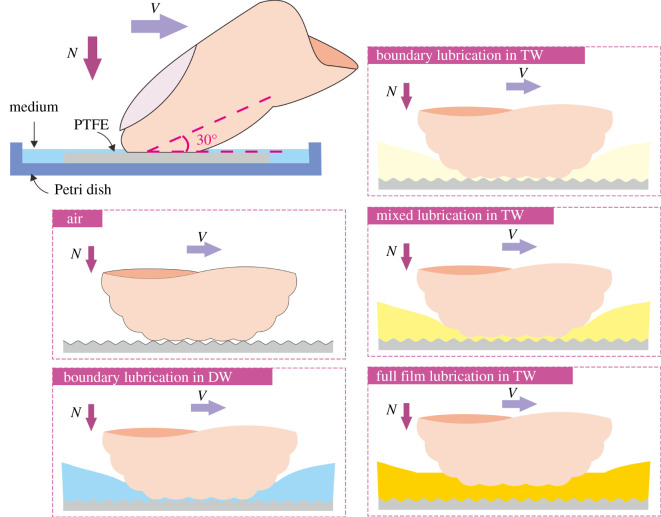
Table 3 shows the lubrication regimes obtained for finger–PTFE contact in the various fluid environments. In DW, the film thickness is insufficient to separate the two surfaces, resulting in boundary lubrication occurring for all surfaces. For the TW lubricated systems, full film lubrication occurs for reference sample PTFE0. Figure 9 shows a schematic illustration of the finger–PTFE contact in air, DW and TW.
Table 3.
Lubrication regimes calculated using the Moes model for film thickness.
| DW | TW4% | TW6% | TW8.5% | |
|---|---|---|---|---|
| PTFE0 | boundary | full | full | full |
| PTFE#240 | boundary | mixed | full | full |
| PTFE#80 | boundary | mixed | mixed | full |
| PTFE#40 | boundary | boundary | boundary | mixed |
Figure 9.
Schematic illustration of the finger–PTFE contact in different fluid environments.
In air the finger skin directly touches the asperities of the sample surface. By adding DW or TW, the state of contact is altered. Water is easily pushed aside and no significant hydrodynamic film develops, resulting in a boundary lubricated contact. Therefore, the perception of the surface roughness in a water environment is not significantly affected compared to air. For elastohydrodynamic lubrication to occur, a relatively thick film needs to be formed between the finger skin and the PTFE surface. In that case, the lubricant film is touched and perceived, instead of the asperities of the PTFE surface. This changed the roughness sensation as well as the friction.
The statistical analysis of the perception results obtained in Study 2 indicated that there was no significant difference for PTFE#240 in TW6% and 8.5%. Table 3 displays that these two cases both operate in the full film regime. For a surface with relatively low surface asperities, such as PTFE#240, a sufficiently thick film is easily formed, particularly when the lubricant is highly viscous. This means that for rough surfaces the effect of viscosity on roughness perception is small, while for smooth surfaces the effect of viscosity is large.
In addition, several researchers [16,28,33] have shown that the friction behaviour of human skin in wet conditions follows the Stribeck curve, which indicates how friction changes with increasing entrainment speed for a given lubricant viscosity. From a statistical analysis of the friction results obtained in the second study, it can be found that
for PTFE#240: μTW8.5% > μTW4%, μTW8.5% > μTW6%, μTW4% ∼ μTW6%,
for PTFE#80: μTW8.5% > μTW4%, μTW8.5% > μTW6%, μTW4% ∼ μTW6%,
for PTFE#40: μTW8.5% ∼ μTW4% > μTW6%.
A schematic of the Stribeck curve can be plotted based on the work of Adams [28]. Figure 10 shows the calculated film thickness from table 3 and the obtained friction results overlayed on these Stribeck curves for the three rough surfaces. The graphs indicate that the regimes calculated from the Moes lubrication model correspond with the obtained experimental friction results for the finger–PTFE contact.
Figure 10.
Schematic of Stribeck curves for the finger–PTFE contact for the three rough test samples and lubricant viscosities.
6. Conclusion
The external environment is an important factor that affects the contact between the finger and the surface of objects that are touched. This work investigated the effect of air, DW and TW on the roughness perception. The following conclusions can be drawn:
-
(1)
There is a significant main effect of different fluid environments, the surface asperities, as well as the relevant interaction on roughness perception.
-
(2)
Skin hydration does not significantly affect the roughness perception in air. There is no significant difference on roughness perception in air and DW.
-
(3)
Roughness perception decreases in TW compared to air and DW, and with increasing viscosity respectively.
-
(4)
The effect of viscosity on the roughness perception also depends on the roughness of the sample: for rough surfaces the effect of viscosity is small, while for smooth surfaces the effect of viscosity on roughness perception is large.
-
(5)
The perceived roughness was positively correlated to the surface asperities. Different fluid environments and viscosities did not alter the order of perceived roughness difference among the test samples.
-
(6)
The different fluid environments affect the friction results as well as the film thickness.
-
(7)
In TW, a relatively thick film is formed between the finger and the PTFE surface. This changes the contact of the asperities with the skin, thus changing subjective judgement and friction.
Acknowledgement
The authors wish to thank the three reviewers of this paper for their helpful comments and suggestions.
Ethics
The study was approved by the Science, Engineering and Technology Research Ethics Committee (SETREC) of Imperial College London, reference 20IC6258. Participants provided written informed consent.
Data accessibility
This article has no additional data.
Authors' contributions
X.Z.: conceptualization, data curation, formal analysis, methodology, resources, software, visualization, writing—original draft, writing—review and editing; M.M.: data curation, formal analysis, investigation, project administration, software, validation, writing—review and editing; Y.L.: data curation, investigation, supervision, writing—review and editing; K.K.Y.: investigation, supervision, writing—review and editing; M.M.: investigation, supervision, writing—review and editing; Z.J.: funding acquisition, project administration, supervision, writing—review and editing.
All authors gave final approval for publication and agreed to be held accountable for the work performed therein.
Competing interests
We declare we have no competing interests.
Funding
The research was funded by the financial support of the China Scholarship Council (no. 201907000020) and the 111 Project (B20008).
References
- 1.Kandel E, Schwartz J, Jessel TM. 2013. Principles of neural science, 5th edn. New York, UK: McGraw-Hil. [Google Scholar]
- 2.Tiest W. 2010. Tactual perception of material properties. Vision Res. 50, 2775-2782. ( 10.1016/j.visres.2010.10.005) [DOI] [PubMed] [Google Scholar]
- 3.Stevens SS, Harris JR. 1962. The scaling of subjective roughness and smoothness. J. Exp. Psychol. 64, 489-494. ( 10.1037/h0042621) [DOI] [PubMed] [Google Scholar]
- 4.Hollins M, Bensmäıa S, Karlof K, Young F. 2000. Individual differences in perceptual space for tactile textures: evidence from multidimensional scaling. Percept. Psychophys. 62, 1534-1544. ( 10.3758/BF03212154) [DOI] [PubMed] [Google Scholar]
- 5.Ekman G, Hosman J, Lindstrom B. 1965. Roughness, smoothness and preference: a study of quantitative relations in individual subjects. J. Exp. Psychol. 70, 18-26. ( 10.1037/h0021985) [DOI] [PubMed] [Google Scholar]
- 6.Smith AM, Chapman CE, Deslandes M, Langlais JS, Thibodeau MP. 2002. Role of friction and tangential force variation in the subjective scaling of tactile roughness. Exp. Brain Res. 144, 211-223. ( 10.1007/s00221-002-1015-y) [DOI] [PubMed] [Google Scholar]
- 7.Liao X, et al. 2017. Effects of contact method and acclimation on temperature and humidity in touch perception. Text. Res. J. 88, 1605-1615. ( 10.1177/0040517517705628) [DOI] [Google Scholar]
- 8.Nacht S, Close J, Yeung D, Gans E. 1981. Skin friction coefficient: changes induced by skin hydration and emollient application and correlation with perceived skin. J. Soc. Cosmet. Chem. 32, 55-65. [Google Scholar]
- 9.Nonomura Y, Arashi Y, Maeno T. 2009. How do we recognize water and oil through our tactile sense? Colloids Surf. B Biointerfaces 73, 80-83. ( 10.1016/j.colsurfb.2009.05.001) [DOI] [PubMed] [Google Scholar]
- 10.Nonomura Y, Saito R, Takahashi A. 2015. Friction at fingertip surface during water contact process. Bull. Chem. Soc. Jpn 88, 949-954. ( 10.1246/bcsj.20150059) [DOI] [Google Scholar]
- 11.Aktar T, Chen J, Ettelaie R, Holmes M, Henson B. 2017. Human roughness perception and possible factors effecting roughness sensation. J. Texture Stud. 48, 181-192. ( 10.1111/jtxs.12245) [DOI] [PubMed] [Google Scholar]
- 12.Carré MJ, Tan SK, Mylon PT, Lewis R. 2017. Influence of medical gloves on fingerpad friction and feel. Wear 376–377, 324-328. ( 10.1016/j.wear.2017.01.077) [DOI] [Google Scholar]
- 13.Ray M, Sanli E, Brown R, Ennis KA, Carnahan H. 2018. The combined effect of cold and moisture on manual performance. Hum. Factors 60, 92-100. ( 10.1177/0018720817740154) [DOI] [PubMed] [Google Scholar]
- 14.Trautmann M, et al. 2017. Not only age but also tactile perception influences the preference for cosmetic creams applied to the forearm. Int. J. Cosmet. Sci. 39, 344-350. ( 10.1111/ics.12382) [DOI] [PubMed] [Google Scholar]
- 15.Tang W, Bhushan B, Ge S. 2010. Friction, adhesion and durability and influence of humidity on adhesion and surface charging of skin and various skin creams using atomic force microscopy. J. Microsc. 239, 99-116. ( 10.1111/j.1365-2818.2009.03362.x) [DOI] [PubMed] [Google Scholar]
- 16.Wang Y, Li J, Shang Y, Zeng X. 2018. Study on the development of wax emulsion with liquid crystal structure and its moisturizing and frictional interactions with skin. Colloids Surf. B Biointerfaces 171, 335-342. ( 10.1016/j.colsurfb.2018.07.039) [DOI] [PubMed] [Google Scholar]
- 17.Skedung L, Buraczewska-Norin I, Dawood N, Rutland MW, Ringstad L. 2016. Tactile friction of topical formulations. Skin Res. Technol. 22, 46-54. ( 10.1111/srt.12227) [DOI] [PubMed] [Google Scholar]
- 18.Zhong L, Hadde EK, Zhou Z, Xia Y, Chen J. 2018. Sensory discrimination of the viscosity of thickened liquids for dysphagia management. J. Sens. Stud. 33, e12464. ( 10.1111/joss.12464) [DOI] [Google Scholar]
- 19.Guo X, Wang Y, Qin Y, Shen P, Peng Q. 2020. Structures, properties and application of alginic acid: a review. Int. J. Biol. Macromol. 162, 618-628. ( 10.1016/j.ijbiomac.2020.06.180) [DOI] [PubMed] [Google Scholar]
- 20.Masuko M, Suzuki A, Sagae Y, Tokoro M, Yamamoto K. 2006. Friction characteristics of inorganic or organic thin coatings on solid surfaces under water lubrication. Tribol. Int. 39, 1601-1608. ( 10.1016/j.triboint.2006.03.002) [DOI] [Google Scholar]
- 21.Cornuault PH, Carpentier L, Bueno MA, Cote JM, Monteil G. 2015. Influence of physico-chemical, mechanical and morphological fingerpad properties on the frictional distinction of sticky/slippery surfaces. J. R. Soc. Interface 12, 20150495. ( 10.1098/rsif.2015.0495) [DOI] [PMC free article] [PubMed] [Google Scholar]
- 22.Klaassen M, De Vries EG, Masen MA.. 2020. Interpersonal differences in the friction response of skin relate to FTIR measures for skin lipids and hydration. Colloids Surf. B Biointerfaces 189, 110883. ( 10.1016/j.colsurfb.2020.110883) [DOI] [PubMed] [Google Scholar]
- 23.Eroschenko VP, Di Fiore MSH. 2013. Difiore's atlas of histology with functional correlations. Philadelphia, PA: Lippincott, Williams & Wilkins. [Google Scholar]
- 24.Tomlinson SE, Lewis R, Liu X, Texier C, Carré MJ. 2010. Understanding the friction mechanisms between the human finger and flat contacting surfaces in moist conditions. Tribol. Lett. 41, 283-294. ( 10.1007/s11249-010-9709-y) [DOI] [Google Scholar]
- 25.Rosen MR. 2005. Delivery system handbook for personal care and cosmetic products—technology, applications and formulations. Norwich, NY: William Andrew Publishing. [Google Scholar]
- 26.Fluhr J, Elsner P, Berardesca E, Maibach H. 1994. Bioengineering of the skin: water and the stratum corneum. Boca Raton, FL: CRC Press. [Google Scholar]
- 27.Takahashi M, Kawasaki K, Tanaka M, Ohta S, Tsuda Y. 1981. The mechanics of stratum corneum plasticization with water. In Bioengineering and the skin (eds Marks R, Payne PA), pp. 67-74. Lancaster, UK: MTP Press. [Google Scholar]
- 28.Adams MJ, Briscoe BJ, Johnson SA. 2007. Friction and lubrication of human skin. Tribol. Lett. 26, 239-253. ( 10.1007/s11249-007-9206-0) [DOI] [Google Scholar]
- 29.de Vicente J, Stokes JR, Spikes HA. 2006. Rolling and sliding friction in compliant, lubricated contact. Proc. Inst. Mech. Eng. J: J. Eng. Tribol. 220, 55-63. ( 10.1243/13506501jet90) [DOI] [Google Scholar]
- 30.Bongaerts JHH, Fourtouni K, Stokes JR. 2007. Soft-tribology: lubrication in a compliant PDMS–PDMS contact. Tribol. Int. 40, 1531-1542. ( 10.1016/j.triboint.2007.01.007) [DOI] [Google Scholar]
- 31.Nijenbanning G, Venner CH, Moes H. 1994. Film thickness in elastohydrodynamically lubricated elliptic contacts. Wear 176, 217-229. ( 10.1016/0043-1648(94)90150-3) [DOI] [Google Scholar]
- 32.Hamrock BJ, Schmid BJ, Jacobson BO. 2004. Fundamentals of fluid film lubrication. Boca Raton, FL: CRC Press. [Google Scholar]
- 33.Persson BNJ, Kovalev A, Gorb SN. 2012. Contact mechanics and friction on dry and wet human skin. Tribol. Lett. 50, 17-30. ( 10.1007/s11249-012-0053-2) [DOI] [Google Scholar]
Associated Data
This section collects any data citations, data availability statements, or supplementary materials included in this article.
Data Availability Statement
This article has no additional data.


