Key Points
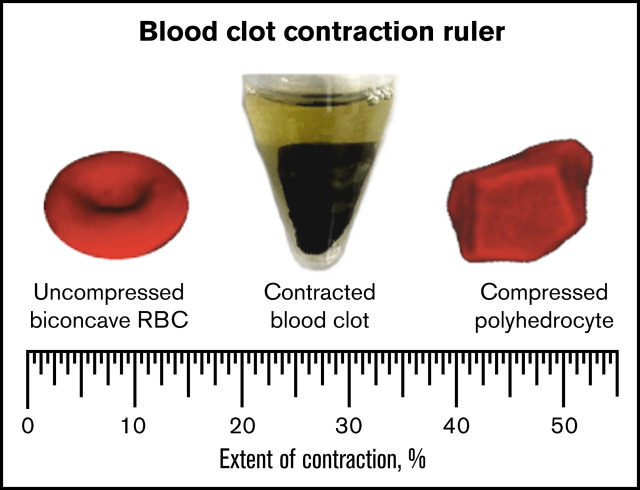
Ratio of compressed polyhedral to native biconcave RBCs in blood clots and thrombi is a “ruler” to measure extent of clot contraction.
The extent of intravital contraction of ex vivo arterial and venous thrombi is associated with their origins, age, and embologenicity.
Visual Abstract
Abstract
Blood clots and thrombi undergo platelet-driven contraction/retraction followed by structural rearrangements. We have established quantitative relationships between the composition of blood clots and extent of contraction to determine intravital contraction of thrombi and emboli based on their content. The composition of human blood clots and thrombi was quantified using histology and scanning electron microscopy. Contracting blood clots were segregated into the gradually shrinking outer layer that contains a fibrin-platelet mesh and the expanding inner portion with compacted red blood cells (RBCs). At 10% contraction, biconcave RBCs were partially compressed into polyhedral RBCs, which became dominant at 20% contraction and higher. The polyhedral/biconcave RBC ratio and the extent of contraction displayed an exponential relationship, which was used to determine the extent of intravital contraction of ex vivo thrombi, ranging from 30% to 50%. In venous thrombi, the extent of contraction decreased gradually from the older (head) to the younger (body, tail) parts. In pulmonary emboli, the extent of contraction was significantly lower than in the venous head but was similar to the body and tail, suggesting that the emboli originate from the younger portion(s) of venous thrombi. The extent of contraction in arterial cerebral thrombi was significantly higher than in the younger parts of venous thrombi (body, tail) and pulmonary emboli but was indistinguishable from the older part (head). A novel tool, named the “contraction ruler,” has been developed to use the composition of ex vivo thrombi to assess the extent of their intravital contraction, which contributes to the pathophysiology of thromboembolism.
Introduction
Formation of blood clots is followed by their volumetric shrinkage, known as contraction or retraction,1,2 driven by forces generated by the platelet cytoskeleton that are transmitted to fibrin fibers.3 The contraction of blood clots and thrombi can occur not only in vitro but also in vivo as a pathophysiologic process that improves hemostasis,4 increases blood flow past otherwise obstructive thrombi,5 prevents thrombotic embolization,6 alters clot susceptibility to fibrinolysis,7 and has other clinical implications.5,6,8-12
In the course of contraction, blood clots undergo structural changes, including 2 major morphological consequences. First, the contractile forces compress RBCs, resulting in their deformation from initially biconcave to a polyhedral shape (polyhedrocytes).13,14 Second, clot contraction is followed by spatial redistribution of components, such that RBCs are packed tightly in the interior part while a meshwork of fibrin and platelets accumulates at the exterior.4,13 The unusual structural features of blood clots undergoing contraction were first revealed with clots formed in vitro,13 but later, similar changes were found in ex vivo thrombi of various origins.6,13,15-18
Despite these studies of the structural changes of blood clots and thrombi during contraction, some important questions remain unanswered. What is the actual extent of shrinkage of in vivo blood clots and thrombi? How do the structural changes relate to the degree of blood clot contraction? Is it possible to estimate the extent of intravital contraction of thrombi based on their composition and structure? Answering these questions would help to better understand the pathophysiology of thrombosis and have great clinical significance.
In this study, we have conducted a quantitative analysis of the structure and composition of in vitro clots at different known degrees of contraction. Based on these data, we created a graphic “ruler” that allows converting the results of cellular morphometry to the degree of contraction for a blood clot or thrombus. Then, we applied this “contraction ruler” to ex vivo arterial and venous thrombi and thrombotic emboli to assess the extent of their intravital contraction. A comparative analysis of the data obtained enabled us to propose associations between the extent of contraction of entire thrombi or thrombus parts with their age, embologenicity, and origins.
Methods
In vitro blood clots and ex vivo thrombotic material were subject to quantitative morphometry using light microscopy and scanning electron microscopy (SEM). After fixation, each blood clot or thrombus was cut open longitudinally so that both the interior part and the edges could be viewed. Micrographs were transposed onto a computer screen, and the particular structural elements were marked and quantified (Figure 1; supplemental Figure 1).
Figure 1.
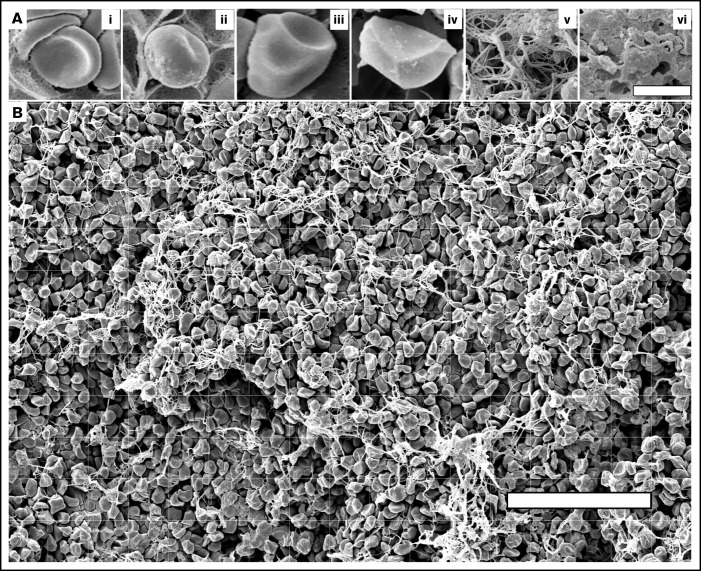
Imaging and quantification of the structural elements of blood clots using high-resolution scanning electron microscopy. (A) Illustrating the structures analyzed in this study: nondeformed biconcave RBC (i), intermediate mainly biconcave RBC (ii), intermediate mainly polyhedral RBC (iii), fully compressed polyhedral RBC (polyhedrocyte) (iv), fibrin fibers (v), and sponge-like fibrin (vi). Bar represents 3.6 μm. (B) A scanning electron micrograph with overlaid grid used to quantify the composition of a blood clot. The structural elements were marked and measured individually. For RBCs, the number for each cell type was counted per image. For fibrin, the area occupied by fibrous and spongy fibrin structures within each grid square was estimated and expressed as percentage. The total area of each image taken at ×500 magnification was 154 μm × 238 μm = 36 652 μm2 (∼36 700 μm2). Scale bar represents 50 μm.
A total of 180 microscope slides and 135 SEM images were analyzed from 9 clots from normal blood samples at 5 various time points of contraction. One hundred fifteen SEM images were analyzed from 23 contracted clots formed from pathological blood samples obtained from prothrombotic patients with moderate to severe COVID-19. A total of 117 SEM images of randomly selected areas were obtained from the head, body, and tail of 13 venous thrombi. A total of 18 images of randomly selected areas were obtained and analyzed from 6 pulmonary thrombotic emboli. A total of 120 images of randomly selected areas were obtained and analyzed from 24 cerebral arterial thrombi.
Details of formation of in vitro blood clots, extraction of ex vivo venous and arterial thrombi and pulmonary emboli, sample preparation for histology and SEM, quantification of the composition of blood clots and thrombi, as well as statistical analyses are described in the supplemental data.
Results
Microscopically revealed spatial segregation of in vitro blood clots during the time course of contraction
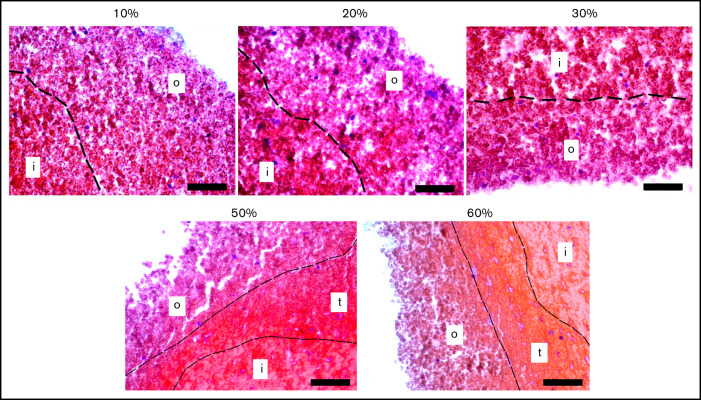
The extent of clot contraction (supplemental Figure 2) increased over time until ∼1 hour and then reached a plateau (supplemental Figure 3). Histological examination of contracting blood clots at various time points revealed that clots underwent characteristic dynamic structural changes in the form of spatial segregation of clot components. Representative histological images of blood clots fixed at 10, 20, 30, 45-50, and 60 minutes with various degrees of contraction are shown in Figure 2 and supplemental Figure 4. The main observation was that during contraction, the clots segregated progressively into at least 2 distinct spatial compartments, named the outer layer and the inner portion, with an occasionally observed transition zone. The basis for morphological distinction of the parts of the clot was the packing density of RBCs, such that the inner part contained denser tessellated RBCs, whereas in the outer layer, RBCs interspersed with fibrin were less compact with larger intercellular spaces, and the transition zone, when discerned, had an intermediate density (for details see supplemental Results, section 1).
Figure 2.
Representative histological images of blood clots with varying extents of contraction. A border (dotted line) between the outer layer (o) and inner portion (i) of a clot is determined by the difference in the packing density of erythrocytes. Sometimes at the higher extents of contraction, a transition zone (t) with intermediate packing density was observed (hematoxylin and eosin stain; original magnification ×400). Scale bar represents 50 µm.
The relative size of the outer and inner parts changed with time during contraction, resulting in shrinkage of the outer layer and a corresponding growth of the inner portion of the clot. To quantify these structural rearrangements as a function of time and degree of clot contraction, the histological images were used to measure the thickness of the outer layer to calculate the relative volumes of the outer and inner portions. Because the blood clots were roughly cone-shaped, the total volume of the clot (V) was determined as
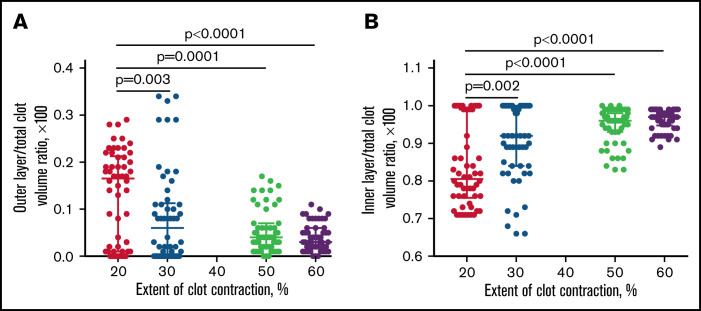
where h is the total cone height, r is the radius of the base (1/2 d), and the other corresponding parameters used for the calculations are shown in supplemental Figure 5. An increase in the extent of contraction was associated with progressive shrinkage of the outer layer, whereas the volume fraction of the inner portion increased over time (Figure 3). These changes indicate redistribution of the clot components during contraction, with central accumulation of compacted RBCs that are recruited from the diminishing outer layer.
Figure 3.
Spatial redistribution of contracting blood clots. Dot-plots showing relative volume fractions of the outer layer (A) and inner portion (B) in the blood clots at increasing extents of contraction. If the boundary was not distinct, the borderline between the outer and inner layers was drawn through the middle of the transition zone. Each dot (n = 54) represents a volume fraction measured for an individual blood clot from 9 identically stained histological slides obtained for clots from 9 independent blood samples and stained with 2 techniques. Results are presented as a median with interquartile range. Statistical analysis was performed using the Friedman test with the correction for multiple comparisons and the false discovery rate with a 2-stage step-up method of Benjamini, Krieger, and Yekutieli.
Dynamic composition of in vitro blood clots during contraction
To study the detailed composition of blood clots, we used high-resolution SEM, which enabled us to assess not only the packing density but also the shape of the cells, namely the transition from biconcave to polyhedral RBCs. The structural elements identified and analyzed in the contracted clots are shown in Figure 1 and included nondeformed and deformed RBCs as well as fibrin. Notably, platelet aggregates associated with fibrin were identified rarely, perhaps due to disintegration of thrombin-activated platelets.19
Based on the packing density and the presence of fibrin, the samples were segregated into the looser outer layer, intermediate part, and densely packed center of contracting clots (Figure 4; supplemental Figure 6). The 3 SEM-based portions of a clot roughly corresponded to the histologically defined regions: the outer layer, transition zone, and inner portion, respectively (Figure 2; supplemental Figure 4).
Figure 4.
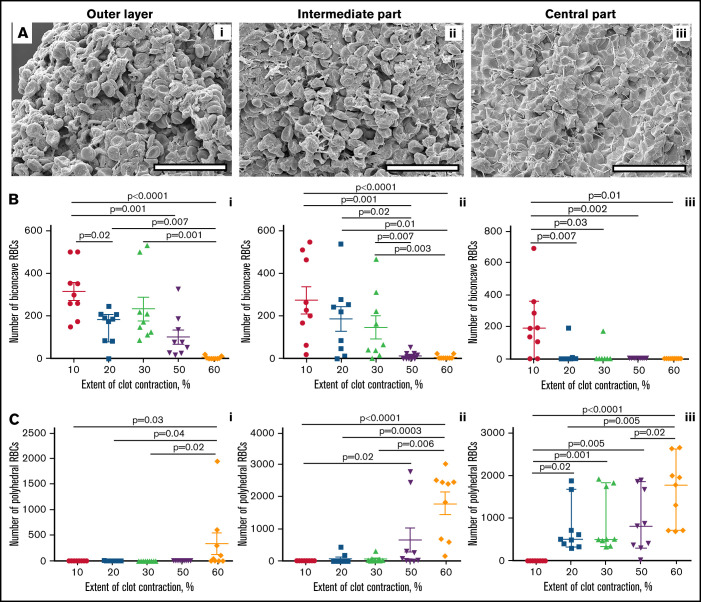
Quantification of biconcave and polyhedral RBCs in the layers of blood clots at varying degrees of contraction. (A) Representative scanning electron micrographs taken in the outer layer (left column), intermediate part (middle column), and center (right column) of a contracted blood clot. The clot outer layer (Ai) contains mostly nondeformed biconcave RBCs (represented in Figure 1Ai) and empty spaces, whereas in the center (Aiii) all cells are compressed (Figure 1Aiv) and there are almost no empty spaces. The intermediate layer (Aii) contains intermediate-shaped RBCs (Figure 1Aii-iii). Fibrin is revealed in the outer layer and intermediate parts only. Scale bars represent 25 μm. (B-C) Dot plots showing a reduction of the absolute number of biconcave RBCs (Bi-iii) and increase of polyhedral RBCs (polyhedrocytes) (Ci-iii) per image area in the outer layer, intermediate part, and center in blood clots with an increasing extent of contraction. Each dot represents a number calculated from 1 of 3 scanning electron micrograph (36 700 µm2) of a blood clot from 9 independent blood samples. Results are presented as the median with interquartile range. Statistical analysis: Friedman test with post hoc Benjamini, Krieger, and Yekutieli test.
The composition of the spatially segregated clot layers depended on the extent of whole-clot macroscopic contraction (Figure 4; supplemental Figures 7 and 8). With an increase in the extent of contraction, the number of nondeformed biconcave RBCs decreased throughout the clots (Figure 4B) and equally in the outer layer (Figure 4B1), intermediate (Figure 4B2), and central (Figure 4B3) parts. Notably, the number of biconcave RBCs in the outer layer (Figure 4B1) and intermediate (Figure 4B2) part of the contracting clots decreased gradually, whereas in the central part, the content of uncompressed biconcave RBCs decreased abruptly at 20% extent of contraction (Figure 4B3), suggesting full conversion to compressed cell forms.
Conversely, the number of compressed polyhedral RBCs increased with clot contraction throughout the clots, although nonuniformly (Figure 4C). In the outer layer (Figure 4C1) and intermediate (Figure 4C2) part, polyhedrocytes were not identified until the extent of clot contraction reached 60% or 50%, respectively. Dissimilarly, there was a dramatic increase in the number of polyhedrocytes in the clot center that occurred as early as at 20% extent of contraction and grew further with the progression of clot contraction (Figure 4C3), indicating the prevalent accumulation, compaction, and compression of RBCs in the clot core over the lateral portions. Notably, at the latest stage of contraction, the outer layer contained few, if any, compressed RBCs because polyhedral forms became an exclusive part of the inner region.
In addition to cellular composition, SEM, unlike histology, allowed us to visualize differential spatial distribution of fibrin, such that the outer part usually had a lot of fibrin; in the intermediate part, it could be found occasionally, and the inner part was free of fibrin (supplemental Results, section 2).
Establishing quantitative relationships between the cellular composition of blood clots and the extent of contraction
To establish the relationship between the cellular composition and the extent of contraction of blood clots, we quantified the content of nondeformed and deformed RBC types throughout the clot, irrespective of their spatial distribution within the clot layers. To do so, we combined the results of cell type quantification from the SEM images obtained from various parts of the contracting clots. In particular, 3 images from each part of a clot (outer layer, intermediate, and central parts) were analyzed, and the data were averaged. The goal was to find relationship(s) between the cellular composition of blood clots and the extent of clot contraction. Based on the content of various RBC types (supplemental Table 1), we found that the polyhedral/biconcave RBC ratio displayed the most stringent interdependence on the extent of clot contraction.
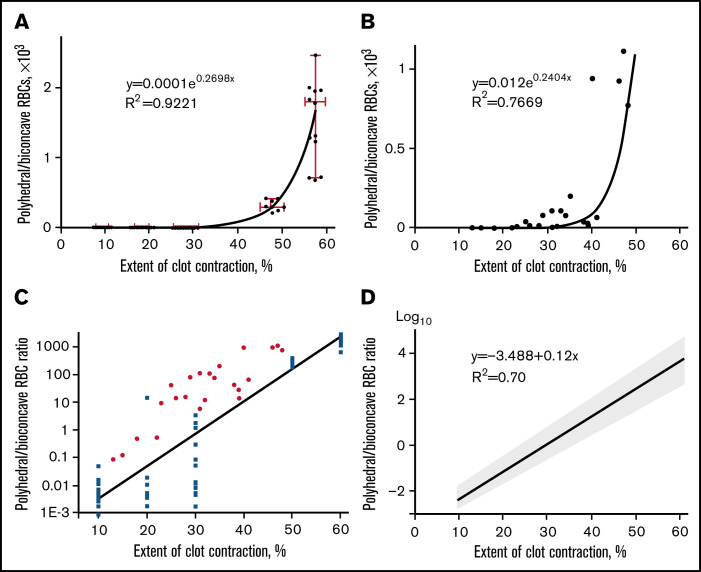
First, we analyzed the cellular composition of clots obtained from normal blood samples as a function of contraction time (supplemental Figure 9 red line). The ratio of polyhedral to biconcave RBCs (calculated from 9-27 SEM images for each time point) plotted against the time of contraction revealed an exponential relation (supplemental Figure 9 blue line) with a high accuracy of fitting (R2 = 0.83). After being calibrated against the same independent parameter (i.e., the time of contraction), the cellular composition and extent of contraction were plotted against each other (Figure 5A) and the relation between them remained exponential. The curve obtained and mathematical relation between the extent of contraction (now considered an independent variable) and the polyhedral/biconcave RBCs ratio comprise a tool to establish an unknown degree of clot contraction based on the known content of compressed/uncompressed RBCs.
Figure 5.
The ratio of compressed polyhedral RBCs (polyhedrocytes) and uncompressed biconcave RBCs in blood clots as a function of the extent of clot contraction. (A) The polyhedral/biconcave RBC ratio as a function of the extent of clot contraction fitted with an exponential (R2 = 0.92) for clots formed from normal blood samples. Each dot represents an averaged ratio of the 2 RBC types calculated and combined from 3 scanning electron micrographs obtained for the outer layer, intermediate, and central parts of each clot at a certain extent of contraction. The clots were obtained from 9 independent blood samples and analyzed at 5 various extents of contraction, so the total number of SEM images quantified and used for this plot was 3 × 9 × 5 = 135. The data points were fitted with an exponential function (solid line). The horizontal error bars represent a mean ± SD, whereas the vertical error bars represent the median and 95% CI. (B) The polyhedral/biconcave RBC ratio as a function of the extent of clot contraction fitted with an exponential (R2 = 0.77) for clots formed from 23 pathological blood samples. (C) A semi-logarithmic plot that represents the cellular composition vs extent of contraction shown in supplemental Figure 10 (blue squares represent clots formed from normal blood; red dots represent clots formed from pathological blood samples). (D) Weighted linear regression with computationally defined 95% CI. The weighting of the measurement error is a correction for heteroscedasticity seen in Figure 5C. This linear plot is described by a mathematical function [y = −3.488 + 0.12x] with a scatter (95% confidence intervals: slope [0.11; 0.13], Y-intercept [−3.87; −3.12], X-intercept [27.9; 31.1]).
To see if this regularity works for pathologically altered blood composition, a relation between the polyhedral/biconcave RBCs ratio and the extent of clot contraction was tested in pathological blood samples with a broad range of platelet count, hematocrit, and fibrinogen levels (supplemental Table 2). All blood samples were obtained from prothrombotic patients with moderate to severe COVID-19 (supplemental Table 3). Figure 5B clearly shows that the relation between the polyhedral/biconcave RBCs ratio and the extent of clot contraction remained exponential, as in the clots from normal blood samples.
The data points obtained from clots formed from normal and pathological blood samples were combined into 1 plot (supplemental Figure 10). The newly built fitting curve for the representative set of data from normal and pathological blood samples reflects a relation between the cellular composition and extent of contraction for a broad range of clots, mimicking formation of thrombi from pathologically altered blood. This plot comprises a basis for the contraction ruler to convert cellular composition of ex vivo thrombi to the extent of their intravital contraction.
The extent of intravital contraction of arterial and venous thrombi and thrombotic emboli determined based on their cellular composition
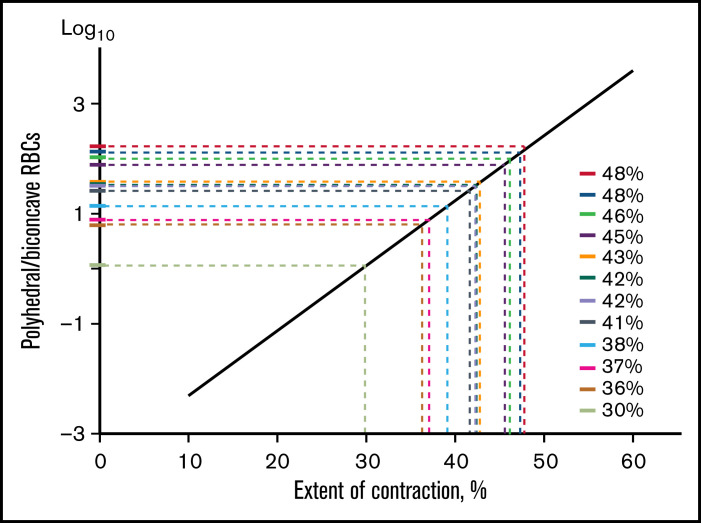
To establish a graphic relation with regard to data variability, we presented the cellular composition vs extent of clot contraction in a semi-logarithmic scale (Figure 5C) and performed weighted linear regression (Figure 5D). This linear plot comprises the eventual contraction ruler used in this work as a tool to extrapolate manually the cellular composition of ex vivo thrombi (y-axis) to the extent of their intravital contraction (x-axis) (Figures 5D and 6; supplemental Figure 11). Supplemental Tables 4 to 6 provide particular paired numbers for each single thrombus or embolus analyzed, whereas Figure 7 shows the averaged extents of intravital contraction of the venous thrombi and their parts, pulmonary emboli, and arterial cerebral thrombi for comparative analysis.
Figure 6.
Application of the contraction ruler to assess the extent of intravital contraction for individual venous thrombi based on their cellular composition. A polyhedral/biconcave RBC ratio (y-axis) determined for each thrombus from a set of scanning electron micrographs is extrapolated to the x-axis to determine the corresponding extent of contraction. The contraction ruler is based on the extensive quantification of the cellular composition of in vitro blood clots obtained in normal and pathological blood samples with various known extents of contraction, which revealed an exponential relation between the ratio of polyhedral to biconcave RBCs and the extent of clot contraction (Figure 5).
Figure 7.
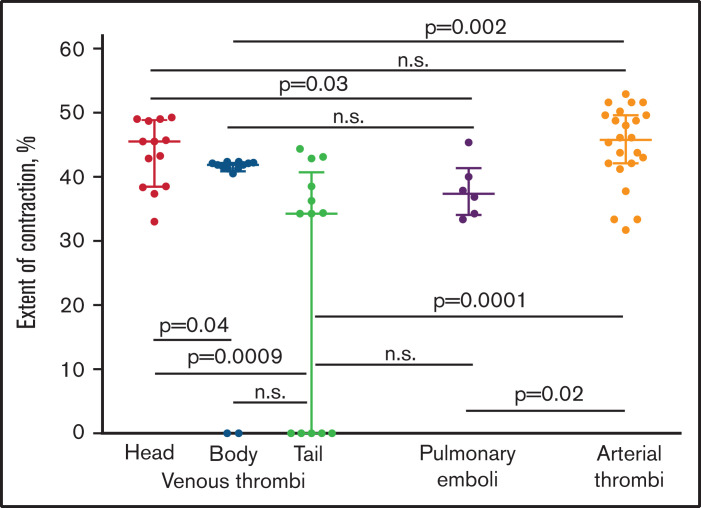
The comparative extents of intravital contraction of the parts of venous thrombi (head, body, and tail), pulmonary thrombotic emboli, and arterial cerebral thrombi determined using the contraction ruler. Each dot represents an averaged number based on the polyhedral/biconcave RBC ratio from 3 electron micrographs of individual venous thrombi (n = 13) and their parts, pulmonary emboli (n = 6), and 5 electron micrographs of individual cerebral thrombi (n = 24). The results are presented as a median with interquartile range. n.s., not significant. The statistical analysis was performed using the Mann-Whitney U test (for 2 different types of thrombi) and the Kruskal–Wallis test (for head, body, and tail of venous thrombi) with Dunn’s post hoc test for multiple comparisons (P = .004). The result was confirmed with a false discovery rate controlled using a 2-stage linear step-up procedure of Benjamini, Krieger, and Yekutieli (individual P value = .0008 for head and tail of venous thrombi).
First, we divided the venous thrombi into 3 parts that differed by the time of formation, considering the vessel-attached head as the oldest portion, the floating tail as the youngest portion of a thrombus, and the body as having an intermediate age between the 2.15 The extent of contraction of the head (median 45%; interquartile range, IQR 39;49) of venous thrombi was significantly higher than that of the tail (34%; IQR 0;41; P = .0009) or the body of venous thrombi (42%; IQR 41;42; P = .04) (Figure 7), suggesting that the older parts of a thrombus were more contracted than the younger part. In addition, the extent of contraction between parts of venous thrombi (head, body, and tail) showed a statistically significant difference (Kruskal–Wallis test, P = .004, for all 3 parts, and false discovery rate, P = .0008, for the head and tail). This result was confirmed using the χ2 test after segregating the degrees of contraction into 2 subgroups of categorical values (>40% and ≤40%). The significant order of the reduced extent of contraction was as follows: head > body > tail (head vs body vs tail, P = .04; head vs tail, P = .02).
Next, we compared the degree of contraction between the 3 different parts of venous thrombi and the pulmonary emboli. The average extent of contraction was significantly different only between the emboli (median 38%; IQR 34;42) and the head of venous thrombi (P = .03), whereas the extent of contraction between the emboli was indistinguishable from the body (P > .05) and tail (P > .05) (Figure 7), suggesting that the emboli may originate from the younger parts of venous thrombi that are less compacted.
Lastly, we sought to compare the extents of contraction between arterial and venous thrombi and thrombotic emboli, which have big differences in the content of platelets, RBCs, and fibrin.15 Based on the “ruler,” the average extent of contraction in arterial cerebral (median 46%; IQR 42;50) thrombi was significantly higher compared with the body (P = .002) and tail (P = .0001) of venous thrombi as well as the emboli (P = .02), but it was the same for the head of venous thrombi (P > .05) (Figure 7). This result was also confirmed using the χ2 test after segregating the degrees of contraction into 2 subgroups (>40% and ≤40%); the extent of contraction in arterial thrombi was significantly higher than in the tail of venous thrombi (P = .0009). As a matter of fact, the comparison of the extents of contraction of the whole venous thrombi (median 41%; IQR 27;44) with the emboli (38%; IQR 34;42) and arterial thrombi (46%; IQR 42;50) did not show any significant differences (P > .05). The numbers for the whole venous thrombi were obtained by averaging the extents of contraction of their parts: heads, bodies, and tails weighted for the part size.
Discussion
This study has 2 interdependent specific aims: (1) quantifying structural rearrangements of in vitro blood clots as a function of the controlled extent of contraction and (2) using these established relationships for determination of the extent of intravital contraction of ex vivo thrombi and pulmonary emboli based on their composition.
During contraction, in vitro blood clots undergo segregation into the outer, intermediate, and inner spatial compartments. Although nonuniformity was described both for in vitro13,20 and in vivo4,16,18,21 contracted blood clots, here we have demonstrated the progressive reduction of the outer layer with a corresponding increase of the inner portion size during contraction. Remarkably, the beginning spatial redistribution of clot components was revealed as early as at 20% extent of contraction (Figures 2 and 4; supplemental Figures 4, 7, and 8). The sorting of blood clot components is propelled by the complex mechanochemical machinery,22 but redistribution of clot components remains an understudied and unexplained structural feature of the contracted clots. Pathophysiological implications of the spatial nonuniformity of contracted clots and thrombi may be important to modulate permeability,13 mechanical stability,6 and susceptibility of thrombi to fibrinolysis.7
Another prominent structural alteration induced by contraction of blood clots is formation of deformed RBCs, resulting from compression of the RBC-rich inner portion by the platelet-fibrin meshwork pressing from outside.13,14 The novelty of our study is that the content of compressed RBCs in blood clots and thrombi has been quantified and correlated with the controlled time-dependent volume shrinkage. We have established numerical relationships between the increasing extent of blood clot contraction and gradual transformation of uncompressed biconcave RBCs to fully deformed polyhedrocytes. Beginning at 10% contraction, the volume fraction of polyhedral and intermediate mainly polyhedral RBCs in a clot become the prevailing structures in the clot at 20% contraction and higher (Figure 4C; supplemental Figure 7B). The content of polyhedral and intermediate mainly polyhedral RBCs in individual clots ranges from 0% to 99% and reaches a maximum at 50% to 60% shrinkage (supplemental Table 1), which is limited by hematocrit. The numbers characterizing blood clot composition and the extent of contraction may depend on clot geometry, which is a limitation of this study.
An important practical implication of the increasing RBC deformations during clot contraction is that the content of compressed polyhedral RBCs in the clot can serve as a quantitative measure of the extent of contraction, at least within the range of ∼20% to 50%. Here, the ratio of polyhedral to biconcave RBCs has been used to create a “ruler” for assessment of the extent of intravital contraction of ex vivo thrombi from the ratio of compressed to uncompressed RBCs. The nonlinear exponential relation between the clot volume and composition may be explained, at least in part, by squeezing out liquid serum during compression. Regardless of the underlying biomechanics, this relation could be used to create a mathematical “ruler” that enables us to estimate the extent of contraction of any blood clot or thrombus based on its cellular composition determined using SEM. This “ruler” is a new tool to determine a previously unknown and essentially unknowable extent of contraction from the measurable cellular composition of blood clots and thrombi.
This contraction ruler was applied to 3 types of thrombotic material, namely venous thrombi, pulmonary emboli, and arterial cerebral thrombi. The composition of each thrombus or embolus was analyzed using SEM to quantify various structural elements. Importantly, the ex vivo thrombi and emboli contained RBCs with the same distinct shapes, corresponding to different degrees of compression, as observed in contracted clots formed in vitro. In particular, RBCs in thrombi varied from biconcave, uncompressed cells to fully compressed, polyhedral RBCs (polyhedrocytes), with at least 2 discernible intermediate forms (Figures 1A1-4 and 4B-C; supplemental Figure 7). After morphometric measurements, we used the contraction ruler to convert the measured content of fully compressed and uncompressed RBCs to values of the extent of intravital contraction for each arterial or venous thrombus or embolus (Figure 6; supplemental Figure 11; supplemental Tables 4-6).
It should be noted that distinct features of clotting in vivo, such as varying composition of blood, effects of blood flow and new components of the clot being delivered by flow, and inhomogeneity in clots and other conditions, could all affect the extent to which this ruler applies to thrombi as well as its accuracy. Multiple clinical factors can also modulate thrombus structure and composition, including the content of RBCs. However, the polyhedrocyte/biconcave RBC ratio is determined solely by the extent of contraction because the only source of polyhedrocytes is platelet-driven compression after thrombus formation. Regardless of what promotes or suppresses clot contraction, the morphological response would be either an increased or decreased fraction of polyhedrocytes, respectively. Despite some inaccuracy of the “ruler” due to inherent variations of the parameters, it allows for the comparative analysis of the ex vivo thrombi of various origins within a realistic range of the extent of their natural contraction. Analysis of the degrees of intravital contraction of thrombi and emboli helped to answer at least several questions that have great significance in the pathophysiology of thrombosis.
Question 1: What is the extent of contraction in vivo in human thrombi? There has been controversy about the existence of clot contraction in vivo.1,21,23-26 Now we have good evidence for clot contraction from studies of fresh ex vivo thrombi, and our contraction ruler allows us to obtain an estimate of the extent of intravital contraction in thrombi, which varies from ∼30% to ∼50%.
Question 2: What is the relation between the thrombus age and the extent of its volumetric shrinkage? Expectedly, in the older parts of venous thrombi (head and body), the degree of compaction is significantly higher than in the younger area (tail) (Figure 7). If this conclusion holds for arterial thrombi as well, this may be a reason for the known increased lytic and mechanical resistance of older and, hence, more compacted thrombi.27 Dramatically decreased susceptibility of contracted vs uncontracted blood clots to external fibrinolysis (mimicking therapeutic thrombolysis) was shown earlier,7 and there may be a broad range of intermediate states during initiation, gradual formation, and prolonged maturation of in vivo thrombi.
Question 3: Is weaker contraction of a thrombus associated with a higher risk of embolization? Our results provide strong evidence in support of the notion that the extent of contraction is related inversely to embologenicity of a thrombus. Specifically, the extent of contraction was found to be the lowest in the pulmonary emboli and indistinguishable from the tail of venous thrombi (Figure 7), which is considered the most embologenic portion of a venous thrombus.28,29 The underlying mechanism of increased embologenicity associated with reduced contraction is likely due to the low packing density of a thrombus or its part that is prone to rupture. It is possible that the rupture of a weakly contracted/compacted thrombus or portions of it may be induced or promoted by a structural defect (crack) due to local fibrinolysis in combination with hydrodynamic shear forces of blood flow.30
Question 4: Do arterial and venous thrombi differ in their ability to undergo contraction? Given the typically higher content of activated platelets and lower content of RBCs in arterial vs venous thrombi,15,31-33 the presumable answer would be yes, with greater contractility for arterial thrombi. However, our data do not support this conclusion in general, because there was no significant difference in the extent of contraction between arterial and venous thrombi analyzed as a whole. The difference in the extent of contraction was only between arterial thrombi and the body and tail of venous thrombi, with no difference compared with the head (Figure 7). This result suggests that although activated platelets are the driving force of contraction of blood clots and thrombi, the ultimate extent of volumetric shrinkage depends on many other conditions, such as the high arterial shear rate and spatial heterogeneity of these clots and thrombi,34 the thrombus age, RBC content,35 the amount of fibrin and mechanical properties of the fibrin scaffold,36 the presence of inflammatory cells,37 and treatments.
Question 5: How can the apparent contradiction between impaired clot contraction in patients with thrombotic diseases and the predominance of compressed RBCs indicating clot contraction in thrombi be resolved? There is now evidence that clot contraction is diminished in patients with many (pro)thrombotic conditions: ischemic stroke,5 venous thromboembolism,6 systemic lupus erythematosus,8 sickle cell disease,38 high risk of pregnancy loss,9 rheumatoid arthritis,10 postoperative thrombosis,12 hyperhomocysteinemia,11 and COVID-19.39 At the same time, quantitative determination of the composition of venous and arterial thrombi and pulmonary emboli has revealed that these structures contain few biconcave RBCs, and they are almost entirely polyhedrocytes or intermediate forms of RBCs.14 These 2 sets of results represent an apparent contradiction that clot contraction is partially impaired in thrombotic conditions, yet the RBCs in thrombi are compressed, presumably from clot contraction, because the thrombi also display the redistribution of components characteristic of clot contraction. This study resolves this conundrum, because thrombi are 30% to 53% contracted, whereas compressed polyhedral RBCs become prevailing structures in blood clots already at an ∼20% volume shrinkage (Figure 4C3). In summary, thrombi certainly do undergo contraction although it is partially impaired, with the extent of the defect depending on many local and systemic pathophysiological conditions.
In conclusion, clot contraction is followed by redistribution of fibrin/platelets toward the clot periphery and accumulation of compacted RBCs in the inner portion of the clot, followed by gradual transformation of biconcave RBCs to deformed polyhedral RBCs (polyhedrocytes). When the cellular composition was averaged over the entire clot volume, the ratio of polyhedral to biconcave RBCs vs the extent of contraction was found to follow an exponential relation and was used to assess the extent of intravital contraction of ex vivo thrombi. A comparative analysis of the data obtained enabled us to propose correlations between the extent of intravital contraction of entire thrombi or thrombus parts and their age, embologenicity, and origins.
Supplementary Material
The full-text version of this article contains a data supplement.
Acknowledgments
The authors thank Dmitry V. Malyasyov (Interregional Clinical Diagnostic Center, Kazan, Russia) for providing venous thrombi; Carolyn L. Cambor (Hospital of the University of Pennsylvania, Philadelphia, PA) for providing pulmonary emboli; and Václav Procházka, Jaromír Gumulec, and Jiří Mačák (University Hospital Ostrava, Czech Republic) for providing arterial cerebral thrombi and corresponding clinical information. The authors also thank Chandrasekaran Nagaswami (University of Pennsylvania School of Medicine, Philadelphia, PA) for training R.R.K. in the use of scanning electron microscopy.
This work was supported by grants from the National Heart, Lung, and Blood Institute, National Institutes of Health (RO1-HL148227, P01-HL40387, and RO1-HL148014), University of Pennsylvania Research Foundation grant, grants from the Russian Foundation for Basic Research (grants 19-015-00075 and 20-015-00257), grant 21-75-00010 from the Russian Science Foundation, and the “Priority 2030” Program at the Kazan Federal University. Scanning electron microscopy was supported by NIH Shared Instrumentation Grant S10-OD018041.
Authorship
Contribution: J.W.W. and R.I.L. designed the research; J.W.W., R.I.L., and R.R.K. designed the methodology; R.R.K., S.A., A.D.P., K.S., and N.G.E. performed the investigation; J.W.W., R.I.L., and R.R.K. wrote the paper; and J.W.W. and R.I.L. supervised the work.
Conflict-of-interest disclosure: The authors declare no competing financial interests.
Correspondence: John W. Weisel, University of Pennsylvania, 421 Curie Blvd, BRB II/III, Room 1154, Philadelphia, PA 19104-6058; e-mail: weisel@pennmedicine.upenn.edu.
References
- 1.Carr ME Jr. Development of platelet contractile force as a research and clinical measure of platelet function. Cell Biochem Biophys. 2003;38(1):55–78. [DOI] [PubMed] [Google Scholar]
- 2.Tucker KL, Sage T, Gibbins JM. Clot retraction. Methods Mol Biol. 2012;788:101–107. [DOI] [PMC free article] [PubMed] [Google Scholar]
- 3.Kim OV, Litvinov RI, Alber MS, Weisel JW. Quantitative structural mechanobiology of platelet-driven blood clot contraction. Nat Commun. 2017; 8(1):1274. [DOI] [PMC free article] [PubMed] [Google Scholar]
- 4.Leong L, Chernysh IN, Xu Y, et al. Clot stability as a determinant of effective factor VIII replacement in hemophilia A. Res Pract Thromb Haemost. 2017;1(2):231–241. [DOI] [PMC free article] [PubMed] [Google Scholar]
- 5.Tutwiler V, Peshkova AD, Andrianova IA, Khasanova DR, Weisel JW, Litvinov RI. Contraction of blood clots is impaired in acute ischemic stroke. Arterioscler Thromb Vasc Biol. 2017;37(2):271–279. [DOI] [PMC free article] [PubMed] [Google Scholar]
- 6.Peshkova AD, Malyasyov DV, Bredikhin RA, et al. Reduced contraction of blood clots in venous thromboembolism is a potential thrombogenic and embologenic mechanism. TH Open. 2018;2(1):e104–e115. [DOI] [PMC free article] [PubMed] [Google Scholar]
- 7.Tutwiler V, Peshkova AD, Le Minh G, et al. Blood clot contraction differentially modulates internal and external fibrinolysis. J Thromb Haemost. 2019;17(2):361–370. [DOI] [PubMed] [Google Scholar]
- 8.Le Minh G, Peshkova AD, Andrianova IA, et al. Impaired contraction of blood clots as a novel prothrombotic mechanism in systemic lupus erythematosus. Clin Sci (Lond). 2018;132(2):243–254. [DOI] [PubMed] [Google Scholar]
- 9.Peshkova AD, Safiullina SI, Evtugina NG, et al. Premorbid hemostasis in women with a history of pregnancy loss. Thromb Haemost. 2019;119(12):1994–2004. [DOI] [PubMed] [Google Scholar]
- 10.Peshkova AD, Evdokimova TA, Sibgatullin TB, Ataullakhanov FI, Litvinov RI, Weisel JW. Accelerated spatial fibrin growth and impaired contraction of blood clots in patients with rheumatoid arthritis. Int J Mol Sci. 2020;21(24):9434. [DOI] [PMC free article] [PubMed] [Google Scholar]
- 11.Litvinov RI, Peshkova AD, Le Minh G, et al. Effects of hyperhomocysteinemia on the platelet-driven contraction of blood clots. Metabolites. 2021;11(6):354. [DOI] [PMC free article] [PubMed] [Google Scholar]
- 12.Evtugina NG, Peshkova AD, Pichugin AA, Weisel JW, Litvinov RI. Impaired contraction of blood clots precedes and predicts postoperative venous thromboembolism. Sci Rep. 2020;10(1):18261. [DOI] [PMC free article] [PubMed] [Google Scholar]
- 13.Cines DB, Lebedeva T, Nagaswami C, et al. Clot contraction: compression of erythrocytes into tightly packed polyhedra and redistribution of platelets and fibrin. Blood. 2014;123(10):1596–1603. [DOI] [PMC free article] [PubMed] [Google Scholar]
- 14.Tutwiler V, Mukhitov AR, Peshkova AD, et al. Shape changes of erythrocytes during blood clot contraction and the structure of polyhedrocytes. Sci Rep. 2018;8(1):17907. [DOI] [PMC free article] [PubMed] [Google Scholar]
- 15.Chernysh IN, Nagaswami C, Kosolapova S, et al. The distinctive structure and composition of arterial and venous thrombi and pulmonary emboli. Sci Rep. 2020;10(1):5112. [DOI] [PMC free article] [PubMed] [Google Scholar]
- 16.Litvinov RI, Khismatullin RR, Shakirova AZ, et al. Morphological signs of intravital contraction (retraction) of pulmonary thrombotic emboli. BioNanoSci. 2018;8(1):428–433. [Google Scholar]
- 17.Ząbczyk M, Sadowski M, Zalewski J, Undas A. Polyhedrocytes in intracoronary thrombi from patients with ST-elevation myocardial infarction. Int J Cardiol. 2015;179:186–187. [DOI] [PubMed] [Google Scholar]
- 18.Khismatullin RR, Nagaswami C, Shakirova AZ, et al. Quantitative morphology of cerebral thrombi related to intravital contraction and clinical features of ischemic stroke. Stroke. 2020;51(12):3640–3650. [DOI] [PubMed] [Google Scholar]
- 19.Kim OV, Nevzorova TA, Mordakhanova ER, et al. Fatal dysfunction and disintegration of thrombin-stimulated platelets. Haematologica. 2019; 104(9):1866–1878. [DOI] [PMC free article] [PubMed] [Google Scholar]
- 20.Zabczyk M, Natorska J, Undas A. Erythrocyte compression index is impaired in patients with residual vein obstruction. J Thromb Thrombolysis. 2018;46(1):31–38. [DOI] [PMC free article] [PubMed] [Google Scholar]
- 21.Nechipurenko DY, Receveur N, Yakimenko AO, et al. Clot contraction drives the translocation of procoagulant platelets to thrombus surface. Arterioscler Thromb Vasc Biol. 2019;39(1):37–47. [DOI] [PubMed] [Google Scholar]
- 22.Tutwiler V, Chen X, Litvinov RI, Khismatullin RR, Weisel JW, Shenoy V. Clot contraction drives structural redistribution of platelets, fibrin and red blood cells through energy minimization [abstract]. Mol Biol Cell. 2019;30(26). Abstract P1503/B637. [Google Scholar]
- 23.Muthard RW, Diamond SL. Blood clots are rapidly assembled hemodynamic sensors: flow arrest triggers intraluminal thrombus contraction. Arterioscler Thromb Vasc Biol. 2012;32(12):2938–2945. [DOI] [PMC free article] [PubMed] [Google Scholar]
- 24.Stalker TJ, Welsh JD, Tomaiuolo M, et al. A systems approach to hemostasis: 3. Thrombus consolidation regulates intrathrombus solute transport and local thrombin activity. Blood. 2014;124(11):1824–1831. [DOI] [PMC free article] [PubMed] [Google Scholar]
- 25.Ono A, Westein E, Hsiao S, et al. Identification of a fibrin-independent platelet contractile mechanism regulating primary hemostasis and thrombus growth. Blood. 2008;112(1):90–99. [DOI] [PubMed] [Google Scholar]
- 26.Zalewski J, Lewicki L, Krawczyk K, et al. Polyhedral erythrocytes in intracoronary thrombus and their association with reperfusion in myocardial infarction. Clin Res Cardiol. 2019;108(8):950–962. [DOI] [PubMed] [Google Scholar]
- 27.Emberson J, Lees KR, Lyden P, et al. ; Stroke Thrombolysis Trialists’ Collaborative Group . Effect of treatment delay, age, and stroke severity on the effects of intravenous thrombolysis with alteplase for acute ischaemic stroke: a meta-analysis of individual patient data from randomised trials. Lancet. 2014;384(9958):1929–1935. [DOI] [PMC free article] [PubMed] [Google Scholar]
- 28.Norris CS, Greenfield LJ, Herrmann JB. Free-floating iliofemoral thrombus. A risk of pulmonary embolism. Arch Surg. 1985;120(7):806–808. [DOI] [PubMed] [Google Scholar]
- 29.Shul’gina LE, Karpenko AA, Kulikov VP, Subbotin IG. Ultrasound criteria for embologenicity of venous thrombosis. Angiol Sosud Khir. 2005;11(1):43–51. [PubMed] [Google Scholar]
- 30.Tutwiler V, Singh J, Litvinov RI, Bassani JL, Purohit PK, Weisel JW. Rupture of blood clots: mechanics and pathophysiology. Sci Adv. 2020;6(35):eabc0496. [DOI] [PMC free article] [PubMed] [Google Scholar]
- 31.Lippi G, Favaloro EJ. Venous and arterial thromboses: two sides of the same coin? Semin Thromb Hemost. 2018;44(3):239–248. [DOI] [PubMed] [Google Scholar]
- 32.Poredoš P. Interrelationship between venous and arterial thrombosis. Int Angiol. 2017;36(4):295–298. [DOI] [PubMed] [Google Scholar]
- 33.Prandoni P, Bilora F, Marchiori A, et al. An association between atherosclerosis and venous thrombosis. N Engl J Med. 2003;348(15):1435–1441. [DOI] [PubMed] [Google Scholar]
- 34.Stalker TJ, Traxler EA, Wu J, et al. Hierarchical organization in the hemostatic response and its relationship to the platelet-signaling network. Blood. 2013;121(10):1875–1885. [DOI] [PMC free article] [PubMed] [Google Scholar]
- 35.Tutwiler V, Litvinov RI, Lozhkin AP, et al. Kinetics and mechanics of clot contraction are governed by the molecular and cellular composition of the blood. Blood. 2016;127(1):149–159. [DOI] [PMC free article] [PubMed] [Google Scholar]
- 36.Kim OV, Litvinov RI, Weisel JW, Alber MS. Structural basis for the nonlinear mechanics of fibrin networks under compression. Biomaterials. 2014;35(25):6739–6749. [DOI] [PMC free article] [PubMed] [Google Scholar]
- 37.Peshkova AD, Le Minh G, Tutwiler V, Andrianova IA, Weisel JW, Litvinov RI. Activated monocytes enhance platelet-driven contraction of blood clots via tissue factor expression. Sci Rep. 2017;7(1):5149. [DOI] [PMC free article] [PubMed] [Google Scholar]
- 38.Tutwiler V, Litvinov RI, Protopopova A, et al. Pathologically stiff erythrocytes impede contraction of blood clots. J Thromb Haemost. 2021;19(8):1990–2001. [DOI] [PMC free article] [PubMed] [Google Scholar]
- 39.Litvinov RI, Evtugina NG, Peshkova AD, et al. Altered platelet and coagulation function in moderate-to-severe COVID-19. Sci Rep. 2021;11(1):16290. [DOI] [PMC free article] [PubMed] [Google Scholar]
Associated Data
This section collects any data citations, data availability statements, or supplementary materials included in this article.


