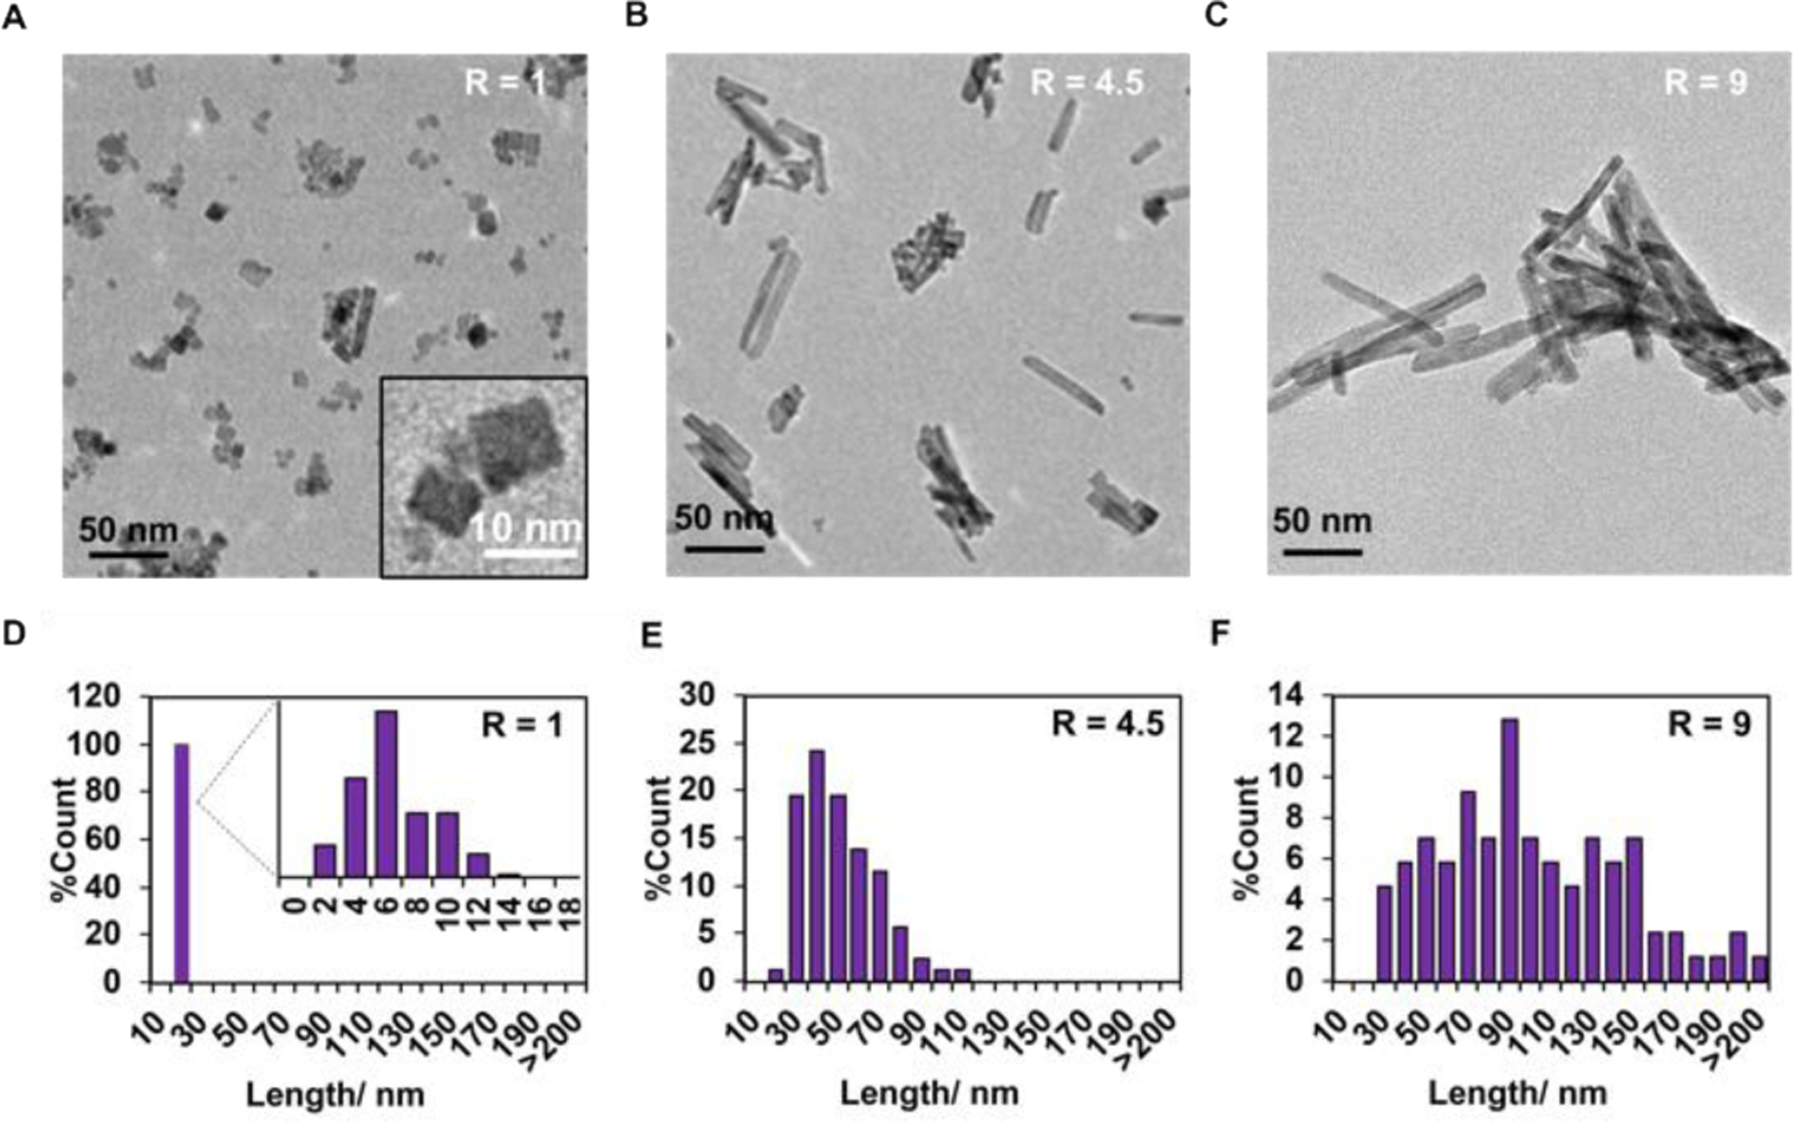
Fig. 1. TEM analysis of the CeO2-x nanorods with different R ratios.

(A-C) TEM images of CeO2-x nanorods with R ratios of A) R=1, B) R=4.5; and C) R=9. (D-F) Distributions of the lengths of the CeO2-x nanorods based on the TEM images.

(A-C) TEM images of CeO2-x nanorods with R ratios of A) R=1, B) R=4.5; and C) R=9. (D-F) Distributions of the lengths of the CeO2-x nanorods based on the TEM images.