
Figure 4.
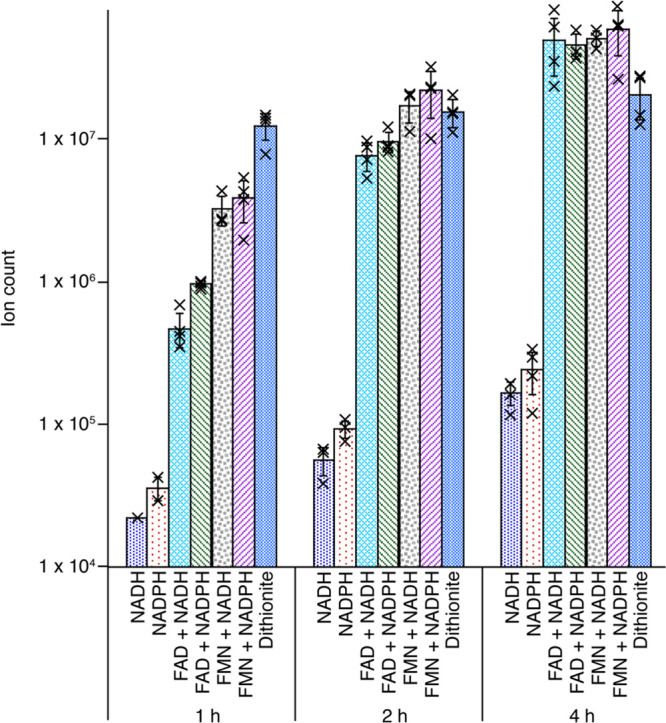
Time and reductant dependence of ScTYW1 activity. The reaction mixtures contained the indicated reducing systems. Samples were analyzed 1, 2, or 4 h after initiation of the reaction. The symbol X represents an individual data point, and the error bars represent one standard deviation from the mean. Note that the y-axis has a log scale.