

Abstract
Context:
There is a lack of comprehensive data regarding the factors that influence the diagnostic accuracy of multiparametric magnetic resonance imaging (mpMRI) to detect and localize clinically significant prostate cancer (csPCa).
Objective:
To systematically review the current literature assessing the factors influencing the variability of mpMRI performance in csPCa diagnosis.
Evidence acquisition:
A computerized bibliographic search of Medline/PubMed database was performed for all studies assessing magnetic field strength, use of an endorectal coil, assessment system used by radiologists and inter-reader variability, experience of radiologists and urologists, use of a contrast agent, and use of computer-aided diagnosis (CAD) tools in relation to mpMRI diagnostic accuracy.
Evidence synthesis:
A total of 77 articles were included. Both radiologists’ reading experience and urologists’/radiologists’ biopsy experience were the main factors that influenced diagnostic accuracy. Therefore, it is mandatory to indicate the experience of the interpreting radiologists and biopsy-performing urologists to support the reliability of the findings. The most recent Prostate Imaging Reporting and Data System (PI-RADS) guidelines are recommended for use as the main assessment system for csPCa, given the simplified and standardized approach as well as its particular added value for less experienced radiologists. Biparametric MRI had similar accuracy to mpMRI; however, biparametric MRI performed better with experienced readers. The limited data available suggest that the combination of CAD and radiologist readings may influence diagnostic accuracy positively.
Conclusions:
Multiple factors affect the accuracy of mpMRI and MRI-targeted biopsy to detect and localize csPCa. The high heterogeneity across the studies underlines the need to define the experience of radiologists and urologists, implement quality control, and adhere to the most recent PI-RADS assessment guidelines. Further research is needed to clarify which factors impact the accuracy of the MRI pathway and how.
Patient summary:
We systematically reported the factors influencing the accuracy of multiparametric magnetic resonance imaging (mpMRI) in detecting clinically significant prostate cancer (csPCa). These factors are significantly related to each other, with the experience of the radiologists being the dominating factor. In order to deliver the benefits of mpMRI to diagnose csPCa, it is necessary to develop expertise for both radiologists and urologists, implement quality control, and adhere to the most recent Prostate Imaging Reporting and Data System assessment guidelines.
Keywords: Prostate cancer; Diagnosis, Multiparametric magnetic resonance imaging; Magnetic resonance imaging; Targeted biopsy
1. Introduction
Over the last 10 yr, the diagnostic pathway of prostate cancer (PCa) has changed significantly by the advent of multiparametric magnetic resonance imaging (mpMRI) [1,2]. As shown by recently published randomized controlled trials, head-to-head comparisons, and a Cochrane meta-analysis [3-8], mpMRI is the best technique to detect and localize suspicious areas for clinically significant prostate cancer (csPCa), and it allows performing MRI-targeted biopsy (MRI-TBx) [9]. The value of mpMRI and MRI-TBx over systematic transrectal ultrasound (TRUS) biopsy is in reducing diagnoses of insignificant PCa and potentially avoiding unnecessary prostate biopsies in men with negative mpMRI scans. Detection and localization of csPCa are slightly but not significantly better with mpMRI than with TRUS biopsy.
Acquisition and interpretation of prostate mpMRI are evolving with ongoing improvements, which influence its accuracy. These include magnetic field strength, gradient strength, use of an endorectal coil (ERC) [10], different versions of assessment systems, reader experience and inter-reader variability, potential to avoid a contrast agent (ie, biparametric MRI [bpMRI]), and use of computer-aided diagnosis (CAD) and deep-learning tools. Another factor that influences the accuracy of the MRI pathway is the experience of operators performing MRI-TBx. These show a significant variation across reported series [4], affecting the risk of bias of the available data and preventing robust systematic analyses. Moreover, aiming at assessing the variation of mpMRI diagnostic accuracy, variability of biopsy protocols and histopathological reference standards, and heterogeneity of PCa prevalence among different cohorts with the consequent variation of the negative predictive value (NPV) of mpMRI make comparison of studies even more challenging [11].
Despite the large number of studies reporting the accuracy of mpMRI, there is a lack of comprehensive data that specifically address the difference of mpMRI execution and performance. Given the promising role of MRI in csPCa diagnosis, there is a need to systematically review the current literature regarding the factors that influence the variability of mpMRI in the diagnosis of csPCa.
2. Evidence acquisition
2.1. Objective
We aimed to systematically review the current literature assessing the factors influencing the variability of mpMRI performance in detecting csPCa. Magnetic field strength (1.5 vs 3.0 T, including importance of the gradient strength), use of an ERC, assessment system used by the radiologist, inter-reader variability, experience of the radiologists and urologists, use of bpMRI, and use of CAD or deep learning or machine learning for mpMRI assessment were considered potential influencing factors.
2.2. Search strategy
Data collection was conducted in accordance with the Preferred Reporting Items for Systematic Reviews and Meta-analyses (PRISMA) statement [12]. A computerized bibliographic search of Medline/PubMed database was searched from inception to June 23, 2019. The search terms used were (prostate cancer OR prostate adenocarcinoma) AND (MRI OR magnetic resonance) AND (coil OR endorectal coil OR surface coil OR magnetic field OR reporting system OR PI-RADS OR Likert OR inter-reader variability OR inter-reader agreement OR biparametric OR radiologist experience OR urologist experience OR learning curve OR CAD OR machine learning OR computer-aided OR artificial intelligence OR neural network).
2.3. Inclusion criteria
As recommended by the PRISMA guidelines, we used the population, intervention, comparator, and outcome (PICO) approach to define study eligibility [12]. Reports were considered relevant if they provided comparative data on the relationship between the aforementioned factors. The performance of mpMRI was defined as PCa detection at either prostate biopsy or after radical prostatectomy. Thus, studies assessing one of the factors without providing any comparison (eg, providing data regarding the accuracy of 1.5 T mpMRI or bpMRI alone) were not included in this review. Noncomparative studies, case reports, editorials, letters, review articles, and meeting abstracts were also not included.
2.4. Systematic review process
Two authors (A.S. and F.G.) independently reviewed a total of 2013 abstracts and selected 77 studies that were finally included in the systematic review for full-text evaluation. Fig. 1 shows the PRISMA flowchart describing the selection process.
Fig. 1 –
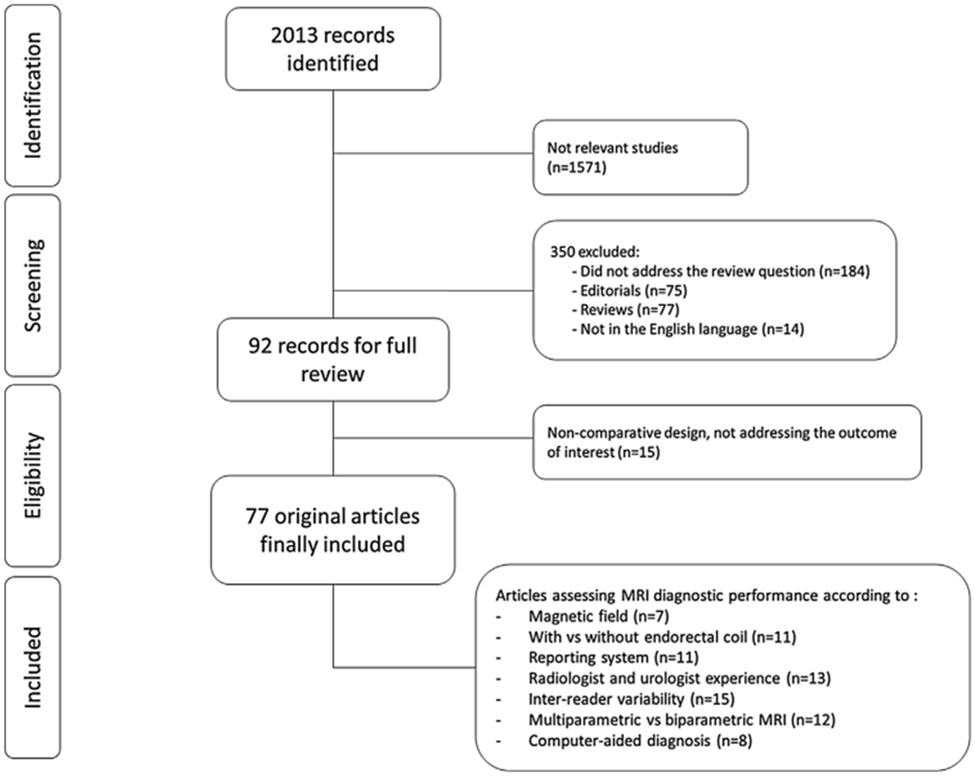
Preferred Reporting Items for Systematic Reviews and Meta-analysis flow diagram showing the outcome of the initial and additional searches resulting in the inclusion of full studies in the review. MRI = magnetic resonance imaging.
2.5. Data extraction
Data were independently extracted from all included studies by the same two authors. A standardized data extraction form was created a priori and used to collect data on the study design, number of participants, mpMRI protocol, radiologist experience, and outcome.
2.6. Data analysis
A comprehensive and narrative synthesis of included studies was performed, since a quantitative meta-analytic synthesis was not possible due to the heterogeneity of the studies.
2.7. Risk of bias assessment
The risk of bias and applicability concern in individual studies was assessed independently by the same two authors using the Quality Assessment of Diagnostic Accuracy Studies-2 (QUADAS-2) criteria [13]. The presence of baseline confounding factors or selection bias, as well as the presence of any bias within mpMRI protocols, mpMRI interpretation, biopsy protocol, and histopathological reference standard, was assessed (Fig. 2 and Supplementary Fig. 1).
Fig. 2 –

Overall summary of risk of bias and applicability concerns across studies based on QUADAS-2 criteria.. QUADAS-2 = Quality Assessment of Diagnostic Accuracy Studies-2.
3. Evidence synthesis
Overall, 2013 publications were found. If it was not clear from the abstract whether the paper might contain relevant data, the full paper was assessed. Seventy-seven articles were included in the final analysis (Fig. 1). Single studies are described in detail in Tables 1-4 and Supplementary Tables 1-3.
Table 1 –
List of studies comparing different mpMRI assessment systems.
| Author [ref] | Year | Study design | Number of patients |
Scoring systems used |
MRI protocol | Number of radiologists |
Definition of csPCa | Reference standard |
Key findings |
|---|---|---|---|---|---|---|---|---|---|
| Auer et al [34] | 2017 | Prospective (v1) and retrospective (v2.0) | 50 | PI-RADS v1 and v2 | T2-WI, DWI, and DCE | 2 | Low grade (Gleason score ≤3 + 4) vs high-grade (Gleason score ≥4 + 3) | Radical prostatectomy | • PI-RADS v1 detects tumor better than v2 (AUC: 0.96 vs 0.90) |
| • PZ lesions: PI-RADS v1 (AUC: 0.97) vs v2 (AUC: 0.92) | |||||||||
| • TZ lesions, PI-RADS v1 (AUC: 0.96) vs v2 (AUC: 0.90) | |||||||||
| • PI-RADS v2 resulted in significantly more false-negative results (3% vs 14%) and a similar true positive result (82% vs 80%) | |||||||||
| De Visschere et al [35] | 2016 | Retrospective | 245 | PI-RADS v1 and v2 | T2-WI, DWI, DCE, and MRSI | 1 | Gleason score ≥7 (including 3 + 4 with prominent but not predominant Gleason 4 component), and/or tumor volume of ≥0.5 cc, and/or tumor stage ≥ T3a | MRI-TBx | • PI-RADS v1 and v2 overall assessment scores were significantly higher (p < 0.001) in patients with csPCa |
| • ROC curve: 0.82 for PI-RADS v1 and 0.79 for PI-RADS v2.0 (p > 0.05) | |||||||||
| • Using a threshold of 3, sensitivity was 88.2% and 79.2% (p = 0.001) and specificity was 64.4% and 67.3% (p > 0.05) with PI-RADS v1 and v2, respectively | |||||||||
| Feng et al [37] | 2016 | Retrospective | 401 | PI-RADS v1 and v2 | T2-WI, DWI, and DCE | 1 | – | MRI-TBx | • AUC: 0.889 for PI-RADS v1 and 0.942 for PI-RADS v2 (p = 0.0001) pooling TZ and PZ together |
| • Higher sensitivity in the TZ (96% vs 76%, p = 0.003), similar specificity (90% vs 84%, p = 0.227), and higher accuracy (93% vs 81%, p = 0.002) for PI-RADS v2 | |||||||||
| Hoffmann et al [38] | 2018 | Prospective | 58 | PI-RADS v1 and v2 | T2-WI, DWI, and DCE | 2 | Epstein criteria (PSA density ≥0.15 ng/ml/g, Gleason score >3 + 3, presence of PCa in >3 cores with >50% involvement in any of the cores | Biopsy (n = 58) and radical prostatectomy (n = 29) | • Substantial agreement between radiologists (PI-RADS v.1: kappa 0.71; PI-RADS v.2: kappa 0.69) |
| Krishna et al [40] | 2017 | Retrospective | 47 | PI-RADS v1 and v2 | T2-WI, DWI, and DCE | 3 | Gleason score 3 + 4 with tumor foci ≥0.5 cm3 | Radical prostatectomy | • Higher sensitivity for PI-RADS v1 (p = 0.01 and 0.03, radiologists 1 and 2) |
| • Moderate interobserver agreement for PI-RADS v2 (k = 0.41) and slight to substantial agreement for PI-RADS v1 (T2-WI, k = 0.32; DWI, k = 0.52; DCE MRI, k = 0.13) | |||||||||
| Polanec et al [39] | 2016 | Retrospective | 65 | PI-RADS v1 and v2 | T2-WI, DWI, and DCE | 2 | – | MRI-TBx | • Almost perfect inter-reader agreement for PI-RADS v2 and v1 (k = 0.71 and k = 0.81, respectively). |
| • No difference in sensitivity between radiologists (p >0.05) | |||||||||
| • Higher specificity using PI-RADS v1 compared with PI-RADS v2 (radiologist 1: p = 0.0078, radiologist 2: p = 0.0313) | |||||||||
| Renard-Penna et al [41] | 2015 | Prospective | 118 (but only 50 for inter-reader agreement) | PI-RADS v1 and Likert | T2-WI, DWI, and DCE | 2 | Cancer core length ≥3 mm and/or Gleason score ≥4 | MRI-TBx | • Good levels of agreement for the Likert scale (k = 0.80) and summed PI-RADS (k = 0.73) scoring systems |
| • Good levels of agreement for PI-RADS T2-WI (k = 0.61) and DCE (k = 0.71), while only fair consistency (k = 0.53) for DWI | |||||||||
| Rosenkrantz et al [42,66] | 2013 | Retrospective | 70 | PI-RADS v1 and Likert | T2-WI, DWI, and DCE | 3 | Any tumor >3 mm in maximal diameter | Radical prostatectomy | • For tumors with Gleason score ≥7: |
| - Sensitivity was higher with PI-RADS than with Likert for radiologist 1 (88.6% vs 82.6%, p = 0.032) | |||||||||
| - Sensitivity was similar for radiologist 2 (78% vs 76%, p = 0.467) and radiologist 3 (77% vs 81%, p = 0.125). | |||||||||
| • In the TZ, accuracy was lower with PI-RADS than with Likert for radiologist 1 (70% vs 87%, p < 0.001), radiologist 2 (88% vs 93%, p = 0.002), and radiologist 3 (83% vs 91%, p < 0.001) | |||||||||
| Schaudinn et al [43] | 2019 | Retrospective | 40 | PI-RADS v1 and v2 | T2-WI, DWI, and DCE | 2 | – | Radical prostatectomy | • PI-RADS v2 showed a trend toward lower sensitivities for: |
| - Radiologist 1: 72% (v1) vs 64% (v2; p = 0.426) | |||||||||
| - Radiologist 2: 78% (v1) vs 69% (v2; p = 0.402) | |||||||||
| • Trends were more pronounced in the TZ (p = 0.313) and for low-grade PCa (p = 0.691) | |||||||||
| Tewes et al [44] | 2016 | Retrospective | 54 | PI-RADS v1 and v2 | T2-WI, DWI, and DCE | 2 | – | MRI-TBx | • Agreement between PI-RADS scores was good (reader 1: k = 0.62; reader 2: k = 0.64) |
| • Interobserver agreement was moderate with PI-RADS v2 (k = 0.56) and fair with v1 (k = 0.39) | |||||||||
| Wang et al [36] | 2018 | Prospective | 77 | PI-RADS v1 and v2.0 | T2-WI, DWI, and DCE | 2 | Gleason score ≥7 | MRI-TBx | • PI-RADS v2 exhibited a higher AUC (0.888) than PI-RADS v1 (0.869) |
| • PI-RADS v2 had higher sensitivity (75% vs 69%) but lower specificity (90% vs 96%) when than PI-RADS v1 for the assessment of PCa in the TZ |
AUC = area under the curve; csPCa = clinically significant prostate cancer; DCE = dynamic contrast-enhanced imaging; DWI = diffusion-weighted imaging; mpMRI = multiparametric MRI; MRI = magnetic resonance imaging; MRI-TBx = MRI targeted biopsy; MRSI = magnetic resonance spectroscopic imaging; PCa = prostate cancer; PI-RADS = Prostate Imaging Reporting and Data System; PZ = peripheral zone; ROC = receiver operating characteristics; T2-WI = T2-weighted imaging; TZ = transition zone.
Table 4 –
List of studies assessing the comparison between bpMRI and mpMRI.
| Author | Year | Study design | No. of patients |
MRI reporting | No. of readers (experience) |
Reference standard |
Outcome | Key findings |
|---|---|---|---|---|---|---|---|---|
| Stanzione et al [82] | 2016 | Retrospective | 82 | bpMRI then mpMRI with 20–30 d interval | 2 blinded (10 and 14 yr) | Mixed | Any PCa | • bpMRI and mpMRI showed similar performance for PCa detection with AUC 0.91 and 0.93, respectively (p > 0.05) |
| Thestrup et al [83] | 2016 | Retrospective | 204 | mpMRI then bpMRI with 2 mo interval | 2 blinded (experienced) | Mixed | csPCa defined as Gleason score ≥3 + 4 | • mpMRI: sensitivity 0.93–1.0, specificity 0.04–0.16, PPV 0.34–0.36, NPV 0.81–1.00 |
| • bpMRI: sensitivity 0.94–0.96, specificity 0.15, PPV 0.36, NPV 0.83–0.87 |
||||||||
| Lee et al [84] | 2017 | Retrospective | 123 | 55 and 68 men received mpMRI and bpMRI, respectively | 2 blinded (experienced) | Mixed | csPCa defined as Gleason score ≥3 + 4 | • No differences in PCa and csPCa detection rate (41.8% vs 30.9%, p = 0.208 and 82.6% vs 76.2%, p = 0.598) |
| • Similar detection of PCa among men who had suspicious lesions in the bpMRI and bpMRI groups (63.3% and 62.5%, respectively, p = 0.7) | ||||||||
| Kuhl et al [85] | 2017 | Retrospective | 542 | bpMRI then mpMRI in the same session | 4 blinded (2–9 yr) | Mixed | csPCa defined as Gleason score ≥3 + 4 | • bpMRI and mpMRI csPCa detection was 25.6% (mpMRI detected 1 additional case of csPCa) |
| • AUC was 89.1% and 87.2% for bpMRI and mpMRI, respectively | ||||||||
| • PPV was 73.8% vs 69.8% for bpMRI vs mpMRI | ||||||||
| Nieuwenhove et al [86] | 2019 | Retrospective | 90 | 1.5 T bpMRI then 3 T mpMRI after 1 mo | 2 blinded (2 and 10 yr) | TRUS-Bx plus MRI-TBx | csPCa defined as Gleason score ≥3 + 4 | • Compared with mpMRI, on the lesion-based analysis, bpMRI AUC 0.961 (p < 0.001), sensitivity 95%, specificity 97%, PPV 99%, NPV 89% |
| • On the patient-based analysis, bpMRI AUC 0.975, sensitivity 98%, specificity 97%, PPV 98%, NPV 97% |
||||||||
| Junker et al [87] | 2019 | Retrospective | 236 | bpMRI then mpMRI in the same session | 1 blinded (experienced) | Mixed | PCa defined as Gleason score ≥4 + 3 | • bpMRI did not show significant differences in diagnostic accuracy or tumor detection rates |
| • 94% of PCa were scored identically | ||||||||
| • Omitting DCE changed PI-RADS scores in 9.75% of patients, increasing the number of PI-RADS 3 scores by 8.89% when compared with mpMRI | ||||||||
| Sherrer et al [88] | 2019 | Retrospective | 344 | bpMRI then mpMRI in the same session | 1 blinded (NR) | TRUS-Bx plus MRI-TBx | Any PCa | • The majority of the lesions (552/648, 85%) were visible at bpMRI |
| • 15% of bpMRI-negative lesions were positive at DCE; of these 21% (3/14) harbored PCa | ||||||||
| De Visschere et al [89] | 2017 | Retrospective | 245 | mpMRI scored according to PI-RADS v2 and with PI-RADS v2Alt (only T2-WI and DWI) | NR | Mixed | csPCa defined as Gleason score ≥3 + 4 | • DCE was not needed for the determination of the overall assessment category in 80.8% (198/245) of patients |
| • AUC was 0.79 for both reporting methods | ||||||||
| Choi et al [90] | 2019 | Retrospective | 113 | bpMRI then mpMRI with 2 wk interval | 2 aware of presence of PCa (7 and 13 yr) | Radical prostatectomy | csPCa defined as Gleason score ≥3 + 4 or volume >0.5 cc | • No significant differences in csPCa detection between bpMRI and mpMRI |
| • Higher presence of csPCa in PI-RADS 3 lesions for bpMRI compared with mpMRI | ||||||||
| Scialpi et al [91] | 2017 | Retrospective | 41 | bpMRI then mpMRI in the same session | 2 aware of presence of PCa (experienced) | Radical prostatectomy | Any PCa | • For both bpMRI and mpMRI, sensitivity was similar, and was 100% in PZ and 97.6% and 94.7% in the entire prostate and TZ, respectively |
| • bpMRI detected 181 lesions out of 131 detected at final pathology, resulting in 27.6% false-positive and 3.3% false-negative rates | ||||||||
| • Agreement of bpMRI and mpMRI was identical | ||||||||
| Gatti et al [92] | 2019 | Retrospective | 68 | bpMRI then mpMRI with 1 mo interval | 3 groups of 2 readers (1000, 300, and 100 cases read) | Mixed | Any PCa | • Two expert readers performed as well in bpMRI as in mpMRI (sensitivity = 0.91–0.96, AUC = 0.86–0.93; p ≥ 0.10) |
| • Readers with 300 cases performed well in mpMRI, but significantly worse in bpMRI: sensitivity = 0.58 vs 0.91 (p < 0.0001) and AUC = 0.73 vs 0.86 (p = 0.01) | ||||||||
| Di Campli et al [93] | 2018 | Retrospective | 85 | bpMRI then mpMRI in separate sessions | 3 blinded (7, 3, and 1 yr) | Mixed | csPCa defined as Gleason score ≥3 + 4 | • There was no significant difference regarding the detection of csPCa among the three readers between bpMRI and mpMRI |
| • The AUC for bpMRI and mpMRI was 0.68–0.72 (high experience), 0.72–0.70 (medium experience), and 0.60–0.54 (low experience) |
AUC = area under the curve; bpMRI = biparametric MRI; csPCa = clinically significant prostate cancer; DCE = dynamic contrast-enhanced imaging; DWI = diffusion-weighted imaging; mpMRI = multiparametric MRI; MRI = magnetic resonance imaging; MRI-TBx = MRI targeted biopsy; NPV = negative predictive value; NR = not reported; PCa = prostate cancer; PI-RADS = Prostate Imaging Reporting and Data System; PPV = positive predictive value; PZ = peripheral zone; TRUS-Bx = transrectal ultrasound biopsy; T2-WI = T2-weighted imaging; TZ = transition zone.
3.1. Risk of bias within studies
The overall risk of bias and applicability concern is given in Fig. 2. The overall methodological quality of the studies was moderate, with 17 studies having a low risk of bias and applicability concern across all domains assessed. Supplementary Fig. 1 shows the risk of bias and applicability concerns for each study.
3.2. Magnetic field
Multiparametric MRI at 3.0 T has an increased signal-to-noise ratio compared with 1.5 T scanners, resulting in higher spatial resolution of T2-weighted (T2-WI) and diffusion-weighted (DWI) imaging.
In total, seven studies assessed the value of the magnetic field relating to mpMRI staging accuracy (Supplementary Table 1) [14-20]. Two studies from 2004 [15,18] were among the first reporting a comparison of 1.5 and 3.0 T scanners even though with slightly different results. Bloch et al [15] reported higher image quality at 3.0 T than at 1.5 T (both with an ERC), while Sosna et al [18] reported a comparable quality for nonendorectal 3.0 T and endorectal 1.5 T mpMRI in 40 men receiving mpMRI and subsequent biopsy. However, these studies are not comparable given that the ERC was not used at 3.0 T [18]. Most importantly, only two studies addressed DWI [19,20] and thus only these studies could evaluate the detection difference between insignificant PCa and csPCa, as for this DWI is the most important sequence in the peripheral zone (PZ). These studies showed a similar Prostate Imaging Reporting and Data System (PI-RADS) assessment for 1.5 and 3 T.
Overall, the majority of the studies did not investigate the detection of csPCa but instead focused on the recognition of any PCa. In this respect, both magnetic field strengths performed equally [14,17,19], but the small sample size and high heterogeneity of these studies make an objective comparison difficult to conduct. In summary, no reliable information could be obtained regarding the detection of csPCa according to field strength regardless of the usage of reception coils.
3.3. Reception coil
A total of 11 studies comparing the use of mpMRI with an external pelvic phased-array coil with or without an ERC were included (Supplementary Table 2) [21-31]. Four studies did not use DWI.
The use of an ERC significantly improves the signal-to-noise ratio irrespective of the magnetic field strength, providing T2-WI with higher spatial resolution and potentially more accurate delineation of the structures `in the transition zone (TZ), which is the key factor in the assessment of csPCa in this zone. However, the addition of an ERC is associated with increased costs, increased artifacts [32], organ deformation, and discomfort for patients. Mirak et al [28] investigated the performance of 3.0 T mpMRI with and without an ERC to detect PCa using PI-RADS v2 guidelines, with whole-mount histopathology as the reference standard. Two subcohorts, with (n = 260) and without (n = 169) an ERC, were analyzed. They concluded that detection rates for any PCa, for the index lesion, and for csPCa were similar in both cohorts, but there was a significantly lower detection rate of anterior and TZ csPCa in the ERC subcohort due to a signal drop in the anterior gland when the ERC was used without an accompanying abdominal phased array coil.
Another study with a direct comparison of ERC versus non-ERC at 3.0 T [22] showed no differences in detecting PCa using PI-RADS v2 guidelines.
Costa et al [26] reported that using an ERC at 3.0 T provides superior sensitivity (78%) for PCa detection when compared with standard and augmented protocols (ie, those with twice as many signal averages; 43% and 60%, respectively) without an ERC.
Turkbey et al [23] compared the utility of T2-WI and DWI at 3.0 T with and without an ERC in detecting PCa in 20 men receiving mpMRI before radical prostatectomy. The authors demonstrated higher sensitivity when using an ERC. The sensitivity and positive predictive value (PPV) of an ERC versus non-ERC MRI were 76% versus 45% and 80% versus 64%, respectively.
Torricelli et al [30] reported that the image quality at 1.5 T with an ERC is superior to that at 3.0 T without an ERC in evaluating tumor conspicuity, capsular infiltration, and seminal vesicle involvement. No significant differences between the two techniques for the involvement of apex and neurovascular bundles and comparable performance for the diagnosis of capsular involvement were observed. The authors concluded that during preoperative PCa staging, 3.0 T mpMRI can provide diagnostic information comparable with that of 1.5 T mpMRI with an ERC.
In summary, the use of an ERC improves signal reception, which slightly improved sensitivity to visualize any PCa. Only one study addressed the value of the ERC with respect to the PI-RADS assessment of csPCa [28]. This study showed a minor disadvantage of the ERC in detecting anterior TZ PCa. Owing to the lack of significant evidence that the ERC improves csPCa assessment, associated increased costs, duration of examination, and patient discomfort, the PI-RADS v2.1 guidelines [33] recommend the ERC to be used only for older 1.5 T scanners with lower gradient strength [30]. Still, the lack of standardized protocols in the available studies makes robust comparisons hard to assess.
3.4. Assessment system
The development of a simple, structured, standardized assessment system was one of the most considerable challenges in prostate mpMRI. Assessment systems have been refined during the years in order to increase the inter-reader agreement, decrease the gap between differently skilled radiologists, and improve communication between radiologists and urologists. Ten studies comparing the use of different assessment systems were included (Table 1) [34-44]. The majority compared PI-RADS v1 [45] and v2 [33]. Differently from PI-RADS v1, PI-RADS v2 defined dominant sequences (T2-WI for the TZ and DWI for the PZ) and decreased the role of dynamic contrast-enhanced (DCE) MRI [46].
Most studies reported a similar diagnostic accuracy for both PI-RADS v1 and PI-RADS v2. However, three studies [36,37,39] showed higher sensitivity of PI-RADS v2 for TZ lesions, and another study by Krishna et al [40] showed that PI-RADS v1 detected approximately 10% more tumors than PI-RADS v2.
De Visschere et al [35] compared the performance of PI-RADS v2 and v1 in 245 biopsy-naïve men with an elevated level of prostate-specific antigen (PSA). They found that PI-RADS v1 and v2 yielded similar accuracy for the detection of csPCa. However, PI-RADS v2 had lower sensitivity than PI-RADS v1 when a score of 3 was used as a threshold for positive mpMRI. The authors suggested that the majority of discrepancies were caused by a suspicious lesion in the PZ on T2-WI but with normal DWI, scored positive with PI-RADS v1 but negative with PI-RADS v2. Indeed, sensitivity of PI-RADS v2 might be less when suspicious lesions on T2-WI but negative on DWI are present in the PZ. Nonetheless, the authors concluded that PI-RADS v2 is preferable because of the more structured and standardized, and simpler approach. Similar results were found by Krishna et al [40] who compared the two assessment systems for the detection of csPCa lesions in 47 men before radical prostatectomy. They found no difference in the overall detection of csPCa but observed higher sensitivity of PI-RADS v1 on T2-WI and DCE.
Feng et al [37] compared PI-RADS v1 and v2 in 401 consecutive biopsy-naïve men with a clinical suspicion of PCa at 3.0 T mpMRI. Both assessment systems had a good diagnostic performance for the detection of csPCa, but the diagnostic accuracy increased from 0.82 to 0.88 with the use of PI-RADS v2 compared with PI-RADS v1 when non–biopsy-naïve men were also included. Interestingly, PI-RADS v2 had a better performance in the TZ (0.92 vs 0.81).
Hoffmann et al [38] evaluated in 58 men whether PI-RADS v2 was more accurate in assessing anterior prostate csPCa than PI-RADS v1. PI-RADS v2 did not improve the accuracy for diagnosing anterior csPCa when compared with PI-RADS v1; however, PI-RADS v2 was more reproducible between radiologists.
Schaudinn et al [43] reported moderate interobserver reliability (k = 0.48) for PCa detection of two radiologists in 40 men before radical prostatectomy, and similar results have been reported by Tewes et al [44], with moderate interobserver agreement (k = 0.56) for PI-RADS v2 and fair agreement (k = 0.39) for PI-RADS v1. The authors concluded that PI-RADS v2 had equivalent diagnostic accuracy to PI-RADS v1 for PCa detection, but with shorter interpretation time for PI-RADS v2.
Two studies compared PI-RADS v1 and two different Likert assessment systems [41,42]. Both showed good inter-reader agreement, although one study reported higher accuracy of the Likert scale for TZ lesions than PI-RADS v1 [42].
In summary, it is recommended to use the most recent PI-RADS guidelines as the main assessment system given the simplified, objective, and standardized approach as well as its particular added value for less experienced radiologists.
3.5. Radiologist and urologist experience
The use of mpMRI to detect csPCa represents a multidisciplinary approach that includes skills both in acquisition and interpretation of mpMRI and in performing MRI-TBx.
Five studies assessed the impact of reader experience on mpMRI diagnostic performance (Table 2). Akin et al [47] and Garcia-Reyes et al [48] were the first to test the learning curve in prostate mpMRI reporting using whole-mount pathology as a reference standard. They showed that a dedicated training curriculum is useful to improve mpMRI interpretation. Rosenkrantz et al [49] assessed the variation of mpMRI diagnostic accuracy in detecting and localizing csPCa among six 2nd-year radiology residents reporting 124 prostate mpMRI scans (both negative and positive). Three out of six readers (50%) received feedback after each examination showing the solution of the preceding case. For readers both with and without feedback, there was an initial rapid improvement, which slowed down after 40 examinations. In the group receiving feedback, accuracy, sensitivity, and specificity improved from 58%, 59%, and 56% to 72–77%, 72–77%, and 74–82%, respectively. Interestingly, the presence of feedback did not significantly affect the accuracy as compared with the group without feedback, showing the effects of self-directed learning, even though readers with feedback felt more confident. Moreover, the feedback was more useful for TZ lesions, suggesting a higher challenge in detecting these tumors, in line with previous studies [47,48]. Pickersgill et al [50] conducted a retrospective review of 459 men receiving mpMRI according to PI-RADS (v1 implemented with v2 during the study period) and a subsequent MRI-TBx if necessary. They showed that the radiologist’s experience did not improve the accuracy in csPCa detection. The authors speculated that the use of PI-RADS might have attenuated the impact of the reader’s experience. However, this study had serious limitations, such as the implementation of PI-RADS v1 to v2 during the study period and an arbitrary definition of radiologist experience (ie, >500 mpMRI examinations). Following the widespread use of mpMRI and the need for dedicated training for radiologists, an online interactive case-based website for prostate mpMRI interpretation using PI-RADS v2 has been proposed [51]. This training course increased the sensitivity (from 58% to 73%, p = 0.003) and the NPV (from 69% to 78%, p = 0.049) of three 2nd-year radiology residents who evaluated separate sets of 60 MR scans before and after the course. Interestingly, there were no significant improvements in the accuracy of the PI-RADS assessment scores (from 46% to 53%, p = 0.149) [51].
Table 2 –
List of studies assessing the relationship between mpMRI performance and radiologist and urologist experience.
| Author | Year | Study design | Trainee | Training | No. of patients | Learning curve definition | Definition of csPCa |
Key findings |
|---|---|---|---|---|---|---|---|---|
| Akin et al [47] | 2010 | Prospective | 11 radiology fellows | • Baseline: 15 MRI scans • 5 interactive lectures • 200 MRI scans over 10 wk |
– | Accuracy in identifying peripheral and transitional tumors and ECE | – | • Peripheral PCa: AUC increased from 0.52 to 0.66 (p < 0.001) after the interactive course and then remained stable |
| • Transitional PCa: AUC increased from 0.49 to 0.64 (p = 0.01) after the interactive courses and up to 0.68 (p = 0.001) at the end of training | ||||||||
| • ECE: AUC increased from 0.50 to 0.81 (p < 0.0001) | ||||||||
| Garcia-Reyes et al [48] | 2015 | Retrospective | 5 radiology fellows | 31 MRI scans reinterpreted after 5 yr of dedicated education program | – | Accuracy and confidence in identifying overall and anterior PCa | Gleason score ≥3 + 4 | • Index PCa detection: from 74.2% to 87.7% (p = 0.003) |
| • Confidence: from 3.75 to 4.22 (scale 1–5) | ||||||||
| • Anterior PCa detection: from 54.3% to 94.3% (p = 0.001) | ||||||||
| Rosenkrantz et al [49] | 2017 | Prospective | 6 2nd-year radiology residents | 124 MRI scans using PI-RADS v1 score. Readers divided between with and without feedback | – | Progressive accuracy, sensitivity, specificity, PPV, and NPV | Gleason score ≥3 + 4 | • Initial rapid improvement in AUC that slowed after 40 examinations |
| • AUC and sensitivity improved from 58% and 56% up to 77% and 82%, respectively, in the group with feedback. | ||||||||
| • Feedback did not affect the accuracy improvement significantly | ||||||||
| • Feedback resulted to be more useful for transitional zone PCa | ||||||||
| Pickersgill et al [50] | 2019 | Retrospective | 9 radiologists with 2–11 yr of experience | – | 459 men receiving MRI for suspicion of PCa | Sensitivity, specificity, PPV, and NPV | Gleason score ≥3 + 4 | • Radiologist experience (>500 scans) was associated with decreased sensitivity and NPV |
| Rosenkrantz et al [51] | 2019 | Prospective | 3 2nd-year radiology residents | Two separate sets of 60 MRI scans reported before and after an online course using PI-RADS v2 | – | Accuracy, sensitivity, specificity, PPV, and NPV | Gleason score ≥3 + 4 | • Online course significantly improved sensitivity (from 57.8% to 73.3%, p = 0.003) and NPV (from 69.2% to 78.2%, p = 0.049) |
| • No increase for specificity and PPV | ||||||||
| • Accuracy of single PI-RADS score assignment did not improve | ||||||||
| Gaziev et al [55] | 2016 | Retrospective | 3 urologists experienced in standard biopsy, naïve for MRI-TBx | – | 340 men undergoing MRI-TBx | MRI-TBx PCa detection across the entire cohort divided into five subcohorts timely consecutive | Gleason score ≥3 + 4 | • Increase in MRI-TBx PCa detection (from 27%to 63%) between the first and last 70 men |
| • Improvement in MRI NPV (up to 89% in the most recent cohort) | ||||||||
| Calio et al [56] | 2017 | Retrospective | – | – | 1528 biopsy-naïve men undergoing MRI-TBx | MRI-TBx csPCa detection across the entire cohort divided into 3 subcohorts timely consecutive over 9 yr | Gleason score ≥3 + 4 | • 13% increase in csPCa detection rate by MRI-TBx over the study period |
| • csPCa detection rate at MRI-TBX increased even after multivariate adjustment | ||||||||
| Meng et al [57] | 2018 | Retrospective | 4 urologists experienced in standard biopsy | – | 1595 men with previous negative biopsy undergoing MRI-TBx | MRI-TBx csPCa detection over the study period and at repeat MRI-TBx | Gleason score ≥3 + 4 | • csPCa detection increased 26% with time in men with a PI-RADS 4/5 region of interest |
| • On repeat MRI-TBx, 53% of those with PI-RADS 4–5 demonstrated csPCa discordance compared with previous biopsy | ||||||||
| Mager et al [58] | 2017 | Retrospective | 1 1st-year resident naïve for MRI-TBx | – | 84 consecutive MRI-TBx | MRI-TBx quotient and biopsy time | – | • Significant improvement in both detection quotient and biopsy time after 42 procedures, flattening after 63 biopsies |
| Kasabwala et al [59] | 2018 | Retrospective | – | – | 173 consecutive MRI-TBx | MRI-TBx accuracy defined as distance between planned and actual core trajectories stored on MRI-TBx fusion software | – | • Significant improvement in targeted biopsy accuracy occurred in up to 98 cases (p < 0.01) |
| Halstuch et al [60] | 2019 | Retrospective | Urologists naïve for MRI-TBx | – | 779 men undergoing either transrectal (523) or transperineal (256) MRI-TBx | Urologist experience was coded at the total number of MRI-TBx before each procedure | Gleason score ≥3 + 4 | • 104 transrectal MRI-TBx and 119 transperineal MRI-TBx are at least necessary to reach the best PCa detection |
| • 109 transrectal MRI-TBx and 124 transperineal MRI-TBx are at least necessary to reach the minimum biopsy time | ||||||||
| Stabile et al [61] | 2018 | Retrospective | 3 urologists experienced in standard biopsy, naïve for MRI-TBx | – | 244 men undergoing MRI-TBx | Urologist experience was coded at the total number of MRI-TBx before each procedure | Gleason score ≥3 + 4 | • Urologist experience was associated with better csPCa detection after multivariate adjustment |
| • Significant increase in csPCa detection during the first 60 procedures and a flattening after 80 procedures | ||||||||
| • Transperineal MRI-TBx was less affected by urologist experience achieving good csPCa detection since the first procedures | ||||||||
| Westhoff et al [62] | 2019 | Retrospective | 22 urologists (9 senior; 13 resident) | – | 210 consecutive MRI-TBx | Urologist experience was coded at the total number of MRI-TBx before each procedure | Gleason score ≥3 + 4 | • 8 MRI-TBx as the necessary threshold for experience |
| • PCa detection rates for low and high experienced (according to the threshold) were 23% and 49%, respectively (p < 0.001) |
AUC = area under the curve; csPCa = clinically significant prostate cancer; ECE = extracapsular extension; MRI = magnetic resonance imaging; MRI-TBx = MRI-targeted biopsy; NPV=negative predictive value; PCa = prostate cancer; PI-RADS = Prostate Imaging Reporting and Data System; PPV = positive predictive value.
The quality of MRI-TBx performance plays an equally important role in defining the final diagnostic accuracy of this technique. Similar to systematic ultrasound-guided biopsy [52,53], the experience of the biopsy operator influences significantly the outcome of an MRI-TBx, which can be visual/cognitive, MR-ultrasound fusion, or direct MRI-TBx [54], using either a transrectal or a transperineal approach.
A total of eight studies assessing the learning curve of MRI-TBx were included (Table 2). Gaziev et al [55] demonstrated a significant gradual increase in csPCa detection (from 27% to 63%) in 70 men receiving fusion MRI-TBx. Similarly, Calio et al [56] reported data from three consecutive cohorts of biopsy-naïve men receiving MRI-TBx over a study period of 9 yr. There was a 13% increase in csPCa detection by MRI-TBx from the early to the most recent cohort. Meng et al [57] reported a 26% increase in csPCa detection in 1500 men receiving repeat biopsy. Mager et al [58] attempted in demonstrating the presence of the learning curve effect proposing the MRI-TBx quotient, defined as the ratio between the number of positive targeted cores and the total number of targeted cores. The authors showed a significant learning process, in both detection-quotient and biopsy times; for a novice performer, sufficient learning occurred after 42 procedures, reaching a flattening after 63 biopsies. Kasabwala et al [59] calculated the distance between the planned and the actual core route in the prostatic tissue during a fusion MRI-TBx, and demonstrated a significant improvement in MRI-TBx accuracy after 98 cases. Halstuch et al [60] attempted to identify a minimum number of procedures to reach the best PCa detection using a mathematical algorithm. The authors demonstrated that at least 104 transrectal fusion MRI-TBx and 119 transperineal fusion MRI-TBx are necessary for men with visible PI-RADS 3 lesions, before reaching the plateau phase of csPCa detection. In this context, Stabile et al [61] demonstrated the presence of a learning curve affecting csPCa detection rate even when accounting for several confounders (such as PSA, prostate volume, and PI-RADS score) for both visual and fusion MRI-TBx. The authors showed a steep increase in csPCa detection during the first 60 procedures and a flattening after 80 procedures. Interestingly, it was suggested that the transperineal approach might be less affected by the learning curve effect; hence, it might be easier compared with the transrectal approach when considering MRI-TBx [61]. Finally, Westhoff et al [62] proposed at least eight procedures as experience threshold. However, this result should be interpreted cautiously, considering the limited number of MRI-TBx performed by each of the 22 urologists included in this study.
In summary, when assessing the performance of mpMRI in detecting csPCa, it is nowadays mandatory to indicate the experience of the interpreting radiologists and biopsy-performing urologists to support the reliability of the findings. Less experienced readers and biopsy operators must always be supervised by experienced readers and operators. Moreover, mpMRI performance should be validated internally before widespread adoption. According to Rosenkrantz et al [49], radiologists should have reported at least 100 expert-supervised prostate mpMRI examinations after a dedicated training course, and urologists should have performed between 60 and 100 MRI-TBx before they potentially reach an acceptable level of csPCa detection. Most importantly, additional quality assurance tests are needed. Indeed, mpMRI should be performed only in large-volume centers with validated reading assessment [11]. Further development of quality criteria, quality assessment, and training platforms/courses is needed.
3.6. Inter-reader variability
Although reader experience plays a substantial role in determining mpMRI accuracy, the reporting process is affected by almost inevitable variability among different radiologists, which varies across different studies and centers. Fifteen studies were included for this topic (Table 3).
Table 3 –
List of studies assessing the inter-reader variability of mpMRI.
| Author | Year | Study design | Reporting system |
No. of MRI/lesions reported |
No. of readers | Reader’s experience |
Definition of csPCa |
Key findings |
|---|---|---|---|---|---|---|---|---|
| Quentin et al [63] | 2012 | Retrospective, single institute | Likert | 108 predefined lesions | 3 blinded | ≥3 yr | – | • Agreement of T2-weighted images, DWI, and DCE k was 0.49, 0.97, and 0.77, respectively |
| • PPV range 71–88% (k = 0.48) | ||||||||
| • AUC range 88–96% (k = 0.90) | ||||||||
| Schimmöller et al [65] | 2013 | Retrospective, single institute | PI-RADS v1 | 164 premarked lesions in 67 MRI | 3 blinded | 4, 3, and 2 yr | – | • Agreement for all lesions was good to moderate (T2-W1, k = 0.55; DWI, k = 0.64; DCE MRI, k = 0.65) |
| • For malignant lesions agreement was better than for benign lesions | ||||||||
| Rosenkrantz et al [42,66] | 2013 | Retrospective, single institute | Likert and PI-RADS v1 | 55 MRI | 3 blinded | 2 experienced readers and one inexperienced | Gleason score ≥3 + 4 | • Overall agreement between experienced readers was strong and for both the PI-RADS and the Likert scale |
| • Overall agreement between experienced and inexperienced readers was moderate to poor | ||||||||
| • Agreement in the PZ was better for Likert than for PI-RADS | ||||||||
| Rosenkrantz et al [71] | 2016 | Retrospective, multi-institute | PI-RADS v2 | Two sessions of 40 and 80 MRI with intersession training in between | 6 blinded | 6 experienced | Gleason score ≥3 + 4 | • No substantial difference was observed in the inter-reader agreement between sessions |
| • Agreement for PI-RADS ≥4 was 0.593 in PZ and 0.509 in TZ |
||||||||
| • Agreement of PZ and TZ for PI-RADS ≥3 was 81.9% and 76.4%, respectively | ||||||||
| • Overall agreement for PI-RADS ≥3 and ≥4 was 79.2% and 77.8%, respectively | ||||||||
| Mussi et al [67] | 2019 | Retrospective, single institute | PI-RADS v2 | 160 premarked lesions for 160 MRI single slides | 8 blinded | Between 100 and >2000 MRI reported | Gleason score ≥3 + 4 | • Coefficient of concordance according to categories was 0.71 considering both zones, 0.72 for PZ and 0.44 for TZ |
| • Agreement for PI-RADS ≥3 was 0.48 in PZ and 0.57 in TZ | ||||||||
| Glazer et al [68] | 2017 | Retrospective, single institute | PI-RADS v2 | 59 patients with a single lesion each | 3 blinded | 1, 4, and 11 yr | Gleason score ≥3 + 4 | • Overall suspicion score agreement was moderate (k = 0.45) |
| • There was moderate agreement among overall PI-RADS scores in the PZ (k = 0.46) and fair agreement in the TZ (k = 0.36) | ||||||||
| Girometti et al [69] | 2019 | Retrospective | PI-RADS v2 | 48 preoperative MRI | 3 unblinded; readers aware of the presence of PCa | 2, 6, and 8 yr | Gleason score ≥3 + 4 | • Moderate agreement in assigning PI-RADS categories to all PCa (k = 0.53) and csPCa (k = 0.47) |
| • Assessing csPCa with PI-RADS ≥4 had higher agreement than PI-RADS ≥3 (k = 0.63 vs k = 0.57) | ||||||||
| • Agreement was higher between more experienced readers | ||||||||
| Müller et al [70] | 2018 | Retrospective, two institutions | PI-RADS v1 and v2 | 126 men with positive MRI received second MRI | NR | NR | Gleason score ≥3 + 4 | • Poor level of agreement between the two MRI scans and a statistically significant difference in PI-RADS scores |
| Smith et al [72] | 2019 | Retrospective, multi-institute | PI-RADS v2 | 102 MRI read twice with wash-out period in between | 4 blinded | Moderate and high experience | Gleason score ≥3 + 4 | • Overall intrareader reproducibility was moderate to substantial (k = 0.43–0.67) |
| • Overall inter-reader reproducibility was poor to moderate (k = 0.24) | ||||||||
| • Readers with more experience showed greater inter-reader reproducibility | ||||||||
| Hansen et al [73] | 2017 | Retrospective, multi-institute | Likert | 158 MRI | 28 blinded | NR for referring readers; second readers >1000 MRI reported | Gleason score ≥3 + 4 | • Overall disagreement was 54% (86/158 MRI scans) |
| • MRI scans were more often called negative by expert readers (41% vs 20%) | ||||||||
| • Second readings of MRI by expert readers significantly improved NPV and PPV | ||||||||
| Sonn et al [78] | 2019 | Retrospective, single institute | PI-RADS v1 and v2 | 409 MRI | 9 blinded | Median 6 yr (range 1–25) | Gleason score ≥3 + 4 | • csPCa detection rate was 3–27% for PI-RADS 3 lesions, 23–65% for PI-RADS 4, and 40–80% for PI-RADS 5 across radiologists |
| • 13–60% of men with a PI-RADS <3 lesion harbored csPCa | ||||||||
| • AUC varied from 0.69 to 0.81 across readers | ||||||||
| Greer et al [74] | 2019 | Retrospective, multi-institute | PI-RADS v2 | 163 MRI | 9 blinded | 3 high level (<2000 last 2 yr) 3 moderate (500–2000 last 2 yr) | Gleason score ≥3 + 4 | • Sensitivity for index lesions was 80.9%, comparable across reader experience • Highly experienced readers had 84.0% specificity versus 55.2% for all others (p < 0.001) |
| 3 low (<500 last 2 yr) | • Inter-reader agreement was excellent for detecting index lesions (k = 0.87) | |||||||
| • Agreement on PI-RADS v2 category assignment of index lesions was moderate (k = 0.419) | ||||||||
| Ke et al [75] | 2018 | Retrospective, single institute | PI-RADS v2 | 183 MRI | 6 blinded | 6 mo and 2, 3, 4, 5, or 17 yr | – | • Inter-reader agreement was weak to moderate (k = 0.506) |
| • AUC varied between 0.88 and 0.95 | ||||||||
| Purysko et al [76] | 2017 | Retrospective, single institute | PI-RADS v2 | 170 MRI with premarked lesions | 2 blinded | 7 yr | Gleason score ≥3 + 4 | • AUC for readers 1 and 2 were 0.871 and 0.882, respectively |
| • AUCs were greater for PZ | ||||||||
| • Agreement was good overall (k = 0.63) and fair for TZ lesions (k = 0.53) for PI-RADS ≥3 | ||||||||
| • Agreement was excellent for PI-RADS ≥4 | ||||||||
| Pickersgill et al [77] | 2018 | Retrospective, single institute | PI-RADS v2 | 32 MRI | 4 blinded | 0–548 MRI reported | Gleason score ≥3 + 4 | • For PI-RADS ≥3, AUC for csPCa ranged between 47% and 75% (p < 0.001) |
| • Team readings did not improve AUC |
AUC = area under the curve; csPCa = clinically significant prostate cancer; DCE = dynamic contrast-enhanced imaging; DWI = diffusion-weighted imaging; MRI = magnetic resonance imaging; NPV = negative predictive value; NR = not reported; PCa = prostate cancer; PI-RADS = Prostate Imaging Reporting and Data System; PPV = positive predictive value; PZ = peripheral zone; T2-WI = T2-weighted imaging; TZ = transition zone.
Quentin et al [63] assessed the inter-reader agreement of mpMRI using a five-point (Likert) scale [64]. The authors showed high inter-reader reliability (PPV: 88–96%; k = 0.90) between three blinded radiologists scoring 108 lesions. After the introduction of PI-RADS v1 guidelines, Schimmöller et al [65] reported the agreement of three experienced radiologists scoring 164 premarked lesions. The overall agreement was good to moderate and higher for malignant than for benign lesions. Nonetheless, the clinical application of PI-RADS was still premature, and a diagnostic cutoff had not yet been proposed. Rosenkrantz et al [66] published a series of 55 patients undergoing prostate mpMRI in a single institution who were retrospectively reviewed by three radiologists (two moderately experienced and one inexperienced) using both PI-RADS v1 and Likert scores. For both assessment methods, the agreement was strong between the two experienced readers but poor when compared with the inexperienced reader. Interestingly, the Likert assessment scale had better inter-reader reproducibility than PI-RADS score in the TZ. This was probably due to the greater experience of the readers with their “own” Likert assessment. Since the widespread use of PI-RADS assessment score and the introduction of PI-RADS v2, few studies have assessed its reproducibility, with conflicting results. Mussi et al [67] reported moderate to good agreement between eight radiologists with different levels of experience in using PI-RADS v2. However, this study is hardly applicable to clinical practice since each reader evaluated only one MR slice containing a single specified lesion. Similarly, Glazer et al [68] conducted a retrospective study with three radiologists (with different levels of experience, ranging from 1 to 11 yr) who scored preselected lesions, with moderate agreement for PZ (k = 0.46) and fair agreement for TZ (k = 0.36). Moreover, the authors disclosed that PI-RADS v2 had been introduced recently in their clinical practice, potentially influencing the level of reproducibility. Girometti et al [69] supported the higher level of agreement among experienced radiologists in a monocentric study including three radiologists analyzing 48 MRI scans, with moderate agreement for PI-RADS cutoffs of both ≥3 (k = 0.57) and ≥4 (k = 0.63). Nonetheless, the readers were aware of the preoperative reason of mpMRI and hence of the presence of csPCa. Müller et al [70] reported a poor level of agreement in a cohort of 126 men receiving two consecutive MRI scans at two different institutions. Nonetheless, the design of this study was not devoid of many limitations and a significant bias. In fact, among 292 patients referred to the first institution, 126 men had mpMRI lesions considered challenging to be reliably accessed by systematic or cognitive biopsy. Since equipment for MRI-TBx with fusion technique was not available in the first institution, these men were referred to a second institution where they received a second mpMRI scan before undergoing an MRI-targeted fusion biopsy. In addition, all readers and authors had limited experience and training in reading prostate MRI according to PI-RADS. Moreover, no information regarding the used PI-RADS version was provided. For these reasons, these results should be considered very cautiously. Rosenkrantz et al [71] carried out a multicenter study with six experienced radiologists reporting at two different time points (40 and 80 MRI scans per session) and receiving a training session in between. The authors reported moderate reproducibility of PI-RADS v2, suggesting no benefit from the training session [71]. However, this study was limited by suboptimal image quality in a number of the included centers. Smith et al [72] provided results regarding intra- and inter-reader agreement with a multicenter study on four differently experienced readers. Overall, intrareader agreement was moderate to substantial (60–77% of agreement across different radiologists). Inter-reader agreement was poor to moderate and higher for more experienced radiologists. Hansen et al [73] reported the value of a second opinion by a subspecialized tertiary care center in reviewing mpMRI from seven different regional hospitals. Overall disagreement was 54% (86/158 MRI scans). Specifically, the second reading had significantly improved NPV (0.89 vs 0.72) and PPV (0.61 vs 0.28). Greer et al [74] reported excellent agreement on index lesion identification (k = 0.87) and moderate agreement on individual PI-RADS v2 category assignment (k = 0.419). Other two well-designed studies [75,76] reported similar results, with an area under the curve (AUC) for PCa ranging between 0.88 and 0.95 among six blinded readers [75]. Conversely, two recent studies showed high variability in PI-RADS v2 reporting [77,78]. In particular, Sonn et al [78], in a retrospective study of real-life mpMRI reporting by taking into account nine radiologists and 409 patients, while reporting a low variation in the number of lesions identified, demonstrated high variability in PI-RADS distribution and csPCa detection. The AUC for csPCa ranged between 0.61 and 0.81 [78]. Finally, van der Leest et al [79], in their prospective multicenter head-to-head comparison study, showed high inter-reader agreement of the participating expert radiologists. This was obtained after similar training to that described in the study of Rosenkrantz et al [49].
In summary, most of the well-designed dedicated studies reported moderate agreement when PI-RADS v2 is taken into consideration. Furthermore, the radiologist’s experience is crucial to increase mpMRI reproducibility, with the major concerns related to the variability in csPCa yield and high false-positive rates. Heterogeneity across the studies is still high. Most of the studies on this topic did not provide results about MRI acquisition, reader experience, or training. There is thus still a need for standardized mpMRI-assessment training protocols that should be available widely, in order to improve the general performance of mpMRI and provide more reliable data in this context. Only Rosenkrantz et al [49] and van der Leest et al [79] describe that radiologists should have reported at least 100 expert-supervised prostate mpMRI examinations after a dedicated training course. Further standardization of assessment systems, education, and certification will likely help in reducing the subjectivity and improving the reproducibility among less experienced readers as well.
3.7. Biparametric MRI versus mpMRI
Since the introduction of a standardized reporting system for mpMRI [45], the role of DCE MRI has been controversial. Indeed, PI-RADS v2 downgraded the role of DCE MRI to an additional sequence only for upgrading a PI-RADS 3 to 4 PZ lesion on DWI [33]. In the light of the increasing use of mpMRI in the assessment of csPCa and the need for more optimized and efficient protocols, the use of bpMRI based only on T2-WI and DWI has been proposed by multiple authors [80,81]. The benefits of omitting DCE MRI are related to reduced examination times, reduced costs, and avoiding the risk of adverse events related to the use of contrast agent. Results coming from prospective trials assessing the diagnostic accuracy of bpMRI are promising [80,81] regarding biopsy avoidance and for reducing the detection of insignificant cancers. Comparative studies of mpMRI and bpMRI are mostly retrospective, with significant differences in the methods and not negligible risk of bias (Table 4). To the best of our knowledge, Stanzione et al [82] showed the diagnostic accuracy of bpMRI compared with mpMRI. The authors reported a series of 82 men undergoing mpMRI for the suspicion of csPCa and then receiving systematic biopsy plus eventual MRI-TBx, with 35% of patients receiving radical prostatectomy. Two experienced radiologists blindly reported bpMRI first, followed by mpMRI (ie, with DCE), after an interval of 20–30 d to avoid any recall bias. The overall AUC values of bpMRI and mpMRI for csPCa detection were 0.91 and 0.93, respectively (p > 0.05). Thestrup et al [83] reported similar accuracies of bpMRI and mpMRI in detecting csPCa, although without providing any formal statistical comparisons. Lee et al [84] compared two cohorts undergoing mpMRI and bpMRI for a suspicion of PCa and then receiving visual MRI-TBx in addition to standard systematic biopsy. The authors reported a similar detection of csPCa among men who had suspicious lesions in the bpMRI and mpMRI groups (63% and 62%, respectively). Nonetheless, these results should be interpreted carefully since the two cohorts were not matched randomly.
Further studies reported promising results, although being affected by significant bias mainly concerning the MRI interpretation process (mpMRI and bpMRI read by the same radiologist during the same session) [85] and the reference standard (no biopsy result in men with negative MRI) [86]. The similar diagnostic performance of these two techniques was confirmed in other series [87-89] that attempted to better identify the eventual differences. Specifically, omitting DCE MRI was related to an increasing rate of PI-RADS 3 lesions, slightly better specificity, and worse sensitivity (although never significant) [87,89]. Furthermore, DCE MRI was not needed for the determination of the overall assessment category in 81% of patients [89].
Choi et al [90] compared the ability of bpMRI with that of mpMRI in detecting the index lesion using radical prostatectomy as the reference standard. Two independent radiologists (7 and 13 yr of experience) retrospectively reviewed prebiopsy MRI of 113 men using PI-RADS v2. No significant differences were found in csPCa diagnostic accuracy for bpMRI versus mpMRI for both readers using PI-RADS ≥3 as cutoff. Interestingly, both readers reported significantly higher sensitivity for bpMRI than for mpMRI [90]. Furthermore, inter-reader agreement on PI-RADS assessment score was moderate for both bpMRI (k = 0.540) and mpMRI (k = 0.478). However, both readers of this study were aware that all men underwent radical prostatectomy for csPCa, and this might have affected the overall results. In a similar study, Scialpi et al [91] evaluated the ability of bpMRI and mpMRI to detect single lesions in a cohort of 41 men receiving radical prostatectomy. For both bpMRI and mpMRI, the sensitivity was similar, which was 100% in PZ, and 98% and 95% in the entire prostate and TZ, respectively. Biparametric MRI detected 181/131 lesions at final pathology, resulting in 28% false positives and 3% false negatives rates [91]. Nonetheless, no information regarding readers’ background was provided and specific information regarding the experience is often scarce.
In this context, Gatti et al [92] compared bpMRI and mpMRI according to readers’ experience. The authors conducted a retrospective study on six blinded radiologists, divided into three groups according to the level of experience, reviewing bpMRI and mpMRI protocols of 68 men receiving a prostate biopsy and eventual radical prostatectomy. The authors used a modified version of PI-RADS v2 [89] for bpMRI reading and a cutoff of ≥4 for both protocols. Interestingly, the specificity was quite stable regardless of the protocol and readers’ experience. Significant differences were found for sensitivity and AUC in detecting PCa index lesions, mainly related to the rate of true positives. The effect of experience was more evident when considering bpMRI than mpMRI. Consequently, in the highly experienced group, the performance of bpMRI versus mpMRI was similar (AUC: 0.86 vs 0.93, p = 0.10; true positive: 82% vs 86%, p = 0.13). The accuracy of bpMRI became progressively less if compared with mpMRI with the decrease of experience (0.68 vs 0.77 in the less experienced group). Further, the authors attempted to provide a rough indication on the number of necessary cases to reach an AUC and sensitivity of ≥0.80: 150–200 for mpMRI and 700–800 for bpMRI [92]. Differently, Di Campli et al [93] showed no diagnostic differences between bpMRI and mpMRI, and no significant influence by readers’ experience.
In summary, available evidence from comparative studies suggests that bpMRI might be a potentially valid alternative to mpMRI, particularly for experienced readers, on the condition that DWI is of excellent quality. These findings have also been confirmed in a recent meta-analysis, demonstrating the noninferiority of bpMRI and showing overall nonsignificant higher sensitivity and lower specificity of mpMRI [94]. Moreover, a recent prospective, multi-reader, blinded direct comparison between bpMRI and mpMRI showed similar diagnostic performance in ruling out the presence of high-grade PCa [79].
That being said, the high methodological heterogeneity might have represented a great confounder, and it remains unclear how the performance of bpMRI will translate to less experienced centers and lower-quality images. Indeed, the assessment system used (ie, PI-RADS, dedicated bpMRI PI-RADS), choice of the cutoff, magnetic field, choice of the outcome (ie, PCa, csPCa), and reference standard are the factors varying the most across the studies. Ultimately, randomized prospective studies using noninferiority designs, in men with variable prevalence with clinically meaningful endpoints (biopsy avoidance, detection of csPCa, and clinically insignificant PCa), will be needed to decide on which patient groups can avoid contrast enhancement.
3.8. CAD and deep learning
The first study on PCa detection [95] was carried out by Chan et al [96] in 2003 (Supplementary Table 3). The CAD mainly consisted of quantitative analysis of medical imaging data (ie, mpMRI) with the aim to provide results potentially related to clinical conditions (ie, PCa). Different CAD systems have different strategies for imaging feature analysis, with different diagnostic accuracies [97]. The imaging analysis process includes multiple steps that can change across different CAD systems [97,98].
The CAD has recently been assessed in aiding radiologists during mpMRI interpretation and reporting. Interestingly, the evaluation of CAD as an assisting tool began at a similar time to the proposal of the first standardized assessment system (ie, PI-RADS v1) [45,99]. The inclusion of CAD systems in mpMRI interpretation process would potentially overcome some of the issues affecting diagnostic accuracy, such as reader experience, reproducibility, as well as enhancing the accuracy of mpMRI itself.
Hambrock et al [99] published the first study evaluating the effect of CAD for both less and more experienced radiologists on the differentiation of benign from malignant lesions at mpMRI. The authors demonstrated that, as the addition of CAD significantly improved the performance of less experienced radiologists in detecting PCa, when less experienced radiologists used CAD, they achieved similar performance to that of experienced radiologists. Furthermore, stand-alone CAD had similar diagnostic accuracy to experienced readers. However, this study did not replicate a real-life mpMRI diagnostic pathway, since the CAD system used was able to differentiate only preidentified regions between benign and malignant, but not PCa detection in a whole gland. In a similar study, Niaf et al [100] demonstrated that CAD increased the performance of both experienced and less experienced readers (AUC increase of 2% and 4%, respectively; p = 0.08) [100]. Litjens et al [101], in a standard clinical scenario, showed that the combination of CAD and PI-RADS assessment categorization achieved higher diagnostic accuracy than PI-RADS categorization alone to discriminate between both benign lesions versus PCa (0.88 vs 0.81, p = 0.013) and PCa versus csPCa (0.88 vs 0.78, p < 0.01) [101]. In a similar study based on prostatectomy specimens, Wang et al [102] demonstrated that the combination of CAD information with PI-RADS v2 increased the clinical net benefit for PCa identification as compared with PI-RADS categorization alone. Further studies demonstrated the clinical utility of quantitative analyses of ADC in improving the diagnostic performance when compared with the scoring system alone [103-105]. Giannini et al [106] were the first to replicate a real-life diagnostic pathway including the use of CAD. On a per-patient analysis, the use of CAD achieved higher sensitivity for csPCa (91% vs 81%, p = 0.046), while specificity was not affected. The per-lesion analysis showed a higher number of single lesions detected with CAD assistance. Interestingly, the average reading time with CAD was significantly lower (60s vs 220 s; p < 0.001) [106]. Greer et al [107] tested the effect of CAD in a multi-institutional group of differently experienced and blinded readers interpreting mpMRI in a cohort of men receiving radical prostatectomy for PCa. Sensitivity increased for all experience levels; however, specificity was dependent on reader experience. Improved sensitivity came from lesions scored as PI-RADS <3, as sensitivity for lesions scored as PI-RADS ≥3 was equal. The authors observed that CAD likely helped readers to overcome the “satisfaction of search” limitation, which stems from reduced detection of subsequent lesions after one lesion. However, the improved sensitivity of CAD was balanced by decreased specificity. It is noteworthy that the use of CAD improved agreement between all readers [107]. In an effort to assess the clinical value of a CAD system in a “real-world” scenario, Gaur et al [108] tested a multi-institutional population of 216 men receiving mpMRI. The cases used in this study were diverse in terms of institution-specific acquisition, MR manufacturer, and patient population, and nine readers of different experience levels were included. Overall, sensitivity for index lesions of mpMRI without and with CAD assistance was comparable. The highest benefit of CAD, as compared with mpMRI alone, was observed for moderately experienced readers detecting TZ csPCa. The authors concluded that CAD might help in reducing the rate of false positivity and increasing the sensitivity of moderately experienced readers [108]. Furthermore, recent studies confirmed the clinical utility of CAD use in combination with a Likert score and its generalizability to different field strengths [109,110].
Taken together, these findings suggest that CAD represents a promising tool that generally improves mpMRI efficiency in terms of both diagnostic accuracy and reporting time. The greatest benefit related to the use of CAD potentially lies in improving mpMRI sensitivity for multifocal csPCa, improving diagnostic accuracy in less experienced readers, improving inter-reader agreement, and reducing reporting time. Nonetheless, the majority of the available CAD systems are limited to site-specific predefined sequences, with most of them not considering DCE sequences and therefore site-specific CAD algorithm raising similar caveats to those raised when comparing bpMRI and mpMRI. To date, CAD is limited to research use only, as several aspects still need to be investigated and standardized.
3.9. Discussion
When assessing the role of mpMRI for PCa diagnosis, there are multiple additional aspects that need to be taken into account before drawing conclusions regarding clinical utility. In this study, the factors that might influence the diagnostic accuracy of MRI have been explored systematically. On the basis of our findings, some points need to be discussed.
First, it is clear that all the factors described in this study affect mpMRI accuracy, and are extremely related to each other in determining the ability of mpMRI in detecting csPCa. This is of crucial importance when comparing different studies. For instance, the use of an ERC helps increase mpMRI accuracy for anatomic image detail in the posterior part of the prostate, but without DWI, this does not help in better detecting csPCa. The benefit of the ERC is related to the magnetic field strength, which varies across the studies. In fact, according to our findings, a 3.0 T scan without an ERC and a 1.5 T mpMRI scan with an ERC reach similar staging accuracies, and thus anatomic detail. However, the ERC causes compression of the PZ, which may even result in missing small central posterior clinically significant cancers [25]. Considering that the addition of an ERC is also associated with increased costs, duration of examination, and artifacts, and is uncomfortable for patients, the use of an ERC is suggested only for older 1.5 T MR scanners. The recommended magnetic field strength for prostate mpMRI is 3.0 T [33]. However, an important issue that is discussed in literature is the gradient strengths of scanners: steep gradients are crucial for good DWI. Therefore, the steepness of gradient strength may be more important than the field strength.
Second, the experience of radiologists and urologists is pivotal and affects most of the factors related to mpMRI accuracy, such as inter-reader agreement and accuracy of different assessment systems. In this regard, different assessment systems seem to perform differently according to the experience of the reader. Indeed, standardization of the use of one assessment system (ie, PI-RADS v2) might actually help radiologists with lower experience in prostate mpMRI to reach an acceptable accuracy level easily. In addition, training and certification are important issues. For example, following an expert hands-on course followed by 100 supervised (double) reads may contribute to better interpretation quality and lower inter-reader variability [49,79]. Similarly, the use of bpMRI appears to be most effective for experienced readers, when good image quality is available, whereas those with low experience might still need DCE MRI as a backup in order to achieve acceptable accuracy. The noninferiority of bpMRI would represent a great step toward the widespread use of MRI, allowing a reduction in the costs (up to $300 spared per test [84,87]) and an increase in the availability of the test (15 min saved per patient [79,87]). With this aim in mind, well-designed prospective trials are necessary to provide reliable evidence and draw solid conclusions on bpMRI for PCa diagnosis [79]. Even when assessing the use of CAD, the highest benefit in terms of diagnostic accuracy is observed in less experienced radiologists.
To the best of our knowledge, this is the first systematic review exploring the different factors influencing mpMRI accuracy in detecting csPCa. However, this study is limited by the unsatisfactory evidence of most of the studies included, especially related to different MRI protocols, different outcomes, different mpMRI indications, different csPCa prevalence, variable readers’ experience, and pathological reference standards, with only 22% of studies having both low risk of bias and applicability concerns. Moreover, the lack of reliable pathological reference standards prevented the exploration of the variability of mpMRI performance in the presence of a negative report in the majority of studies. This heterogeneity prevents the possibility to conduct a proper meta-analysis on the effect of these factors. Lastly, further factors might be included as potential influencers of mpMRI accuracy (eg, apparent coefficient diffusion and b value, gradient strength of the MRI scanner, type of scanner, communication methods between radiologists and urologists, and type of study population). Nonetheless, studies specifically addressing these further factors eligible for inclusion in this review are scarce. These limitations are the cause that the findings of this review should be interpreted with caution and within the appropriate context.
4. Conclusions
Even though the role of mpMRI in predicting PCa has been demonstrated widely, several factors influence its diagnostic accuracy and are affecting each other, with the experience levels of the radiologists/biopsy operators being the key confounders. The high heterogeneity across the studies underlines the need for further studies that clarify how they impact the clinical utility of mpMRI for PCa diagnosis. Indeed, the factors assessed in this study concur with the high variability of mpMRI performance and the related clinical utility, consequently limiting the widespread use of mpMRI. In order to deliver the benefits of mpMRI in the diagnosis of csPCa, it is necessary to develop expertise for both radiologists and urologists, implement quality control, and adhere to the most recent PI-RADS assessment guidelines. Without the standardization of mpMRI execution and interpretation, and MRI-TBx technique, the mpMRI pathway may lead to suboptimal care outside large-volume and expert centers mainly due to the increased number of unnecessary biopsies, and false positive and false negative rates [11].
Supplementary Material
Funding/Support and role of the sponsor:
None. The views expressed in this publication are those of the author(s) and not necessarily those of the NHS, the National Institute for Health Research or the Department of Health.
Footnotes
Financial disclosures: Armando Stabile certifies that all conflicts of interest, including specific financial interests and relationships and affiliations relevant to the subject matter or materials discussed in the manuscript (eg, employment/affiliation, grants or funding, consultancies, honoraria, stock ownership or options, expert testimony, royalties, or patents filed, received, or pending), are the following: Francesco Giganti is funded by the UCL Graduate Research Scholarship and the Brahm PhD scholarship in memory of Chris Adams. Veeru Kasivisvanathan is an Academic Clinical Lecturer funded by the United Kingdom National Institute for Health Research (NIHR).
Appendix A. Supplementary data
Supplementary material related to this article can be found, in the online version, at doi:https://doi.org/10.1016/j.euo.2020.02.005.
References
- [1].Stabile A, Giganti F, Rosenkrantz AB, et al. Multiparametric MRI for prostate cancer diagnosis: current status and future directions. Nat Rev Urol 2020;17:41–61. [DOI] [PubMed] [Google Scholar]
- [2].Giganti F, Rosenkrantz AB, Panebianco V, et al. The evolution of MRI of the prostate: the past, the present, and the future. Am J Roentgenol 2019;213:1–13. [DOI] [PubMed] [Google Scholar]
- [3].Woo S, Suh CH, Eastham JA, et al. Comparison of magnetic resonance imaging-stratified clinical pathways and systematic transrectal ultrasound-guided biopsy pathway for the detection of clinically significant prostate cancer: a systematic review and meta-analysis of randomized controlled trials. Eur Urol Oncol 2019;2:605–16. [DOI] [PMC free article] [PubMed] [Google Scholar]
- [4].Kasivisvanathan V, Stabile A, Neves JB, et al. Magnetic resonance imaging-targeted biopsy versus systematic biopsy in the detection of prostate cancer: a systematic review and meta-analysis. Eur Urol 2019;76:284–303. [DOI] [PubMed] [Google Scholar]
- [5].Kasivisvanathan V, Rannikko AS, Borghi M, et al. MRI-targeted or standard biopsy for prostate-cancer diagnosis. N Engl J Med 2018;378:1767–77. [DOI] [PMC free article] [PubMed] [Google Scholar]
- [6].Drost F-JH, Osses D, Nieboer D, et al. Prostate magnetic resonance imaging, with or without magnetic resonance imaging-targeted biopsy, and systematic biopsy for detecting prostate cancer: a Cochrane systematic review and meta-analysis. Eur Urol 2020;77:78–94. [DOI] [PubMed] [Google Scholar]
- [7].van der Leest M, Cornel EB, Israel B, et al. Head-to-head comparison of transrectal ultrasound-guided prostate biopsy versus multi-parametric prostate resonance imaging with subsequent magnetic resonance-guided biopsy in biopsy-naïve men with elevated prostate-specific antigen : a large prospective multicenter clinical study. Eur Urol 2019;75:570–8. [DOI] [PubMed] [Google Scholar]
- [8].Rouvière O, Puech P, Renard-Penna R, et al. Use of prostate systematic and targeted biopsy on the basis of multiparametric MRI in biopsy-naive patients (MRI-FIRST): a prospective, multicentre, paired diagnostic study. Lancet Oncol 2019;20:100–9. [DOI] [PubMed] [Google Scholar]
- [9].Moore CM, Robertson NL, Arsanious N, et al. Image-guided prostate biopsy using magnetic resonance imaging—derived targets : a systematic review. Eur Urol 2013;63:125–40. [DOI] [PubMed] [Google Scholar]
- [10].Engels R, Israel B, Padhani AR, Barentsz JO, Mottrie A. Multiparametric magnetic resonance imaging for the detection of clinically significant prostate cancer: what urologists need to know. Part 1 : acquisition. Eur Urol. In press. 10.1016/j.eururo.2019.09.021. [DOI] [PubMed] [Google Scholar]
- [11].European Urology Association. EAU guidelines on prostate cancer. 2019.
- [12].Moher D, Shamseer L, Clarke M, et al. Preferred reporting items for systematic review and meta-analysis protocols (PRISMA-P) 2015 statement. Syst Rev 2015;4:1. [DOI] [PMC free article] [PubMed] [Google Scholar]
- [13].Whiting P, Rutjes A, Westwood M, et al. QUADAS-2: a revised tool for the quality assessment of diagnostic accuracy studies. Ann Intern Med 2011;155:529–36. [DOI] [PubMed] [Google Scholar]
- [14].Beyersdorff D, Taymoorian K, Knösel T, et al. MRI of prostate cancer at 1.5 and 3.0 T: comparison of image quality in tumor detection and staging. Am J Roentgenol 2005;185:1214–20. [DOI] [PubMed] [Google Scholar]
- [15].Bloch BN, Rofsky NM, Baroni RH, Marquis RP, Pedrosa I, Lenkinski RE. 3 Tesla magnetic resonance imaging of the prostate with combined pelvic phased-array and endorectal coils: initial experience. Acad Radiol 2004;11:863–7. [DOI] [PubMed] [Google Scholar]
- [16].Sertdemir M, Schoenberg SO, Sourbron S, et al. Interscanner comparison of dynamic contrast-enhanced MRI in prostate cancer: 1.5 versus 3 T MRI. Invest Radiol 2013;48:92–7. [DOI] [PubMed] [Google Scholar]
- [17].Shah ZK, Elias SN, Abaza R, et al. Performance comparison of 1.5-T endorectal coil MRI with 3.0-T nonendorectal coil MRI in patients with prostate cancer. Acad Radiol 2015;22:467–74. [DOI] [PMC free article] [PubMed] [Google Scholar]
- [18].Sosna J, Pedrosa I, Dewolf WC, Mahallati H, Lenkinski RE, Rofsky NM. MR imaging of the prostate at 3 tesla: comparison of an external phased-array coil to imaging with an endorectal coil at 1.5 tesla. Acad Radiol 2004;11:857–62. [DOI] [PubMed] [Google Scholar]
- [19].Ullrich T, Quentin M, Oelers C, et al. Magnetic resonance imaging of the prostate at 1.5 versus 3.0 T: a prospective comparison study of image quality. Eur J Radiol 2017;90:192–7. [DOI] [PubMed] [Google Scholar]
- [20].Thompson JE, Moses D, Shnier R, et al. Multiparametric magnetic resonance imaging guided diagnostic biopsy detects significant prostate cancer and could reduce unnecessary biopsies and over detection: a prospective study. J Urol 2014;192:67–74. [DOI] [PubMed] [Google Scholar]
- [21].Barth BK, Cornelius A, Nanz D, Eberli D, Donati OF. Comparison of image quality and patient discomfort in prostate MRI: pelvic phased array coil vs. endorectal coil. Abdom Radiol 2016;41:2218–26. [DOI] [PubMed] [Google Scholar]
- [22].Barth BK, Rupp NJ, Cornelius A, et al. Diagnostic accuracy of a MR protocol acquired with and without endorectal coil for detection of prostate cancer: a multicenter study. Curr Urol 2019;88–96. [DOI] [PMC free article] [PubMed] [Google Scholar]
- [23].Turkbey B, Merino MJ, Gallardo EC, et al. Comparison of endorectal coil and nonendorectal coil T2W and diffusion-weighted MRI at 3 Tesla for localizing prostate cancer: correlation with whole-mount histopathology. J Magn Reson Imaging 2014;39:1443–8. [DOI] [PMC free article] [PubMed] [Google Scholar]
- [24].Baur ADJ, Daqqaq T, Wagner M, et al. T2- and diffusion-weighted magnetic resonance imaging at 3 T for the detection of prostate cancer with and without endorectal coil: an intraindividual comparison of image quality and diagnostic performance. Eur J Radiol 2016;85:1075–84. [DOI] [PubMed] [Google Scholar]
- [25].Chernyak V, Flusberg M, Kurteva T, Ghavamian R, Rozenblit AM. Accuracy of prostate measurements on MRI with and without an endorectal coil. Clin Imaging 2015;39:85–8. [DOI] [PubMed] [Google Scholar]
- [26].Costa DN, Yuan Q, Xi Y, et al. Comparison of prostate cancer detection at 3-T MRI with and without an endorectal coil: a prospective, paired-patient study. Urol Oncol Semin Orig Investig 2016;34:255, e7–13. [DOI] [PubMed] [Google Scholar]
- [27].Gawlitza J, Reiss-Zimmermann M, Thörmer G, et al. Impact of the use of an endorectal coil for 3 T prostate MRI on image quality and cancer detection rate. Sci Rep 2017;7:1–8. [DOI] [PMC free article] [PubMed] [Google Scholar]
- [28].Mirak SA, Shakeri S, Bajgiran AM, et al. Three Tesla multiparametric magnetic resonance imaging: comparison of performance with and without endorectal coil for prostate cancer detection, PI-RADS™ version 2 category and staging with whole mount histopathology correlation. J Urol 2019;201:496–502. [DOI] [PubMed] [Google Scholar]
- [29].O’Donohoe RL, Dunne RM, Kimbrell V, Tempany CM. Prostate MRI using an external phased array wearable pelvic coil at 3T: comparison with an endorectal coil. Abdom Radiol 2019;44:1062–9. [DOI] [PubMed] [Google Scholar]
- [30].Torricelli P, Cinquantini F, Ligabue G, Bianchi G, Sighinolfi P, Romagnoli R. Comparative evaluation between external phased array coil at 3 T and endorectal coil at 1.5 T: preliminary results. J Comput Assist Tomogr 2006;30:355–61. [DOI] [PubMed] [Google Scholar]
- [31].De Visschere P, Nezzo M, Pattyn E, Fonteyne V, Van Praet C, Villeirs G. Prostate magnetic resonance spectroscopic imaging at 1.5 tesla with endorectal coil versus 3.0 tesla without endorectal coil: comparison of spectral quality. Clin Imaging 2015;39:636–41. [DOI] [PubMed] [Google Scholar]
- [32].Husband JE, Padhani AR, Macvicar AD, Revell P. Magnetic resonance imaging of prostate cancer: comparison of image quality using endorectal and pelvic phased array coils. Clin Radiol 1998;53:673–81. [DOI] [PubMed] [Google Scholar]
- [33].Weinreb JC, Barentsz JO, Choyke PL, et al. PI-RADS Prostate Imaging - Reporting and Data System: 2015, version2.Eur Urol 2015;69:16–40. [DOI] [PMC free article] [PubMed] [Google Scholar]
- [34].Auer T, Edlinger M, Bektic J, et al. Performance of PI-RADS version 1 versus version 2 regarding the relation with histopathological results. World J Urol 2017;35:687–93. [DOI] [PubMed] [Google Scholar]
- [35].De Visschere P, Pattyn E, Ost P, Claeys T, Lumen N, Villeirs G. Comparison of the Prostate Imaging Reporting and Data System (PI-RADS) version 1 and 2 in a cohort of 245 patients with histopathological reference and long-term follow-up. J Belg Soc Radiol 2016;100:1–10. [DOI] [PMC free article] [PubMed] [Google Scholar]
- [36].Wang X,Bao J, Ping X, et al. The diagnostic value of PI-RADS V1 and V2 using multiparametric MRI in transition zone prostate clinical cancer. Oncol Lett 2018;16:3201–6. [DOI] [PMC free article] [PubMed] [Google Scholar]
- [37].Feng ZY, Wang L, Min XD, Wang SG, Wang GP, Cai J. Prostate cancer detection with multiparametric magnetic resonance imaging: Prostate Imaging Reporting and Data System version 1 versus version 2. Chin Med J (Engl) 2016;129:2451–9. [DOI] [PMC free article] [PubMed] [Google Scholar]
- [38].Hoffmann R, Logan C, O’Callaghan M, Gormly K, Chan K, Foreman D. Does the Prostate Imaging-Reporting and Data System (PI-RADS) version 2 improve accuracy in reporting anterior lesions on multiparametric magnetic resonance imaging (mpMRI)? Int Urol Nephrol 2018;50:13–9. [DOI] [PubMed] [Google Scholar]
- [39].Polanec S, Helbich TH, Bickel H, et al. Head-to-head comparison of PI-RADS v2 and PI-RADS v1. Eur J Radiol 2016;85:1125–31. [DOI] [PubMed] [Google Scholar]
- [40].Krishna S, McInnes M, Lim C, et al. Comparison of prostate imaging reporting and data system versions 1 and 2 for the detection of peripheral zone Gleason score 3 + 4 = 7 cancers. Am J Roentgenol 2017;209:W365–73. [DOI] [PubMed] [Google Scholar]
- [41].Renard-Penna R, Mozer P, Cornud F, et al. Prostate Imaging Reporting and Data System and Likert Scoring System: multiparametric MR imaging validation study to screen patients for initial biopsy. Radiology 2015;275:458–68. [DOI] [PubMed] [Google Scholar]
- [42].Rosenkrantz AB, Kim S, Lim RP, et al. Prostate cancer localization using multiparametric MR imaging: comparison of Prostate Imaging Reporting and Data System (PI-RADS) and Likert scales. Radiology 2013;269:482–92. [DOI] [PubMed] [Google Scholar]
- [43].Schaudinn A, Gawlitza J, Mucha S, et al. Comparison of PI-RADS v1 and v2 for multiparametric MRI detection of prostate cancer with whole-mount histological workup as reference standard. Eur J Radiol 2019;116:180–5. [DOI] [PubMed] [Google Scholar]
- [44].Tewes S, Mokov N, Hartung D, et al. Standardized reporting of prostate MRI: Comparison of the prostate imaging reporting and data system (PI-RADS) version 1 and version 2. PLoS One 2016;11:1–13. [DOI] [PMC free article] [PubMed] [Google Scholar]
- [45].Barentsz JO, Richenberg J, Clements R, et al. ESUR prostate MR guidelines 2012. Eur Radiol 2012;22:746–57. [DOI] [PMC free article] [PubMed] [Google Scholar]
- [46].Barentsz JO, Weinreb JC, Verma S, et al. Synopsis of the PI-RADS v2 guidelines for multiparametric prostate magnetic resonance imaging and recommendations for use. Eur Urol 2015;69:41–9. [DOI] [PMC free article] [PubMed] [Google Scholar]
- [47].Akin O, Riedl CC, Ishill NM, Moskowitz CS, Zhang J, Hricak H. Interactive dedicated training curriculum improves accuracy in the interpretation of MR imaging of prostate cancer. Eur Radiol 2010;20:995–1002. [DOI] [PMC free article] [PubMed] [Google Scholar]
- [48].Garcia-Reyes K, Passoni NM, Palmeri ML, et al. Detection of prostate cancer with multiparametric MRI (mpMRI): effect of dedicated reader education on accuracy and confidence of index and anterior cancer diagnosis. Abdom Imaging 2015;40:134–42. [DOI] [PMC free article] [PubMed] [Google Scholar]
- [49].Rosenkrantz AB, Abimbola A, Anunita K, et al. The learning curve in prostate MRI interpretation: self-directed learning versus continual reader feedback. AJR Am J Roentgenol 2017;208:92–100. [DOI] [PubMed] [Google Scholar]
- [50].Pickersgill NA, Vetter JM, Raval NS, et al. The accuracy of prostate magnetic resonance imaging interpretation: impact of the individual radiologist and clinical factors. Urology 2019;127:68–73. [DOI] [PubMed] [Google Scholar]
- [51].Rosenkrantz AB, Begovic J, Pires A, Won E, Taneja SS. Babb JS Online interactive case-based instruction in prostate magnetic resonance imaging interpretation Using Prostate Imaging and Reporting Data System version 2: effect for novice readers. Curr Probl Diagn Radiol 2019;48:132–41. [DOI] [PubMed] [Google Scholar]
- [52].Benchikh El Fegoun A, El Atat R, Choudat L, et al. The learning curve of transrectal ultrasound-guided prostate biopsies: implications for training programs. Urology 2013;81:12–6. [DOI] [PubMed] [Google Scholar]
- [53].Tadtayev S, Hussein A, Carpenter L, Vasdev N, Boustead G. The association of level of practical experience in transrectal ultrasonography guided prostate biopsy with its diagnostic outcome. Ann R Coll Surg Engl 2017;99:218–23. [DOI] [PMC free article] [PubMed] [Google Scholar]
- [54].Bjurlin MA, Meng X, Le Nobin J, et al. Optimization of prostate biopsy: the role of magnetic resonance imaging targeted biopsy in detection, localization and risk assessment. J Urol 2014;192:648–658. [DOI] [PMC free article] [PubMed] [Google Scholar]
- [55].Gaziev G, Wadhwa K, Barrett T, et al. Defining the learning curve for multiparametric magnetic resonance imaging (MRI) of the prostate using MRI-transrectal ultrasonography (TRUS) fusion-guided transperineal prostate biopsies as a validation tool. BJU Int 2016;117:80–6. [DOI] [PubMed] [Google Scholar]
- [56].Calio B, Sidana A, Sugano D, et al. Changes in prostate cancer detection rate of MRI-TRUS fusion vs systematic biopsy over time: evidence of a learning curve. Prostate Cancer Prostatic Dis 2017;20:436–41. [DOI] [PMC free article] [PubMed] [Google Scholar]
- [57].Meng X, Rosenkrantz AB, Huang R, et al. The institutional learning curve of magnetic resonance imaging-ultrasound fusion targeted prostate biopsy: temporal improvements in cancer detection in 4 years. J Urol 2018;200:1022–9. [DOI] [PubMed] [Google Scholar]
- [58].Mager R, Brandt MP, Borgmann H, Gust KM, Haferkamp A, Kurosch M. From novice to expert: analyzing the learning curve for MRI-transrectal ultrasonography fusion-guided transrectal prostate biopsy. Int Urol Nephrol 2017;49:1–8. [DOI] [PubMed] [Google Scholar]
- [59].Kasabwala K, Patel N, Cricco-Lizza E, et al. The learning curve for magnetic resonance imaging/ultrasound fusion-guided prostate biopsy image fusion. Eur Urol Oncol 2018;2:135–40. [DOI] [PubMed] [Google Scholar]
- [60].Halstuch D, Baniel J, Lifshitz D, Sela S, Ber Y, Margel D. Characterizing the learning curve of MRI-US fusion prostate biopsies. Prostate Cancer Prostatic Dis 2019;22:546–51. [DOI] [PubMed] [Google Scholar]
- [61].Stabile A, Dell’Oglio P, Gandaglia G, et al. Not all multiparametric magnetic resonance imaging-targeted biopsies are equal: the impact of the type of approach and operator expertise on the detection of clinically significant prostate cancer. Eur Urol Oncol 2018;1:120–8. [DOI] [PubMed] [Google Scholar]
- [62].Westhoff N, Haumann H, Kriegmair MC, et al. Association of training level and outcome of software-based image fusion-guided targeted prostate biopsies. World J Urol 2019;37:2119–27. [DOI] [PubMed] [Google Scholar]
- [63].Quentin M, Arsov C, Röhlen S, et al. Inter-reader agreement of multi-parametric MR imaging for the detection of prostate cancer: evaluation of a scoring system. RoFo 2012;184:925–9. [DOI] [PubMed] [Google Scholar]
- [64].Dickinson L, Ahmed HU, Allen C, et al. Magnetic resonance imaging for the detection, localisation, and characterisation of prostate cancer: recommendations from a European consensus meeting. Eur Urol 2011;59:477–94. [DOI] [PubMed] [Google Scholar]
- [65].Schimmöller L, Quentin M, Arsov C, et al. Inter-reader agreement of the ESUR score for prostate MRI using in-bore MRI-guided biopsies as the reference standard. Eur Radiol 2013;23:3185–90. [DOI] [PubMed] [Google Scholar]
- [66].Rosenkrantz AB, Lim RP, Haghighi M, Somberg MB, Babb JS, Taneja SS. Comparison of interreader reproducibility of the Prostate Imaging Reporting and Data System and Likert scales for evaluation of multi-parametric prostate MRI. Am J Roentgenol 2013;201:612–8. [DOI] [PubMed] [Google Scholar]
- [67].Mussi TC, Yamauchi I, Tridente FC, et al. Interobserver agreement and positivity of PI-RADS version 2 among radiologists with different levels of experience. Acad Radiol 2019;26:1017–22. [DOI] [PubMed] [Google Scholar]
- [68].Glazer DI, Mayo-Smith WW, Sainani NI, et al. Interreader agreement of prostate imaging reporting and data system version 2 using an in-bore MRI-guided prostate biopsy cohort: a single institution’s initial experience. Am J Roentgenol 2017;209:W145–51. [DOI] [PMC free article] [PubMed] [Google Scholar]
- [69].Girometti R, Giannarini G, Greco F, et al. Interreader agreement of PI-RADS v. 2 in assessing prostate cancer with multiparametric MRI: a study using whole-mount histology as the standard of reference. J Magn Reson Imaging 2019;49:546–55. [DOI] [PubMed] [Google Scholar]
- [70].Müller S, Lilleaasen G, Sand TE, et al. Poor reproducibility of PIRADS score in two multiparametric MRIs before biopsy in men with elevated PSA. World J Urol 2018;36:687–91. [DOI] [PMC free article] [PubMed] [Google Scholar]
- [71].Rosenkrantz AB, Ginocchio LA, Cornfeld D, et al. Interobserver reproducibility of the PI-RADS version 2 Lexicon: a multicenter study of six experienced prostate radiologists. Radiology 2016;000:152542. [DOI] [PMC free article] [PubMed] [Google Scholar]
- [72].Smith CP, Harmon SA, Barrett T, et al. Intra- and interreader reproducibility of PI-RADSv2: a multireader study. J Magn Reson Imaging 2019;49:1694–703. [DOI] [PMC free article] [PubMed] [Google Scholar]
- [73].Hansen NL, Koo BC, Gallagher FA, et al. Comparison of initial and tertiary centre second opinion reads of multiparametric magnetic resonance imaging of the prostate prior to repeat biopsy. Eur Radiol 2017;27:2259–66. [DOI] [PMC free article] [PubMed] [Google Scholar]
- [74].Greer MD, Shih JH, Lay N, et al. Interreader variability of Prostate Imaging Reporting and Data System version 2 in detecting and assessing prostate cancer lesions at prostate MRI. AJR Am J Roentgenol 2019;27:1–8. [DOI] [PMC free article] [PubMed] [Google Scholar]
- [75].Ke Z, Wang L, De Min X, et al. Diagnostic performance and interobserver consistency of the prostate imaging reporting and data system version 2: a study on six prostate radiologists with different experiences from half a year to 17 years. Chin Med J (Engl) 2018;131:1666–73. [DOI] [PMC free article] [PubMed] [Google Scholar]
- [76].Purysko AS, Bittencourt LK, Bullen JA, Mostardeiro TR, Herts BR, Klein EA. Accuracy and interobserver agreement for prostate imaging reporting and data system, version 2, for the characterization of lesions identified on multiparametric MRI of the prostate. Am J Roentgenol 2017;209:339–45. [DOI] [PubMed] [Google Scholar]
- [77].Pickersgill NA, Vetter JM, Andriole GL, et al. Accuracy and variability of prostate multiparametric magnetic resonance imaging interpretation using the Prostate Imaging Reporting and Data System: a blinded comparison of radiologists. Eur Urol Focus In press. 10.1016/j.euf.2018.10.008. [DOI] [PubMed] [Google Scholar]
- [78].Sonn GA, Fan RE, Ghanouni P, et al. Prostate magnetic resonance imaging interpretation varies substantially across radiologists. Eur Urol Focus 2019;5:592–9. [DOI] [PubMed] [Google Scholar]
- [79].van der Leest M, Israe B, Cornel EB, et al. High diagnostic performance of short magnetic resonance imaging protocols for prostate cancer detection in biopsy-naïve men: the next step in magnetic resonance imaging accessibility. Eur Urol 2019;76:582–3. [DOI] [PubMed] [Google Scholar]
- [80].Jambor I, Boström PJ, Taimen P, et al. Novel biparametric MRI and targeted biopsy improves risk stratification in men with a clinical suspicion of prostate cancer (IMPROD trial). J Magn Reson Imaging 2017;46:1089–95. [DOI] [PubMed] [Google Scholar]
- [81].Boesen L, Norgaard N, Logager V, et al. Assessment of the diagnostic accuracy of biparametric magnetic resonance imaging for prostate cancer in biopsy-naive men: the Biparametric MRI for Detection of Prostate Cancer (BIDOC) study. JAMA 2018;1:e180219. [DOI] [PMC free article] [PubMed] [Google Scholar]
- [82].Stanzione A, Imbriaco M, Cocozza S, et al. Biparametric 3T magnetic resonance imaging for prostatic cancer detection in a biopsy-naïve patient population: a further improvement of PI-RADS v2? Eur J Radiol 2016;85:2269–74. [DOI] [PubMed] [Google Scholar]
- [83].Thestrup KCD, Logager V, Baslev I, Møller JM, Hansen RH, Thomsen HS. Biparametric versus multiparametric MRI in the diagnosis of prostate cancer. Acta Radiol Open 2016;5:205846011666304. [DOI] [PMC free article] [PubMed] [Google Scholar]
- [84].Lee DH, Nam JK, Lee SS, et al. Comparison of multiparametric and biparametric MRI in first round cognitive targeted prostate biopsy in patients with PSA levels under 10 ng/mL. Yonsei Med J 2017;58:994–9. [DOI] [PMC free article] [PubMed] [Google Scholar]
- [85].Kuhl CK, Bruhn R, Krämer N, Nebelung S, Heidenreich A, Schrading S. Abbreviated biparametric prostate MR imaging in men with elevated prostate-specific antigen. Radiology 2017;285:493–505. [DOI] [PubMed] [Google Scholar]
- [86].Nieuwenhove S, Saussez T, Thiry S, et al. Prospective comparison of a fast 1.5-T biparametric with the 3.0-T multiparametric ESUR magnetic resonance imaging protocol as a triage test for men at risk of prostate cancer. BJU Int 2019;123:411–20. [DOI] [PubMed] [Google Scholar]
- [87].Junker D, Steinkohl F, Fritz V, et al. Comparison of multiparametric and biparametric MRI of the prostate: are gadolinium-based contrast agents needed for routine examinations? World J Urol 2019;37:691–9. [DOI] [PubMed] [Google Scholar]
- [88].Sherrer RL, Glaser ZA, Gordetsky JB, Nix JW, Porter KK, Rais-Bahrami S. Comparison of biparametric MRI to full multiparametric MRI for detection of clinically significant prostate cancer. Prostate Cancer Prostatic Dis 2019;22:331–6. [DOI] [PMC free article] [PubMed] [Google Scholar]
- [89].De Visschere P, Lumen N, Ost P, Decaestecker K, Pattyn E, Villeirs G. Dynamic contrast-enhanced imaging has limited added value over T2-weighted imaging and diffusion-weighted imaging when using PI-RADSv2 for diagnosis of clinically significant prostate cancer in patients with elevated PSA. Clin Radiol 2017;72:23–32. [DOI] [PubMed] [Google Scholar]
- [90].Choi MH, Kim CK, Lee YJ, Jung SE. Prebiopsy biparametric MRI for clinically significant prostate cancer detection with PI-RADS version 2: a multicenter study. Genitourin Imaging 2019;212:839–46. [DOI] [PubMed] [Google Scholar]
- [91].Scialpi M, Prosperi E, D’Andrea A, et al. Biparametric versus multi-parametric MRI with non-endorectal coil at 3T in the detection and localization of prostate cancer. Anticancer Res 2017;37:1263–72. [DOI] [PubMed] [Google Scholar]
- [92].Gatti M, Faletti R, Calleris G, et al. Prostate cancer detection with biparametric magnetic resonance imaging (bpMRI) by readers with different experience: performance and comparison with multiparametric (mpMRI). Abdom Radiol 2019;44:1883–93. [DOI] [PubMed] [Google Scholar]
- [93].Di Campli E, Delli Pizzi A, Seccia B, et al. Diagnostic accuracy of biparametric vs multiparametric MRI in clinically significant prostate cancer: comparison between readers with different experience. Eur J Radiol 2018;101:17–23. [DOI] [PubMed] [Google Scholar]
- [94].Alabousi M, Salameh JP, Gusenbauer K, et al. Biparametric vs multiparametric prostate magnetic resonance imaging for the detection of prostate cancer in treatment-naïve patients: a diagnostic test accuracy systematic review and meta-analysis. BJU Int 2019;124:209–20. [DOI] [PubMed] [Google Scholar]
- [95].Chan H, Sahiner B, Helvie M, et al. Improvement of radiologists’ characterization of mammographic masses by using computer-aided diagnosis: an ROC study. Radiology 1999;212:817–27. [DOI] [PubMed] [Google Scholar]
- [96].Chan I, Wells W, Mulkern R, et al. Detection of prostate cancer by integration of line-scan diffusion, T2-mapping and T2-weighted magnetic resonance imaging; a multichannel statistical classifier. Med Phys 2003;30:2390–8. [DOI] [PubMed] [Google Scholar]
- [97].Lemaître G, Martí R, Freixenet J, Vilanova JC, Walker PM, Meriau-deau F. Computer-aided detection and diagnosis for prostate cancer based on mono and multi-parametric MRI: a review. Comput Biol Med 2015;60:8–31. [DOI] [PubMed] [Google Scholar]
- [98].Sun Y, Reynolds HM, Parameswaran B, et al. Multiparametric MRI and radiomics in prostate cancer: a review. Australas Phys Eng Sci Med 2019;42:3–25. [DOI] [PubMed] [Google Scholar]
- [99].Hambrock T, Vos PC, Hulsbergen-Van de Kaa CA, Barentsz JO, Hulsman HJ. Computer-aided diagnosis with multiparametric 3-T MR imaging - Effect on observer performance. Radiology 2013;266:521–30. [DOI] [PubMed] [Google Scholar]
- [100].Niaf E, Lartizien C, Bratan F, et al. Prostate focal peripheral zone lesions: characterization at multiparametric MR imaging—influence of a computer-aided diagnosis system. Radiology 2014;271:761–769. [DOI] [PubMed] [Google Scholar]
- [101].Litjens GJS, Barentsz JO, Karssemeijer N, Huisman HJ. Clinical evaluation of a computer-aided diagnosis system for determining cancer aggressiveness in prostate MRI. Eur Radiol 2015;25:3187–99. [DOI] [PMC free article] [PubMed] [Google Scholar]
- [102].Wang J, Wu CJ, Bao ML, Zhang J, Wang XN, Zhang YD. Machine learning-based analysis of MR radiomics can help to improve the diagnostic performance of PI-RADS v2 in clinically relevant prostate cancer. Eur Radiol 2017;27:4082–90. [DOI] [PubMed] [Google Scholar]
- [103].Park SY, Shin S, Jung DC, et al. PI-RADS version 2: quantitative analysis aids reliable interpretation of diffusion-weighted imaging for prostate cancer. Eur Radiol 2017;27:2776–83. [DOI] [PubMed] [Google Scholar]
- [104].Bonekamp D, Kohl S, Wiesenfarth M, Schelb P, Philipp J. Radiomic machine learning for characterization of prostate lesions with MRI : comparison to ADC values. Radiology 2018;289:128–37. [DOI] [PubMed] [Google Scholar]
- [105].Moraes MO, Roman DH, Copetti J, et al. Effects of the addition of quantitative apparent diffusion coefficient data on the diagnostic performance of the PI-RADS v2 scoring system to detect clinically significant prostate cancer. World J Urol. In press. 10.1007/s00345-019-02827-2. [DOI] [PubMed] [Google Scholar]
- [106].Giannini V, Mazzetti S, Armando E, et al. Multiparametric magnetic resonance imaging of the prostate with computer-aided detection: experienced observer performance study. Eur Radiol 2017;27:4200–8. [DOI] [PubMed] [Google Scholar]
- [107].Greer MD, Lay N, Shih JH, et al. Computer-aided diagnosis prior to conventional interpretation of prostate mpMRI: an international multi-reader study. Eur Radiol 2018;28:4407–17. [DOI] [PMC free article] [PubMed] [Google Scholar]
- [108].Gaur S, Lay N, Harmon SA, et al. Can computer-aided diagnosis assist in the identification of prostate cancer on prostate MRI? A multi-center, multi-reader investigation. Oncotarget 2018;9: 33804–33817. [DOI] [PMC free article] [PubMed] [Google Scholar]
- [109].Antonelli M, Johnston EW, Dikaios N, et al. Machine learning classifiers can predict Gleason pattern 4 prostate cancer with greater accuracy than experienced radiologists. Eur Radiol 2019;29:4754–64. [DOI] [PMC free article] [PubMed] [Google Scholar]
- [110].Dikaios N, Giganti F, Sidhu HS, et al. Multi-parametric MRI zone-specific diagnostic model performance compared with experienced radiologists for detection of prostate cancer. Eur Radiol 2019;29:4150–9. [DOI] [PMC free article] [PubMed] [Google Scholar]
Associated Data
This section collects any data citations, data availability statements, or supplementary materials included in this article.