Abstract
Kisspeptin neurons, i.e. KNDy neurons, in the arcuate nucleus (ARC) coexpress neurokinin B and dynorphin and regulate gonadotropin-releasing hormone/luteinizing hormone (LH) pulses. Because it remains unclear whether these neurons are associated with reproductive dysfunction in diabetic females, we examined the expression of KNDy neurons detected by histochemistry in streptozotocin (STZ)-induced diabetic female rats 8 weeks after STZ injection. We also evaluated relevant metabolic parameters – glucose, 3-hydroxybutyrate, and non-esterified fatty acids – as indicators of diabetes progression. Severe diabetes with hyperglycemia and severe ketosis suppressed the mRNA expression of KNDy neurons, resulting in low plasma LH levels and persistent diestrus. In moderate diabetes with hyperglycemia and moderate ketosis, kisspeptin-immunoreactive cells and plasma LH levels were decreased, while the mRNA expression of KNDy neurons remained unchanged. Mild diabetes with hyperglycemia and slight ketosis did not affect KNDy neurons and plasma LH levels. The number of KNDy cells was strongly and negatively correlated with plasma 3-hydroxybutyrate levels. The vaginal smear analysis showed unclear proestrus in diabetic rats 3–5 days after STZ injection, and the mRNA expression of kisspeptin in the ARC was decreased 2 weeks after STZ injection in severely diabetic rats. Kisspeptin neurons in the anteroventral periventricular nucleus (AVPV), which induce an LH surge, were unaffected at 2 and 8 weeks after STZ injection regardless of the diabetes severity. These results suggest that diabetes mellitus progression in females may negatively affect ARC kisspeptin neurons but not AVPV kisspeptin neurons, implicating a potential role of ARC kisspeptin neurons in menstrual disorder and infertility.
Keywords: Kiss1, Tac3, Pdyn, diabetes mellitus, metastin, arcuate nucleus, anteroventral periventricular nucleus, luteinizing hormone, reproduction
Introduction
Encoded by the Kiss1 gene, kisspeptin and its receptor, G protein-coupled receptor 54, stimulate the release of gonadotropin-releasing hormone (GnRH)/luteinizing hormone (LH) in mammals and are crucial in ovulation regulation and follicle development (Roa et al. 2011). In rodents, kisspeptin neurons are mainly located in the anteroventral periventricular nucleus (AVPV) and the arcuate nucleus (ARC). Kisspeptin neurons in the AVPV are targets of estrogen-positive feedback and are thought to be involved in inducing the preovulatory GnRH/LH surge. Conversely, kisspeptin neurons in the ARC mediate the negative feedback effects of sex steroids on GnRH/LH secretion (Smith et al. 2005, Adachi et al. 2007, Iwata et al. 2017, Kanaya et al. 2017). In many mammals, ARC kisspeptin neurons coexpress neurokinin B (NKB) and dynorphin (Dyn), which are encoded by Tac3 and Pdyn genes, respectively (Wakabayashi et al. 2010, Murakawa et al. 2016). These cells, termed KNDy neurons, are thought to be involved in generating pulsatile GnRH/LH secretion (Lehman et al. 2010).
Diabetes can cause erectile dysfunction in men and infertility and menstrual irregularities in women (Gandhi et al. 2017). Several studies examined hypothalamic kisspeptin neurons in diabetic rats. In male rats, Kiss1 mRNA in the hypothalamus and the number of kisspeptin-immunoreactive (ir) cells in the ARC of streptozotocin (STZ)-induced diabetic rats remained unchanged 1–2 weeks after STZ injection (Castellano et al. 2009, Dudek et al. 2016). However, Kiss1 mRNA in the hypothalamus decreased in male rats with long-term diabetes (4 weeks after STZ injection) (Castellano et al. 2006, 2009). In male rats with diabetes induced by both STZ and high-fat diet (HFD) with decreased plasma levels of endogenous testosterone, the number of kisspeptin-, NKB-, and Dyn-ir cells in the ARC was higher than in non-diabetic control rats (Dudek et al. 2017). In contrast, few studies have investigated diabetic female rats. The number of kisspeptin-, NKB-, and Dyn-ir cells in the ARC remained unchanged in female rats with diabetes induced by both STZ and HFD (Ziarniak et al. 2018). In another report, the number of Dyn-ir cells in the ARC was increased in diabetic female rats (Ziarniak et al. 2020). Additionally, Kiss1 mRNA expression in the whole hypothalamus was reduced 4 weeks after STZ injection in female rats with long-term diabetes (Castellano et al. 2009). No studies have examined the number of Kiss1-, Tac3-, and Pdyn mRNA-expressing cells in the ARC and Kiss1-expressing cells in the AVPV in diabetic female animals. In women, the onset mechanism of diabetic-induced irregular menstruation is not fully elucidated, so we aimed to determine whether hypothalamic kisspeptin, NKB, and Dyn neurons were involved in female infertility due to diabetes. Therefore, we conducted the first study to determine the mRNA expression of these neurons in the ARC and Kiss1 mRNA expression in the AVPV of STZ-induced diabetic female rats using in situ hybridization (ISH). Additionally, we measured the plasma levels of metabolic parameters as indicators of diabetes progression and investigated the relationships among the metabolic and reproductive parameters in these rats.
Materials and methods
Animals
The present study was approved by the Committee on Animal Research at Nippon Medical School. All experiments were performed according to the NIH Guide for the Care and Use of Laboratory Animals and approved by the Animal Care and Experimentation Committee at Nippon Medical School. Seven-week-old female Wistar-Imamichi rats (Institute for Animal Reproduction, Ibaraki, Japan) were housed in a controlled environment (14-h light:10-h darkness, 6:00 h lights on; 24°C ± 2°C; 50% humidity) with free access to food and water. Animals with at least two consecutive estrus cycles were used.
Experimental design
Experiment 1
To produce mild-to-severe diabetes models, diabetes in 9-week-old rats was induced by a single i.v. or intraperitoneal (i.p.) injection of STZ (Merck), which destroys pancreatic β cells. STZ was used at 60 or 80 mg/kg body weight (BW) in 0.01 M citrate buffer (pH 4.5) to create the following groups: ST60-i.v., ST60-i.p., ST80-i.v., and ST80-i.p. Non-diabetic control animals received i.v. or i.p. citrate buffer only, forming the C-i.v. and C-i.p. groups, respectively. The estrous stage was identified by daily vaginal lavage for 15 or 16 days 5 weeks after STZ injection. After vaginal smear observation, all animals underwent ovariectomy (OVX) and were immediately implanted with a silicon tube (1.57-mm inner diameter, 3.18-mm outer diameter, 25 mm in length; Dow Corning, Midland, MI, USA) filled with 20 μg/mL 17β-estradiol (E2, Sigma–Aldrich) in sesame oil (Sigma–Aldrich) to equalize the effect of ovarian steroids. The E2 concentration used in the present study was previously shown to be necessary to produce a negative feedback effect on LH release (Cagampang et al. 1991). One week after the surgery (at 17 weeks of age), the jugular vein blood was collected under isoflurane anesthesia (2–3% in air) and the animals were perfused with 4% paraformaldehyde (PFA) for ISH (Kiss1, Tac3, and Pdyn) and immunohistochemistry (IHC; kisspeptin). The blood samples were utilized for LH, glucose, 3-hydroxybutyrate (3HB), and non-esterified fatty acids (NEFA) assays. All images were captured with a light microscope (BX51; Olympus) equipped with a charge-coupled device camera (DP73; Olympus) adapted to the microscope. The number of mRNA-expressing or ir cells in the captured images was counted using NIH ImageJ software v1.49b (https://imagej.nih.gov/ij/). The total number of cells in the brain sections was also determined.
Experiment 2
A silicon cannula (0.5-mm inner diameter; 1-mm outer diameter; Shin-Etsu Polymer, Tokyo, Japan) was inserted into the right atrium of 8- to 9-week-old rats with intact ovaries. On the next day, approximately 150 μL of blood was collected through the cannula, followed by the injection of STZ (60 or 80 mg/kg BW) or citrate buffer. Approximately, 150 μL of blood was collected once daily (9:00–10:00 h) after STZ injection through the cannula until the clogging of the cannula, which prevented blood collection. Daily blood collection and drug injection were performed on freely moving conscious rats. BW and food and water intakes were measured daily, and the estrous stage was identified by daily vaginal lavage for 14 days after STZ injection. After vaginal smear observation, blood from the jugular vein was collected under isoflurane anesthesia, followed by perfusion with 4% PFA for ISH and IHC at the diestrus stage.
LH assay
The blood samples were immediately centrifuged, and the plasma was stored at −20°C. Plasma LH concentrations were measured using a rat-specific double-antibody RIA kit (National Hormone and Peptide Program, Baltimore, MD, USA). Values were expressed in terms of the National Institute of Diabetes and Digestive and Kidney Diseases rat LH RP-3. The minimum detectable level was 0.156 ng/mL in 50 μL plasma. The intra-assay coefficient of variation was 5.4% at 1.35 ng/mL. All samples (50 μL) were assayed in duplicate in a single assay.
Energy substrate assays
Commercial kits were used to determine plasma levels of glucose (Glucose C2; FUJIFILM Wako Pure Chemical Corporation), 3HB (3-Hydroxybutyrate Assay Kit; Serotec, Sapporo, Japan), and NEFA (NEFA C; FUJIFILM Wako Pure Chemical Corporation). The plasma samples (glucose, 1.5 μL; NEFA, 5 μL; 3HB, 6.4 μL) were mixed with the reagents supplied with the kits. Glucose and NEFA were measured using a microplate absorbance reader (iMark; Bio-Rad). 3HB levels were measured using a multimode microplate reader (FilterMax F5; Molecular Devices, San Jose, CA, USA). All samples were assayed in duplicate in a single assay.
Plasma E2 assay
A commercial estradiol ELISA kit (Cayman Chemical) was used to determine plasma E2 levels. Briefly, 100 μL of plasma and standard samples were extracted three times using diethyl ether and dissolved in 100 μL of assay buffer. The extracted samples were assayed in duplicate according to the kit instructions.
Tissue preparation
After blood sample collection under isoflurane anesthesia, the rats were additionally anesthetized with a mixture of midazolam, butorphanol tartrate, and medetomidine hydrochloride. The rats were transcardially perfused with saline solution followed by 4% PFA in 0.1 M phosphate buffer (pH 7.4). The excised brains were immersed in the same fixative at 4°C overnight and then in 0.05 M phosphate buffer containing 20% sucrose at 4°C for 3 days for cryoprotection. Serial coronal sections (50-μm thick) were cut using a cryostat (CM3050 S; Leica) and divided into two series in the AVPV, from approximately −0.6 to 0.6 mm posterior to the bregma, and into four series in the ARC, from approximately 1.56 to 4.36 mm posterior to the bregma (Paxinos & Watson 2006). Each brain section series included approximately 14 and 16 sections in the AVPV and ARC, respectively.
ISH for Kiss1, Tac3, and Pdyn
Free-floating ISH was performed to detect Kiss1, Tac3, and Pdyn mRNA, as previously described (Adachi et al. 2007, Kunimura et al. 2017). Digoxigenin (DIG)-labeled antisense complementary RNA probes were synthesized for Kiss1 (position 39–527; GenBank accession no. XM_017598697) (Minabe et al. 2021), Tac3 (position 180–483; GenBank accession no. NM019162) (Mostari et al. 2013, Minabe et al. 2021), and Pdyn (position 315–731; GenBank accession no. NM019374) (Mostari et al. 2013, Minabe et al. 2021) using a DIG RNA Labeling Kit (Roche Diagnostics). Briefly, the sections were hybridized overnight with each probe (1 μg/mL) at 60°C. The next day, after washing, the sections were treated with 20 μg/mL RNase A for 30 min at 37°C, washed, incubated with alkaline phosphatase-conjugated anti-DIG antibody (1:1000, Roche Diagnostics) for 1 h at 37°C, and stained with NBT/BCIP Stock Solution (1:50, Roche Diagnostics) for 1 h at room temperature.
IHC for kisspeptin
Free-floating IHC was performed to detect kisspeptin, as previously described (Kunimura et al. 2017). Briefly, the sections were incubated overnight with mouse monoclonal anti-kisspeptin antibody (1:5000; Cat# 254, RRID: AB_2636957; kindly provided by Takeda Pharmaceutical Company, Osaka, Japan) (Kinoshita et al. 2005) and 5% normal rabbit serum in PBS with Tween 20 at 4°C. On the next day, the sections were treated with kit reagents (Histofine SAB-PO kit; Nichirei Biosciences, Tokyo, Japan) and stained with 3,3′-diaminobenzidine tetrahydrochloride (0.5 mg/mL, Sigma–Aldrich) in 0.01% H2O2. The same procedure was used for IHC controls without the specific primary antibody, and the absence of non-specific binding was confirmed (Murakawa et al. 2016).
Statistical analysis
All data were expressed as mean ±s.e. of the mean. Comparisons among the i.v. or i.p. groups were assessed by one-way ANOVA followed by Tukey’s test. Daily changes in the plasma metabolic markers were determined by one-way ANOVA followed by Tukey’s test. Changes in BW and food and water intakes were determined by two-way ANOVA (group and week) followed by Bonferroni post hoc test. P-values of <0.05 were considered statistically significant.
A principal component analysis was performed using the prcomp command in R statistical software v3.5.3 (R Core Team 2019). The data comprised all results of the study, namely 39 samples (C-i.p., n = 10; ST60-i.p., n = 3; ST80-i.p., n = 6; C-i.v., n = 5; ST60-i.v., n = 8; ST80-i.v., n = 7) and 12 variables (BW; ovarian weight; percentage of diestrus during smear observation; plasma levels of LH, glucose, 3HB (ketone body), and NEFA; number of Kiss1-, Tac3-, and Pdyn-expressing cells; number of kisspeptin-ir cells in the ARC; and number of Kiss1 cells in the AVPV). A dataset of 12 variables was obtained from a rat. The two variables (diestrus (%) and ovary weight) were obtained in intact rats, whereas the remaining variables were obtained after OVX+E2. Ovarian weight was measured at the time of OVX. Data on the percentage of diestrus were obtained during the 15- to 16-day period immediately before OVX. Data from two rats in ST60-i.p. were excluded due to the lack of Tac3 and Pdyn results.
Results
Reproductive parameters of ovary-intact diabetic rats
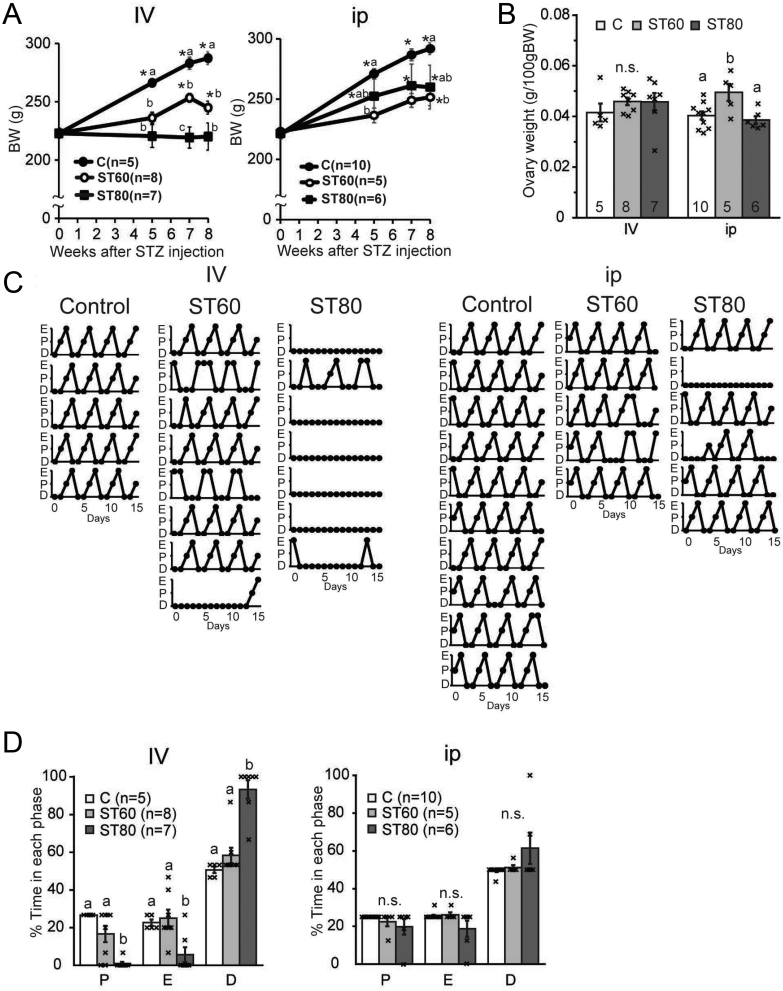
In the i.v. group, the BW of ST80-i.v. and ST60-i.v. was significantly lower than C-i.v. after the STZ injection (Fig. 1A). In the i.p. group, the BW of ST60-i.p. was significantly different from C-i.p. (Fig. 1A). The ovarian weight (g/100 g BW) was not significantly different among the i.v. group rats. In the i.p. group, the ovarian weight in ST60-i.p. was higher than in C-i.p. and ST80-i.p. (Fig. 1B).
Figure 1.
Reproductive parameters of ovary-intact diabetic rats. (A) Body weight (BW) after intravenous (i.v.; left) or intraperitoneal (i.p., right) administration of streptozotocin (STZ; 60 mg/kg BW, ST60; 80 mg/kg BW, ST80; non-diabetic control, C). Statistical differences were determined by two-way ANOVA (group and week), followed by Bonferroni correction. There was a significant interaction between the two factors (group and week) in i.v. and i.p. groups. Values with different letters and asterisks show significant BW differences at each week and vs BW just before STZ injection, respectively (P < 0.05). (B) Ovary weight (g/100 g BW) 7 weeks after STZ injection. (C) Cytological profiles of vaginal lavage of all animals. The estrous cycle phase was determined by the major cell population in the vaginal smear: proestrus (P), estrus (E), and diestrus (D). (D) Proportion of each phase in the estrous cycle. Statistical differences were determined by one-way ANOVA followed by Tukey’s test (B, D). Values with different letters are significantly different among each group (P < 0.05). Numbers in each column or in parentheses represent the number of rats examined. Values are expressed as mean ±s.e. of the mean. Marks in each bar graph show individual values. n.s., not significant.
Regarding the i.v. group, almost all rats in ST80-i.v. showed persistent diestrus; five of seven rats exhibited diestrus on all days during the vaginal smear observation (Fig. 1C). The duration of the diestrus stage was significantly extended in ST80-i.v. compared with C-i.v. and ST60-i.v. (Fig. 1D). In ST60-i.v., three rats showed irregular estrous cycles (Fig. 1C). No significant differences were observed among the estrous cycles of the i.p. group rats (Fig. 1D). However, two of six rats in ST80-i.p. showed irregular estrous cycles (Fig. 1C).
Expression of KNDy neurons in the ARC and Kiss1 neurons in the AVPV in E2-treated ovariectomized rats
To determine whether diabetes-induced irregular estrous cycle was caused by hypothalamic dysfunction rather than ovarian dysfunction, E2-treated ovariectomized rats were used to equalize the effects of endogenous steroid hormones, given that the expression of kisspeptin, NKB, and Dyn in the hypothalamus is affected by sex steroid hormones.
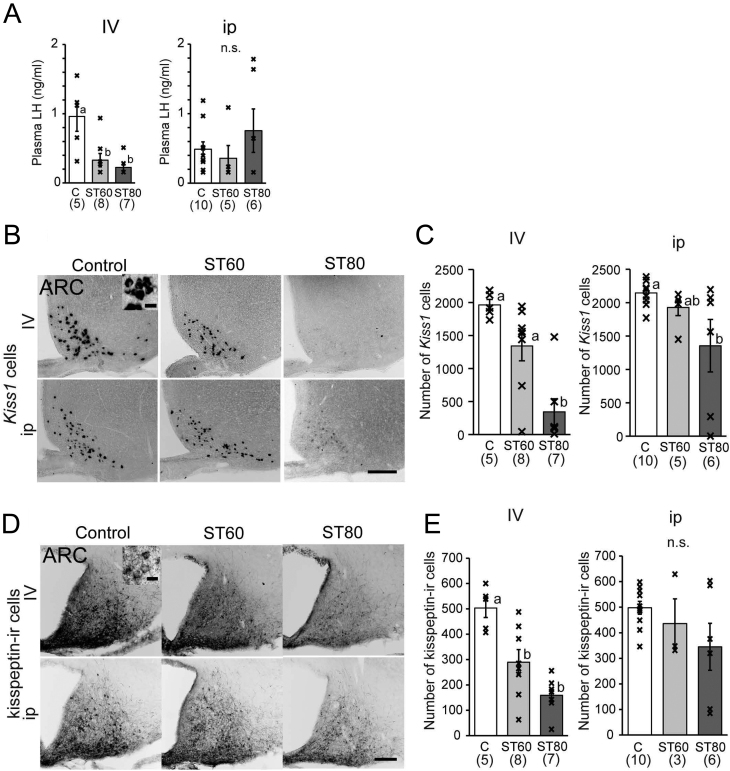
Plasma LH levels were significantly lower in ST60-i.v. and ST80-i.v. rats than in C-i.v. rats that underwent OVX treatment and received E2 (Fig. 2A). On the other hand, plasma LH levels were not significantly different among the i.p. group rats (Fig. 2A). However, the LH levels of two rats with irregular estrous cycles in ST80-i.p. were lower than the minimum detectable level.
Figure 2.
Expression of Kiss1 by ISH and kisspeptin by IHC in the arcuate nucleus (ARC) of E2-treated ovariectomized rats. (A) Luteinizing hormone (LH) levels after OVX and E2 treatment. (B, C) Representative photos and the number of Kiss1 mRNA-expressing cells in the ARC. (D, E) Representative images and the number of kisspeptin-immunoreactive (ir) cells in the ARC. Scale bar = 200 μm. Two insets show higher magnification of certain cells. Scale bar of insets = 20 μm. Numbers in parentheses under each column represent the number of rats examined. Values with different letters are significantly different among each group (P < 0.05, one-way ANOVA followed by Tukey’s test). Values are expressed as mean ±s.e. of the mean. Marks in each bar graph show individual values. n.s., not significant.
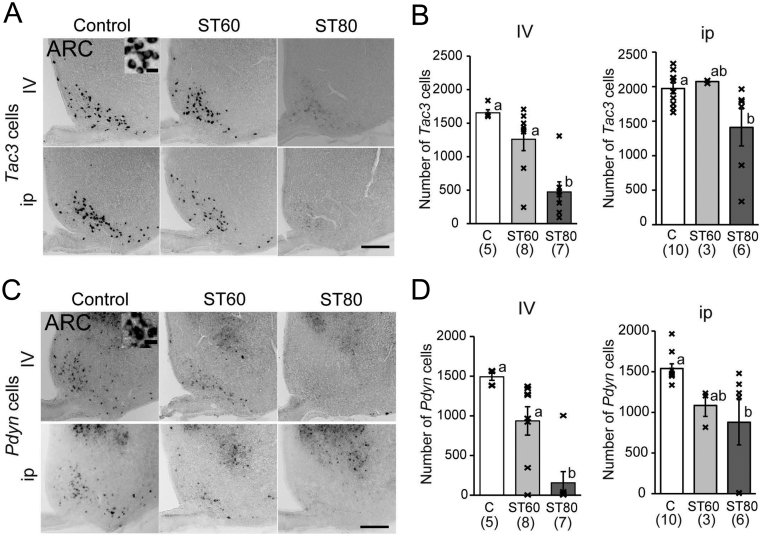
Regarding the ARC, the number of Kiss1 mRNA-expressing cells in the ARC was significantly decreased in ST80-i.v. compared with C-i.v. and ST60-i.v. (Fig. 2B and C). In the i.p. group, the number of Kiss1 cells in ST80-i.p. was also significantly lower than in C-i.p. (Fig. 2B and C). Kisspeptin-ir cells in the ARC were significantly decreased in ST80-i.v. and ST60-i.v. compared with C-i.v. (Fig. 2D and E). However, there were no significant differences in kisspeptin-ir cells among the i.p. group rats (Fig. 2D and E). The number of Tac3 and Pdyn cells in the ARC was significantly decreased in ST80-i.v. relative to C-i.v. and ST60-i.v. (Fig. 3A, B, C and D). No significant differences in Tac3 and Pdyn cells were observed between ST60-i.v. and C-i.v., but one rat with persistent diestrus in ST60-i.v. showed profound decreases in Kiss1, Tac3, Pdyn, and kisspeptin-ir cells in the ARC. Another rat of ST60-i.v. also showed decreases in Kiss1, Tac3, and Pdyn cells, but it experienced regular estrous cycles. In the i.p. group, the number of Tac3 and Pdyn cells in ST80-i.p. was significantly lower than in C-i.p. (Fig. 3A, B, C and D). Two rats with irregular estrous cycles in ST80-i.p. exhibited profound decreases in Kiss1, Tac3, Pdyn, and kisspeptin-ir cells in the ARC.
Figure 3.
Expression of Tac3 and Pdyn by ISH in the arcuate nucleus (ARC) in E2-treated ovariectomized rats. (A, B) Representative photos and the number of Tac3 mRNA-expressing cells in the ARC. (C, D) Representative images and the number of Pdyn mRNA-expressing cells in the ARC. Scale bar = 200 μm. Two insets show higher magnification of certain cells. Scale bar of insets = 20 μm. Numbers in parenthesis under each column represent the number of rats examined. Values with different letters are significantly different among each group (P < 0.05, one-way ANOVA followed by Tukey’s test). Values are expressed as mean ±s.e. of the mean. Marks in each bar graph show individual values.
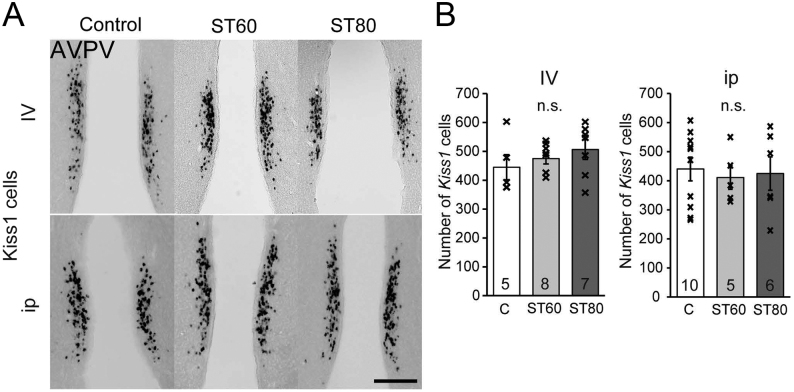
In contrast to the ARC, the number of Kiss1 cells in the AVPV, which induce an LH surge, did not differ significantly among each group (Fig. 4).
Figure 4.
Expression of Kiss1 by ISH in the anteroventral periventricular nucleus (AVPV) of E2-treated ovariectomized rats. (A, B) Representative photos and the number of Kiss1 mRNA-expressing cells in the AVPV. Scale bar = 200 μm. Numbers in each column represent the number of rats examined. Comparisons among each group were assessed by one-way ANOVA followed by Tukey’s test (P < 0.05). Values are expressed as mean ±s.e. of the mean. Marks in each bar graph show individual values. n.s., not significant.
Plasma metabolic parameters in E2-treated ovariectomized rats
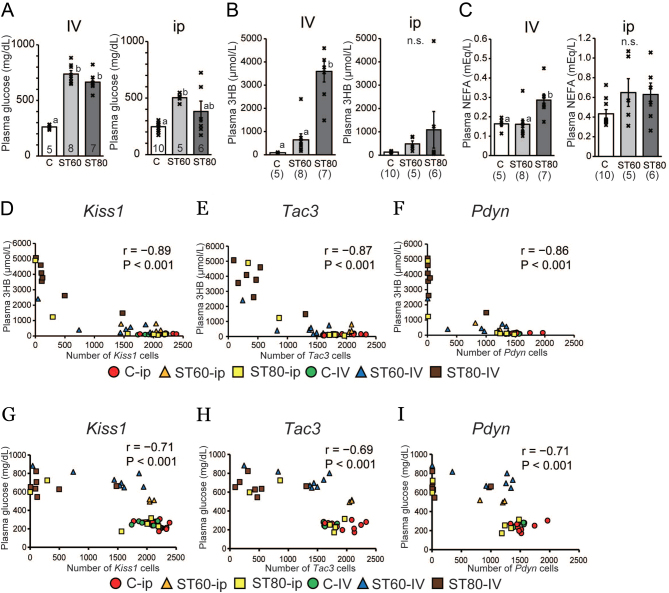
Plasma glucose, 3HB, and NEFA levels were measured to evaluate diabetes progression. Plasma glucose levels were significantly higher in ST60-i.v. and ST80-i.v. than in C-i.v. (Fig. 5A). In the i.p. group, glucose levels were higher in ST60-i.p. than in C-i.p. (Fig. 5A). Plasma 3HB levels were significantly higher in ST80-i.v. than in ST60-i.v. and C-i.v. (Fig. 5B). Although a significant difference in 3HB was not observed between ST60-i.v. and C-i.v., mean 3HB levels were higher in ST60-i.v. than in C-i.v. (647 ± 259.9 vs 87 ± 5.8 μmol/L). There was no difference in plasma 3HB levels among the i.p. group rats (Fig. 5B); however, plasma 3HB levels tended to be higher in ST60-i.p. than in C-i.p. (487 ± 125.9 vs 136 ± 10.2 μmol/L). Plasma NEFA levels were significantly increased in ST80-i.v. compared with C-i.v. and ST60-i.v. and did not significantly differ among the i.p. group rats (Fig. 5C). Interestingly, the two rats in ST80-i.p. that showed irregular estrous cycles and low LH levels exhibited hyperglycemia (>500 mg/dL), severe ketosis (>1000 μmol/L), and high NEFA concentrations (the highest two values in ST80-i.p.). One rat with persistent diestrus in ST60-i.v. also exhibited low LH levels below the minimum detectable level, hyperglycemia (>800 mg/dL), and severe ketosis (>2000 μmol/L).
Figure 5.
Metabolic parameters in the plasma of E2-treated ovariectomized rats and the relationship of KNDy neurons expressing kisspeptin, NKB, and Dyn in the ARC with plasma 3-hydroxybutyrate, glucose, and non-esterified fatty acid levels. (A, B and C) Levels of energy substrates in plasma samples (A: glucose; B: 3-hydroxybutyrate (3HB); C: non-esterified fatty acids (NEFA)). Blood samples were collected under anesthesia immediately before paraformaldehyde perfusion and immediately centrifuged for plasma collection. Statistical differences were determined by one-way ANOVA followed by Tukey’s test (A, B, and C). Values with different letters are significantly different among each group (P < 0.05). Numbers in each column or parentheses represent the number of rats examined. Values are expressed as mean ±s.e. of the mean. Marks in each bar graph show individual values. n.s., not significant. (D, E, and F) Plasma 3HB levels were used as an indicator of diabetes progression. Note the correlation between plasma 3HB levels and the number of Kiss1-(D), Tac3-(E), and Pdyn-expressing (F) cells in non-diabetic and diabetic rats. r, Pearson’s product–moment correlation coefficient. (G, H, and I) Correlation between plasma glucose levels and the number of Kiss1-(G), Tac3-(H), and Pdyn-expressing (I) cells in non-diabetic and diabetic rats.
We also investigated the correlation between KNDy neurons in the ARC and plasma metabolic parameters as indicators of diabetes progression. The number of KNDy cells was strongly and negatively correlated with 3HB and glucose (Fig. 5D, E, F, G, H and I). Importantly, the negative correlation of KNDy neurons with 3HB was stronger than that with glucose (correlation coefficients: 3HB, from −0.86 to −0.89; glucose, from −0.69 to −0.71).
The relationship among metabolic/reproductive parameters
We performed a principal component analysis to reveal relationships among variables and among groups. The first component (PC1) accounted for 57.4% of the total variation. Diestrus (%), glucose, and ketone bodies were generally correlated in approximately 60% of the total variation (Fig. 6A). These three variables were also strongly correlated with PC1. BW; ARC Kiss1, Tac3, Pdyn, and kisspeptin-ir cells; and LH were correlated in approximately 60% of the total variation. These six variables were strongly negatively correlated with the PC1. Additionally, the three variables and the six variables, respectively, were perfectly, oppositely correlated (Fig. 6A). Thus, the score values on PC1 increased with increases in the percentage of diestrus, plasma levels of glucose, and 3HB and also increased with decreases in the number of Kiss1, Tac3, Pdyn, and kisspeptin-ir cells in the ARC; BW; and plasma LH. Thus, the scores on PC1 were considered to reflect the development of diabetes. In contrast, ovary weight, NEFA, and AVPV Kiss1 cells, whose loadings were close to zero on PC1, hardly influenced the PC1 (Fig. 6A).
Figure 6.
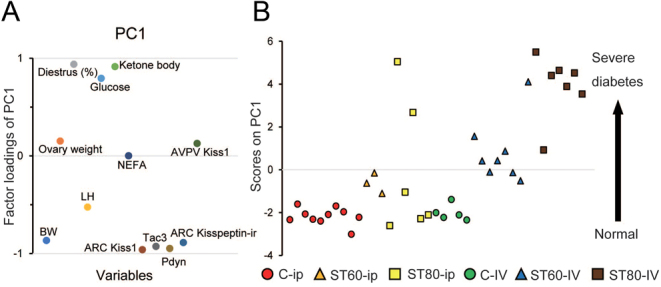
Principal component analysis. The data consist of 39 samples and 12 variables (body weight (BW); ovary weight; the percentage of diestrus throughout the smear observation; luteinizing hormone (LH); glucose; a ketone body (3-hydroxybutyrate); non-esterified fatty acids (NEFA); arcuate nucleus (ARC) Kiss1, Tac3, Pdyn, and kisspeptin-immunoreactive (ir) cells; and anteroventral periventricular nucleus (AVPV) Kiss1). (A) Scatter plot of factor loadings of the first component (PC1). Factor loadings range from 1 to −1. Factor loadings close to −1 or 1 indicate that the variables strongly influence PC1. Factor loadings close to zero indicate that the variables weakly influence the PC1. The PC1 accounts for 57.4% of the total variation. (B) Scatter plot of the 39 score values (C-i.p., n = 10; ST60-i.p., n = 3; ST80-i.p., n = 6; C-i.v., n = 5; ST60-i.v., n = 8; ST80-i.v., n = 7) in PC1. As diabetes severity progresses, scores on PC1 become higher and are plotted toward the top of the plot.
Figure 6B shows the scatter plot of the 39 score values on PC1. The score values were plotted toward the top of the plot with the progression of diabetes. The scores of almost all rats in ST80-i.v., one rat in ST60-i.v., and two rats in ST80-i.p. were very high, suggesting that diabetes could likely develop in these animals. The scores of most rats in ST60-i.v. and one rat in ST80-i.v. were lower than those of the high-score rats but higher than the control rats (Fig. 6B). Thus, these rats could show moderate diabetes. The scores of all rats in ST60-i.p., one rat in ST80-i.p., and a few rats in ST60-i.v. were slightly higher than the control rats, suggesting that these animals might have developed a mild disease. Surprisingly, the scores of three rats in ST80-i.p. were almost equal to the control rats, suggesting that a single i.p. injection of STZ might not have affected these animals. In the i.v. group, diabetes appeared to have developed in a dose-dependent manner according to the amount of STZ that was administered. However, the i.p. group showed no relationship between the STZ dosage and diabetes progression.
Changes in metabolic/reproductive parameters 14 days after STZ injection
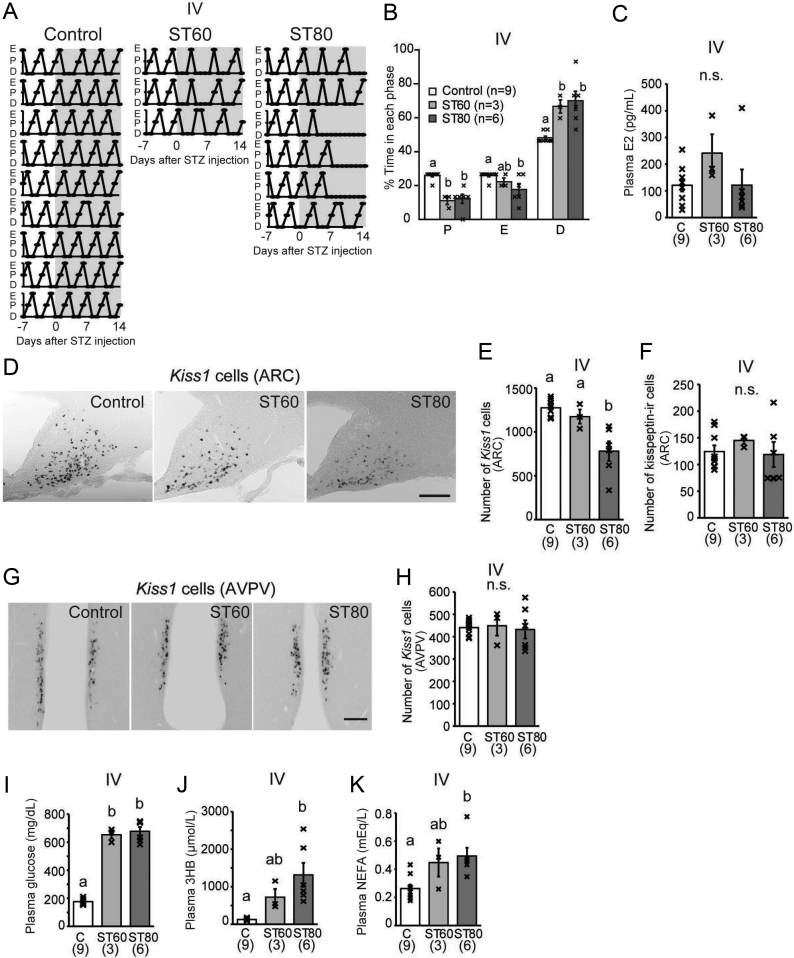
The vaginal smears, which were checked daily after i.v. STZ injection to determine the development of irregular estrous cyclicity in STZ-induced diabetic rats, revealed unclear proestrus – i.e. the major cell population in the vaginal smear was nucleated cells and leucocytes – in ST60-i.v. and ST80-i.v. rats 3–5 days after STZ injection (Fig. 7A). The duration of diestrus was significantly longer in ST80-i.v. and ST60-i.v. compared with C-i.v. (Fig. 7B). Further, three out of six rats in ST80-i.v. exhibited persistent diestrus within 14 days after STZ injection. There were no significant differences in plasma E2 concentrations among the three groups (Fig. 7C).
Figure 7.
Reproductive parameters of ovary-intact rats 2 weeks after i.v. streptozotocin (STZ) injection. (A) Cytological profiles of vaginal lavage of all animals. STZ was injected on day 0 (C: non-diabetic control; ST60: STZ at 60 mg/kg BW; ST80: STZ at 80 mg/kg BW). The estrous cycle phase was determined based on the major cell population in the vaginal smear: proestrus (P), estrus (E), and diestrus (D). Diestrus was considered when the major cell population in the vaginal smear was nucleated cells and leucocytes such as unclear proestrus. (B) Proportion of each phase in the estrous cycle. (C) Plasma concentrations of estradiol (E2). (D and E) Representative images and the number of Kiss1 mRNA-expressing cells in the arcuate nucleus (ARC). (F) The number of kisspeptin-immunoreactive (ir) cells in the ARC. (G and H) Representative images and the number of Kiss1 mRNA-expressing cells in the anteroventral periventricular nucleus (AVPV). Scale bar = 200 μm. (I, J, and K) Energy substrates in plasma samples; (I) glucose, (J) 3-hydroxybutyrate (3HB), and (K) non-esterified fatty acids (NEFA). Numbers in parentheses under each column represent the number of rats examined. Values with different letters are significantly different among each group (P < 0.05, one-way ANOVA followed by Tukey’s test), (B, C, E, F, H, I, J, and K). Values are expressed as mean ± s.e. of the mean. Marks in each bar graph show individual values. n.s., not significant. Brains (D, E, F, G, and H) and plasma (C, I, J and K) were collected under anesthesia 2 weeks after STZ injection at diestrus stage.
Kiss1 expression in ovary-intact animals was evaluated 2 weeks after STZ injection. The number of Kiss1 mRNA-expressing cells in the ARC was significantly decreased in ST80-i.v. compared with C-i.v. and ST60-i.v. (Fig. 7D and E). However, there was no significant difference in kisspeptin-ir cells in the ARC among the three groups (Fig. 7F). In the AVPV, there were no significant differences in the number of Kiss1 mRNA-expressing cells among the three groups (Fig. 7G and H). Plasma glucose levels 2 weeks after STZ injection (the day of perfusion) were significantly higher in ST60-i.v. and ST80-i.v. than in C-i.v. (Fig. 7I). Plasma 3HB and NEFA levels were significantly higher in ST80 than in C-i.v. (Fig. 7J and K).
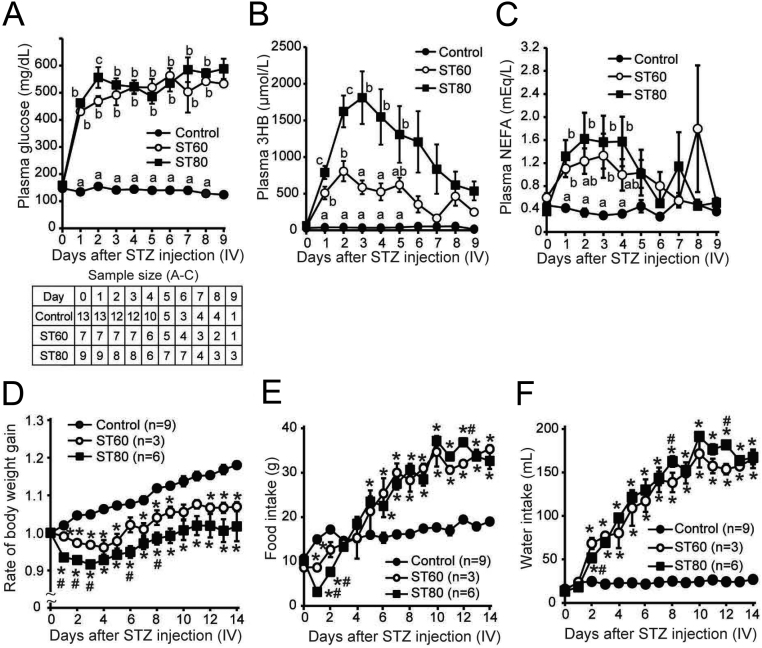
The analysis of daily changes in the plasma levels of glucose, 3HB, and NEFA after STZ injection revealed that they were significantly higher in ST60-i.v. and ST80-i.v. than in C-i.v. on the day after STZ injection, i.e. day 1 (Fig. 8A, B and C). The rate of BW gain was lower in ST80-i.v. than in C-i.v. on day 1 and thereafter (Fig. 8D). Food intake was significantly increased on days 6 and 5 in ST60-i.v. and ST80-i.v., respectively, compared with C-i.v. (Fig. 8E). Water intake on day 2 was significantly higher in ST60-i.v. and ST80-i.v. than in C-i.v. (Fig. 8F).
Figure 8.
Daily changes in metabolic parameters after i.v. streptozotocin (STZ) injection. (A–C): Levels of energy substrates in plasma (A: glucose; B: 3-hydroxybutyrate (3HB); C: non-esterified fatty acids (NEFA)). Daily blood samples were collected from the jugular vein catheter of freely moving conscious rats. Statistical differences were determined by one-way ANOVA followed by Tukey’s test (A, B, and C). Values with different letters are significantly different among each group (P < 0.05). Values are expressed as mean ±s.e. of the mean. The accompanying table shows the sample size for data presented in A–C. (D) The rate of body weight gain. (E) Food intake. (F) Water intake. Statistical differences were determined by two-way ANOVA (group and day), followed by Bonferroni correction (D, E, and F). There was a significant interaction between the two factors (group and days), and the main effect of each factor (group or days) was statistically significant (D, E, and F). *P < 0.05, vs control. #P < 0.05, vs ST60.
Discussion
In this study, rats of ST80-i.v. showed severe diabetes with hyperglycemia and severe ketosis. Plasma NEFA levels in these animals were significantly higher than in the control group, indicating increased lipolysis and fatty acid oxidation. Additionally, these animals exhibited persistent diestrus, low levels of plasma LH, and the suppression of Kiss1, Tac3, and Pdyn mRNA expression in the ARC. A few animals in ST60-i.v. and ST80-i.p. with severe diabetes also exhibited suppression of these genes. These results suggest that severe diabetes induces the suppression of Kiss1, Tac3, and Pdyn expression in the ARC, which could lead to low plasma LH levels and persistent diestrus. A study showed that kisspeptin injection induced LH release in STZ-induced diabetic female rats, which exhibited decreased serum LH levels and decreased Kiss1 expression in the whole hypothalamus (Castellano et al. 2009). In male rats with STZ-induced diabetes, which exhibited decreased serum LH and testosterone levels and reduced prostate weight, repeated kisspeptin administration induced persistent increases in circulating LH and testosterone levels and rescued the decrease in prostate and testis weights (Castellano et al. 2006). Female rats with >90% Kiss1 knockout in the ARC exhibited suppressed pulsatile LH release and the rescue of >20% KNDy neurons recovered pulsatile LH release and follicular development in female rates with global Kiss1 knockout (Nagae et al. 2021). Therefore, kisspeptin neurons in the ARC are considered to be associated with low LH levels in diabetic rats.
ST60-i.v. rats showed hyperglycemia and moderate ketosis compared with the controls, but the number of Kiss1-, Tac3-, and Pdyn-expressing cells in the ARC did not differ from the controls. In contrast, kisspeptin-ir cells in the ARC were decreased in ST60-i.v. relative to the controls, suggesting that translation was suppressed in ARC kisspeptin neurons rather than the suppression of mRNA expression, which might have led to low plasma LH levels. However, most of the ST60-i.v. rats showed normal estrous cycles. In this study, plasma samples for LH assay were collected at one timepoint, not as a series of samples over a period of time, so pulsatile LH secretion may not be completely inhibited in ST60-i.v. rats.
With the exception of two rats in ST80-i.p. with severe diabetes, most rats in ST80-i.p. and ST60-i.p exhibited hyperglycemia and mild ketosis relative to the control group, while several rats showed the same levels of glucose and 3HB as the control group. The expression of Kiss1, Tac3, and Pdyn cells in the ARC was significantly decreased in ST80-i.p. relative to the control group; these results appear to be due to the inclusion of the results of the two rats with severe diabetes. In ST60-i.p., the expression of Kiss1, Tac3, and Pdyn cells in the ARC was unaffected compared with the control group. It has been previously reported that diabetes induction in female rats by both STZ and an HFD did not affect the number of kisspeptin-, NKB-, and Dyn-ir cells in the ARC (Ziarniak et al. 2018). Thus, mild diabetes may not affect the hypothalamic–pituitary–gonadal (HPG) axis. In another study, the number of Dyn-ir cells in the ARC was increased in diabetic female rats induced by both STZ and an HFD (Ziarniak et al. 2020), suggesting that Dyn release may be inhibited by diabetes, resulting in Dyn accumulation in the cell bodies, which can be detected by IHC. These results suggest that the transcription and translation of Kiss1, Tac3, and Pdyn genes in the ARC could be suppressed in proportion to the severity of diabetes, leading to female infertility. However, evidence for a causal relationship between KNDy neurons and female diabetic infertility requires further elucidation.
This is the first study to demonstrate Kiss1 expression in the AVPV of diabetic female rats. In contrast to the ARC, the number of Kiss1 cells in the AVPV did not differ among the members in both the i.v. and i.p. groups, so the expression of Kiss1 mRNA in the AVPV may be unaffected by diabetes. In agreement with this study, the number of AVPV Kiss1 cells of other pathological model rats was the same as that of control groups under OVX and E2 treatment, while ARC Kiss1 expression was decreased in the models (Iwata et al. 2017, Nakao et al. 2018). Thus, AVPV kisspeptin neurons could respond to estrogen even if ARC kisspeptin neurons were suppressed by metabolic stress and sex steroid hormones. Further studies are necessary to clarify whether an LH surge is induced by estrogen treatment in severely diabetic female rats.
We also found changes in the levels of metabolic/reproductive parameters during the 2-week period after i.v. STZ injection. The rapid changes in metabolic parameters after STZ injection were followed by polydipsia, with a subsequent increase in food intake. Surprisingly, the estrus cycle exhibited unclear proestrus within a few days after STZ injection, and Kiss1 expression in the ARC was suppressed in ovary-intact diabetic rats 2 weeks after STZ injection. Previous studies reported that serum testosterone levels were decreased in diabetic male rats 1 week after STZ injection (Castellano et al. 2009). Therefore, the suppression of Kiss1, Tac3, and Pdyn expression in severely diabetic rats 8 weeks after STZ injection observed in the present study might be rapidly induced by STZ administration and might not be a gradual induction in proportion to the severity of diabetes.
To our knowledge, this is the first study to document the relationship between plasma ketone body levels and the hypothalamic neurons regulating reproductive function. In clinical studies, women with type 1 diabetes (T1DM) exhibited an increase in the overall prevalence of menstrual disturbances compared with non-diabetic women (Kjaer et al. 1992, Yeshaya et al. 1995), and women diagnosed with T1DM before menarche had a higher probability of delayed menarche (Yeshaya et al. 1995). Additionally, women with T1DM and secondary amenorrhea had fewer LH pulses than non-diabetic women but responded to exogenous GnRH (South et al. 1993). However, to the best of our knowledge, no study to date has examined the relationship between ketosis/ketoacidosis/hyperketonemia and the hypothalamic neurons regulating reproductive function. In the present study, the ARC KNDy neurons were suppressed at 2 and 8 weeks after STZ treatment in severely diabetic rats with elevated levels of both 3HB and NEFA. Moreover, plasma 3HB levels exhibited a stronger negative correlation with KNDy neurons compared with glucose, although plasma glucose concentrations are often used as a major criterion for diabetes in animal models. Hence, plasma ketone body concentration might be a useful indicator for hypothalamic disruption in women with diabetes.
In conclusion, this study showed that KNDy neurons in the ARC were suppressed in proportion to diabetes severity. In contrast, the mRNA expression of AVPV kisspeptin neurons, which induce the preovulatory GnRH/LH surge, was unaffected by diabetes regardless of the disease progression. Thus, diabetes in females could negatively affect KNDy neurons in the ARC-regulating pulsatile LH secretion in proportion to diabetes progression, which might lead to menstrual disorder and infertility. Additionally, diabetes-induced changes in the HPG axis may vary depending on the severity of diabetes, suggesting that the severity of diabetes should be considered in the investigation of neurological problems.
Declaration of interest
The authors declare that there is no conflict of interest that could be perceived as prejudicing the impartiality of the research reported.
Funding
This work was supported by a Grant-in-Aid (grant number 18K06860) to H O from the Japan Society for the Promotion of Science, Nippon Medical School Grant-in-Aid for Medical Research.
Author contribution statement
H E performed experiments and wrote the manuscript. K I conceived the study, analyzed the data, and wrote and edited the manuscript. K M and M O performed experiments. A M and H O reviewed and edited the manuscript.
Acknowledgements
The authors are grateful to Takeda Pharmaceutical Company Limited for providing a MAB for kisspeptin. The authors thank Enago (www.enago.jp) for the English language review.
References
- Adachi S, Yamada S, Takatsu Y, Matsui H, Kinoshita M, Takase K, Sugiura H, Ohtaki T, Matsumoto H, Uenoyama Yet al. 2007Involvement of anteroventral periventricular metastin/kisspeptin neurons in estrogen positive feedback action on luteinizing hormone release in female rats. Journal of Reproduction and Development 53367–378. ( 10.1262/jrd.18146) [DOI] [PubMed] [Google Scholar]
- Cagampang FR, Maeda KI, Tsukamura H, Ohkura S, Ota K.1991Involvement of ovarian steroids and endogenous opioids in the fasting-induced suppression of pulsatile LH release in ovariectomized rats. Journal of Endocrinology 129321–328. ( 10.1677/joe.0.1290321) [DOI] [PubMed] [Google Scholar]
- Castellano JM, Navarro VM, Fernández-Fernández R, Roa J, Vigo E, Pineda R, Dieguez C, Aguilar E, Pinilla L, Tena-Sempere M.2006Expression of hypothalamic KiSS-1 system and rescue of defective gonadotropic responses by kisspeptin in streptozotocin-induced diabetic male rats. Diabetes 552602–2610. ( 10.2337/db05-1584) [DOI] [PubMed] [Google Scholar]
- Castellano JM, Navarro VM, Roa J, Pineda R, Sánchez-Garrido MA, García-Galiano D, Vigo E, Dieguez C, Aguilar E, Pinilla Let al. 2009Alterations in hypothalamic KiSS-1 system in experimental diabetes: early changes and functional consequences. Endocrinology 150784–794. ( 10.1210/en.2008-0849) [DOI] [PubMed] [Google Scholar]
- Dudek M, Kołodziejski PA, Pruszyńska-Oszmałek E, Sassek M, Ziarniak K, Nowak KW, Sliwowska JH.2016Effects of high-fat diet-induced obesity and diabetes on Kiss1 and GPR54 expression in the hypothalamic-pituitary-gonadal (HPG) axis and peripheral organs (fat, pancreas and liver) in male rats. Neuropeptides 5641–49. ( 10.1016/j.npep.2016.01.005) [DOI] [PubMed] [Google Scholar]
- Dudek M, Kołodziejski PA, Pruszyńska-Oszmałek E, Ziarniak K, Sliwowska JH.2017Effects of orchidectomy and testosterone replacement on numbers of kisspeptin-, neurokinin B-, and dynorphin A-immunoreactive neurones in the arcuate nucleus of the hypothalamus in obese and diabetic rats. Journal of Neuroendocrinology 29. ( 10.1111/jne.12453) [DOI] [PubMed] [Google Scholar]
- Gandhi J, Dagur G, Warren K, Smith NL, Sheynkin YR, Zumbo A, Khan SA.2017The role of diabetes mellitus in sexual and reproductive health: an overview of pathogenesis, evaluation, and management. Current Diabetes Reviews 13573–581. ( 10.2174/1573399813666161122124017) [DOI] [PubMed] [Google Scholar]
- Iwata K, Kunimura Y, Matsumoto K, Ozawa H.2017Effect of androgen on Kiss1 expression and luteinizing hormone release in female rats. Journal of Endocrinology 233281–292. ( 10.1530/JOE-16-0568) [DOI] [PubMed] [Google Scholar]
- Kanaya M, Iwata K, Ozawa H.2017Distinct dynorphin expression patterns with low- and high-dose estrogen treatment in the arcuate nucleus of female rats. Biology of Reproduction 97709–718. ( 10.1093/biolre/iox131) [DOI] [PubMed] [Google Scholar]
- Kinoshita M, Tsukamura H, Adachi S, Matsui H, Uenoyama Y, Iwata K, Yamada S, Inoue K, Ohtaki T, Matsumoto Het al. 2005Involvement of central metastin in the regulation of preovulatory luteinizing hormone surge and estrous cyclicity in female rats. Endocrinology 1464431–4436. ( 10.1210/en.2005-0195) [DOI] [PubMed] [Google Scholar]
- Kjaer K, Hagen C, Sandø SH, Eshøj O.1992Epidemiology of menarche and menstrual disturbances in an unselected group of women with insulin-dependent diabetes mellitus compared to controls. Journal of Clinical Endocrinology and Metabolism 75524–529. ( 10.1210/jcem.75.2.1639955) [DOI] [PubMed] [Google Scholar]
- Kunimura Y, Iwata K, Ishigami A, Ozawa H.2017Age-related alterations in hypothalamic kisspeptin, neurokinin B, and dynorphin neurons and in pulsatile LH release in female and male rats. Neurobiology of Aging 5030–38. ( 10.1016/j.neurobiolaging.2016.10.018) [DOI] [PubMed] [Google Scholar]
- Lehman MN, Merkley CM, Coolen LM, Goodman RL.2010Anatomy of the kisspeptin neural network in mammals. Brain Research 136490–102. ( 10.1016/j.brainres.2010.09.020) [DOI] [PMC free article] [PubMed] [Google Scholar]
- Minabe S, Iwata K, Tsuchida H, Tsukamura H, Ozawa H.2021Effect of diet-induced obesity on Kiss1/Tac3/Pdyn gene expressions in the arcuate nucleus and luteinizing hormone secretion in sex hormone-primed male and female rats. Peptides 142170546. ( 10.1016/j.peptides.2021.170546) [DOI] [PubMed] [Google Scholar]
- Mostari P, Ieda N, Deura C, Minabe S, Yamada S, Uenoyama Y, Maeda K, Tsukamura H.2013Dynorphin-kappa opioid receptor signaling partly mediates estrogen negative feedback effect on LH pulses in female rats. Journal of Reproduction and Development 59266–272. ( 10.1262/jrd.2012-193). [DOI] [PMC free article] [PubMed] [Google Scholar]
- Murakawa H, Iwata K, Takeshita T, Ozawa H.2016Immunoelectron microscopic observation of the subcellular localization of kisspeptin, neurokinin B and dynorphin A in KNDy neurons in the arcuate nucleus of the female rat. Neuroscience Letters 612161–166. ( 10.1016/j.neulet.2015.12.008) [DOI] [PubMed] [Google Scholar]
- Nagae M, Uenoyama Y, Okamoto S, Tsuchida H, Ikegami K, Goto T, Majarune S, Nakamura S, Sanbo M, Hirabayashi Met al. 2021Direct evidence that KNDy neurons maintain gonadotropin pulses and folliculogenesis as the GnRH pulse generator. PNAS 118 e2009156118. ( 10.1073/pnas.2009156118) [DOI] [PMC free article] [PubMed] [Google Scholar]
- Nakao K, Iwata K, Takeshita T, Ozawa H.2018Expression of hypothalamic kisspeptin, neurokinin B, and dynorphin A neurons attenuates in female Zucker fatty rats. Neuroscience Letters 665135–139. ( 10.1016/j.neulet.2017.12.002) [DOI] [PubMed] [Google Scholar]
- Paxinos G, Watson C.2006The Rat Brain in Stereotaxic Coordinates, 6thed.Elsevier.(ISBN: 0-12-547612-4 ) [Google Scholar]
- R Core Team 2019R: a language and environment for statistical computing [Online]. (available at: https://www.R-project.org/) [Google Scholar]
- Roa J, Navarro VM, Tena-Sempere M.2011Kisspeptins in reproductive biology: consensus knowledge and recent developments. Biology of Reproduction 85650–660. ( 10.1095/biolreprod.111.091538) [DOI] [PubMed] [Google Scholar]
- Smith JT, Cunningham MJ, Rissman EF, Clifton DK, Steiner RA.2005Regulation of Kiss1 gene expression in the brain of the female mouse. Endocrinology 1463686–3692. ( 10.1210/en.2005-0488) [DOI] [PubMed] [Google Scholar]
- South SA, Asplin CM, Carlsen EC, Booth RA, Weltman JY, Johnson ML, Veldhuis JD, Evans WS.1993Alterations in luteinizing hormone secretory activity in women with insulin-dependent diabetes mellitus and secondary amenorrhea. Journal of Clinical Endocrinology and Metabolism 761048–1053. ( 10.1210/jcem.76.4.8473380) [DOI] [PubMed] [Google Scholar]
- Wakabayashi Y, Nakada T, Murata K, Ohkura S, Mogi K, Navarro VM, Clifton DK, Mori Y, Tsukamura H, Maeda Ket al. 2010Neurokinin B and dynorphin A in kisspeptin neurons of the arcuate nucleus participate in generation of periodic oscillation of neural activity driving pulsatile gonadotropin-releasing hormone secretion in the goat. Journal of Neuroscience 303124–3132. ( 10.1523/JNEUROSCI.5848-09.2010) [DOI] [PMC free article] [PubMed] [Google Scholar]
- Yeshaya A, Orvieto R, Dicker D, Karp M, Ben-Rafael Z.1995Menstrual characteristics of women suffering from insulin-dependent diabetes mellitus. International Journal of Fertility and Menopausal Studies 40269–273.(https://pubmed.ncbi.nlm.nih.gov/8556032/) [PubMed] [Google Scholar]
- Ziarniak K, Kołodziejski PA, Pruszyńska-Oszmałek E, Kallό I, Śliwowska JH.2018High-fat diet and type 2 diabetes induced disruption of the oestrous cycle and alteration of hormonal profiles, but did not affect subpopulations of KNDy neurones in female rats. Journal of Neuroendocrinology 30 e12651. ( 10.1111/jne.12651) [DOI] [PubMed] [Google Scholar]
- Ziarniak K, Kołodziejski PA, Pruszyńska-Oszmałek E, Dudek M, Kalló I, Śliwowska JH.2020Effects of ovariectomy and sex hormone replacement on numbers of kisspeptin-, neurokinin B- and dynorphin A-immunoreactive neurons in the arcuate nucleus of the hypothalamus in obese and diabetic rats. Neuroscience 451184–196. ( 10.1016/j.neuroscience.2020.10.003) [DOI] [PubMed] [Google Scholar]


 This work is licensed under a