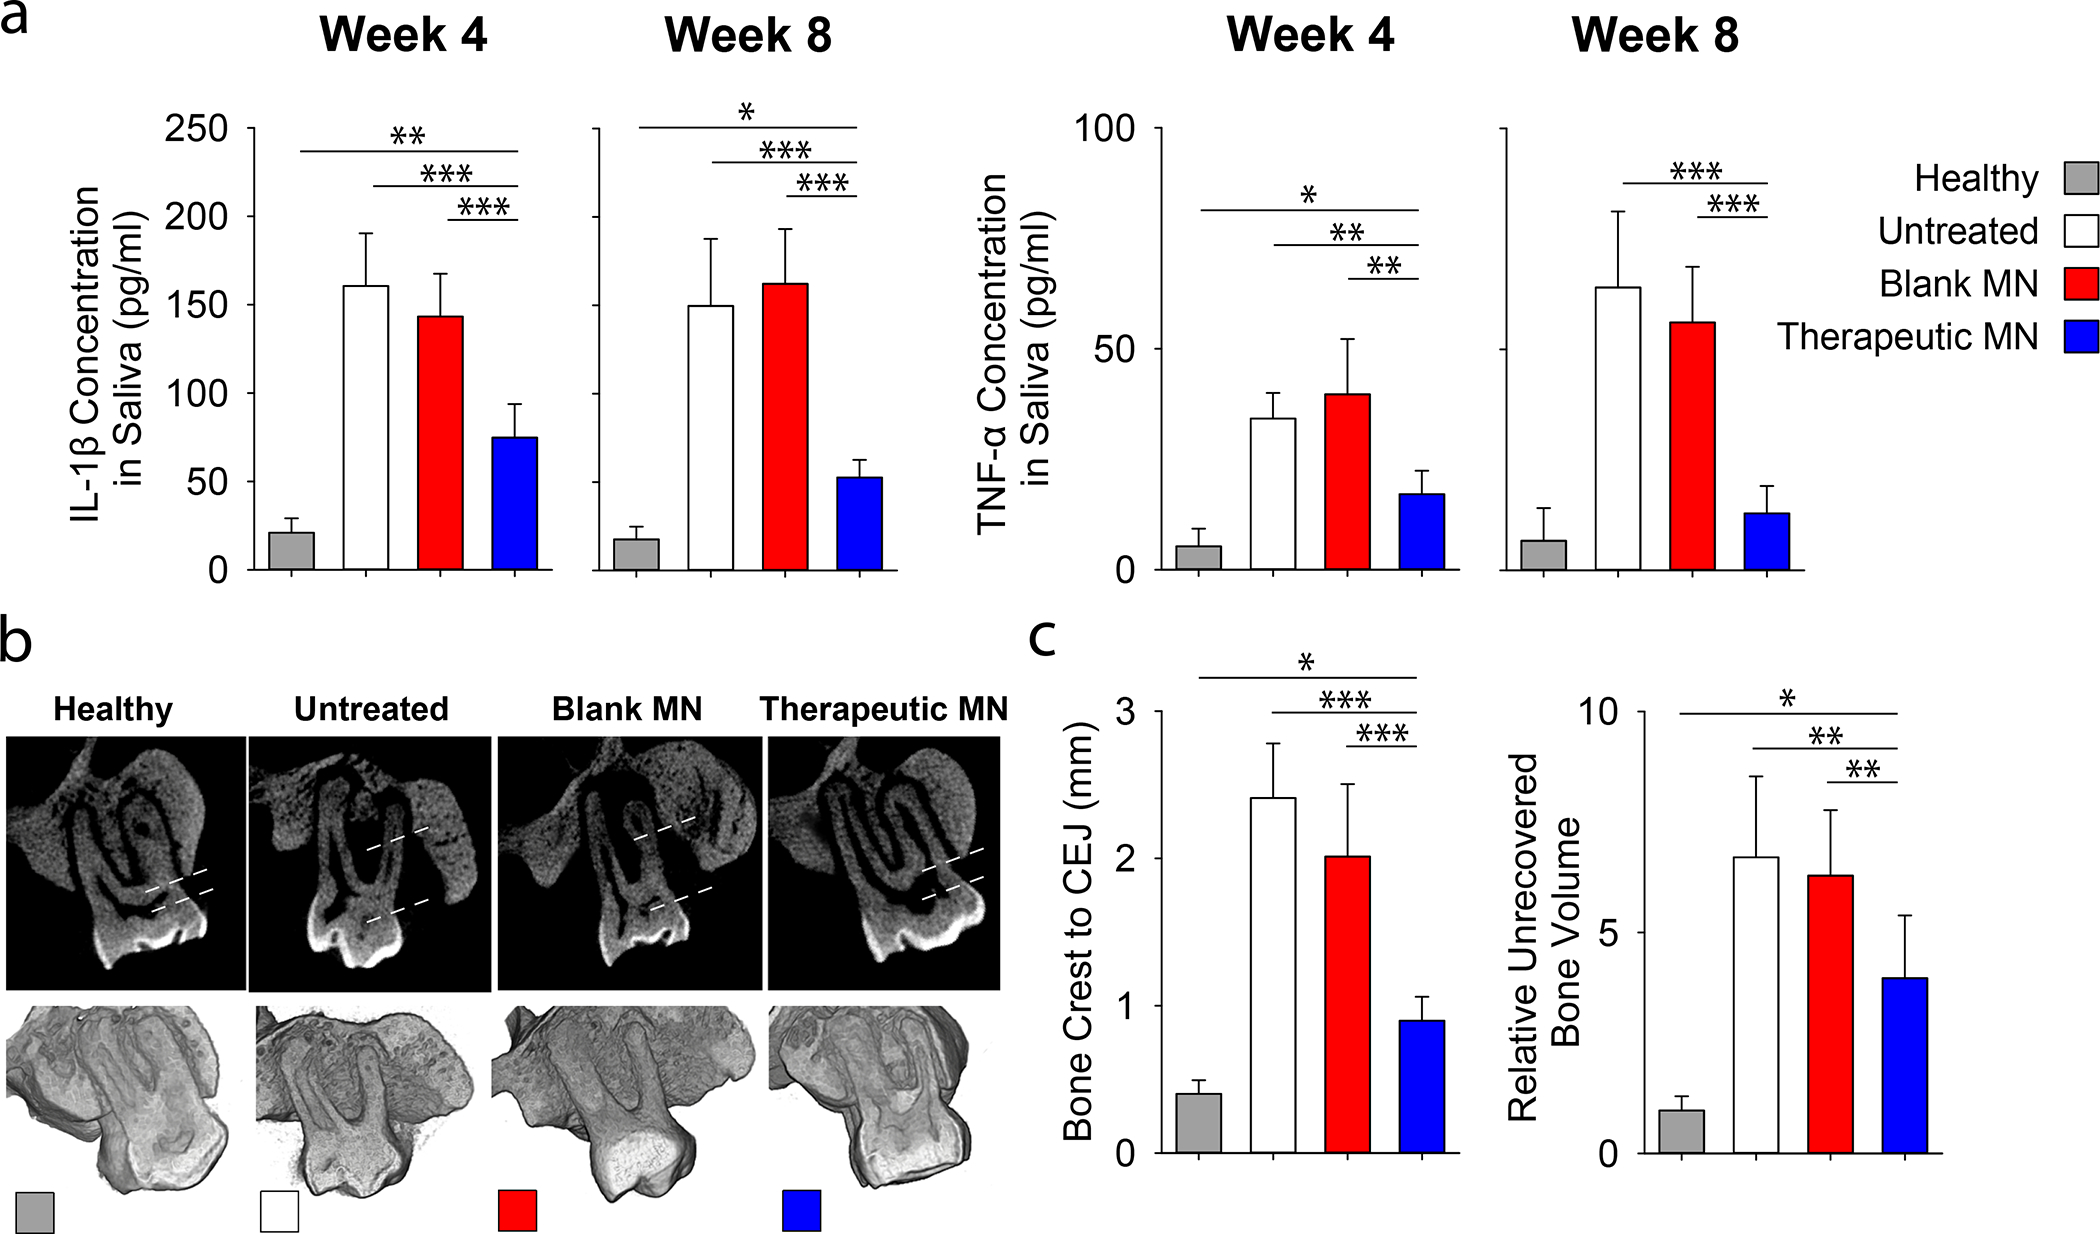
Figure 5. Effects of therapeutic MN patches on the regeneration of periodontal tissue in vivo.

Ligature induced periodontal disease model in rats was used. a, Quantification of inflammatory (TNF-α and IL-1β) cytokines in rat saliva at 4- and 8-weeks post MN implantation. b, The μCT images of the rat maxilla at 8 weeks post MN implantation. All specimens were normalized, and μCT images were calibrated to enable quantitative comparisons. Dotted line indicated the distances between bone crest and CEJ. c, Quantitative analysis of the vertical bone recovery as determined by measuring the distance between the bone crest and CEJ after 8-weeks of treatment. d, Relative volumetric bone recovery was calculated by using 3D reconstructed volume at 8 weeks post MN implantation. All data are presented as mean ± SD (n= 5). Statistical significance is indicated by * p < 0.05, ** p < 0.01 and *** p < 0.001 for differences between samples with different formulations.
