ABSTRACT
Nasopharyngeal carcinoma (NPC) has a low five-year survival rate, and its pathogenesis remains unclear. There is an urgent need to improve our understanding of the genetic regulation of NPC tumorigenesis and development. The role of miR-26a-5p in NPC growth regulation and the expression of its target, PTGS2, was analyzed. Quantitative Real-time PCR assay was used to detect miR-26a-5p and PTGS2 expression in human NPC tissues and cell lines. The RNA pull-down dual-luciferase reporter assay was used to determine the association between miR-26a-5p and PTGS2. The effects of miR-26a-5p and PTGS2 on NPC cell viability, proliferation, migration, and invasion were measured by CCK-8, BrdU, and Transwell assays. miR-26a-5p expression in NPC tissues and cell lines was significantly decreased. The overexpression of miR-26a-5p inhibited the viability, proliferation, migration, and invasion of NPC cells. miR-26a-5p bound to the 3-ʹuntranslated region of PTGS2, thus reducing PTGS2 protein levels. miR-26a-5p inhibited NPC development by reducing the expression of its target PTGS2.
KEYWORDS: Nasopharyngeal carcinoma, miR-26a-5p, PTGS2, proliferation, migration, invasion
Introduction
Nasopharyngeal carcinoma (NPC), a common malignant tumor of the head and neck, is currently treated with radiotherapy and chemotherapy [1]. The killing effect of radiotherapy and chemotherapy on NPC cells is widely known; however, the overall five-year survival rate of patients is not ideal [1,2]. The acceleration of the cell cycle and active cell invasion are pathological links closely related to the occurrence of NPC [3,4]. Similar to other cancers, the accumulation of RNA and epigenetic changes are involved in the occurrence and development of NPC [5]. Therefore, there is an urgent need to study molecules associated with NPC to identify a clear marker for its early detection and prognosis.
Multiple genes participate in the regulation of the NPC cell cycle and invasion process [6]. miRNAs, which are non-coding microRNAs, have attracted increasing attention in recent years. They regulate the expression of multiple genes in cells and produce different biological effects by influencing the expression of corresponding genes [7,8]. miRNAs, such as miR-124-3p and miR-17-5p, are aberrantly expressed in NPC and participate in the biological function of NPC cells, thus affecting the progression of NPC [9,10]. miR-26a-5p is known to regulate the malignant phenotype of various tumors and function as a tumor suppressor factor in esophageal and thyroid cancers [11,12]. Furthermore, miR-26a levels are low in NPC specimens and cell lines, and the ectopic expression of miR-26a significantly inhibits the malignant proliferation of cells [13]. Therefore, it is important to investigate the mechanism of action of miR-26a-5p in NPC.
Prostaglandin-endoperoxidase synthase 2 (PTGS2), also known as cyclooxygenase 2 (COX2), is an enzyme that is expressed under hypoxic conditions, which are induced by inflammatory factors, tumor-promoting factors, growth factors, and other stressors [14,15]. PTGS2 is involved in tumorigenesis, inflammation, angiogenesis, and many other biological reactions [16]. Recent studies have shown that PTGS2 gene mutations are associated with increased NPC susceptibility, resulting in poor prognosis of patients [17]. Additionally, miRNAs have been shown to participate in PTGS2 regulation. miR-21 and miR-1297 participate in the regulation of PTGS2 during carcinogenesis [18,19], and miR-26b inhibits breast cancer cell growth by directly targeting PTGS2 [20]. Nevertheless, the mechanism of action of miR-26a-5p and PTGS2 in NPC remains unclear.
This study focuses on miR-26a-5p and PTGS2 expression in NPC, and the effects of miR-26a-5p and PTGS2 on the malignant proliferation of NPC cells. The study findings may provide further insights into the pathogenesis of NPC and determine whether miR-26a-5p/PTGS2 is a target for NPC therapy.
Methods
Tissue collection
Forty patients with NPC, who were treated at our hospital, were enrolled in the present study. All patients were confirmed to have primary NPC based on histological examination. The patients had previously not undergone radiotherapy, chemotherapy, or biotherapy; lacked any history of resection or metastatic disease; and had no other primary tumor. The complete clinical data of all patients were obtained. NPC tissues (tumor) and para-NPC tissues (normal) obtained from the biopsy of patients with NPC were retained for use. Informed consent was obtained from all the patients. The clinical characteristics of the patients are presented in Supplementary Table 1.
Cell culture
The human normal nasopharyngeal epithelial cells NP69 and NPC cell lines (C666-1, TW03, and 5–8 F) were all obtained from ATCC (VA, USA). All cells were maintained in RPMI-164 medium (Invitrogen, MA, USA) supplemented with 100 IU/mL penicillin, 100 mg/mL streptomycin, and 10% fetal bovine serum. The cells were maintained in an incubator at 37°C and 5% CO2.
Cell transfection
miR-26a-5p mimic and PTGS2-overexpressing RNA (OE), and their corresponding negative controls (mimic-NC and OE-NC) were synthesized by GenePharma (Shanghai, China). Five microliters of the transfection compound, Lipofectamine 2000 reagent (Invitrogen), and 10 μL of the miR-26a-5p mimic, mimic-NC, OE, or OE-NC were added to a 24-well plate following the manufacturer’s instructions. After being shaken carefully and evenly, the culture was incubated for 6 h at 37°C. The medium was then discarded and fresh medium was added to each well for further culture.
qRT-PCR assay
miRNA was extracted from tissues and cells using the miRNeasy EFPE kit (BioTeke, Beijing, China). The concentration and purity of the RNA were determined using a spectrophotometer (Gilford Products Laboratories, OH, USA). miRNA was reverse-transcribed using the miRcute miRNA first-strand cDNA synthesis kit (Tiangen, Beijing, China). In the ABI 7500 Fast Real-Time PCR system (Applied Biosystems, CA, USA), the qRT-PCR was carried out according to the instructions of the miRcute miRNA qPCR Detection Kit (Tiangen). The PCR conditions were as follows: pre-denaturation at 94°C for 2 min, followed by 40 cycles of denaturation at 94°C for 20s, and extension at 60°C for 34s. The relative expression of miRNAs was calculated using the 2−ΔΔCt method [21], and U6 was used as an internal control.
Total RNA was extracted using the TRIzol kit (Invitrogen). Total RNA was transcribed into cDNA using the One Step PrimeScript cDNA synthesis kit (Thermo Fisher Scientific, CA, USA), and qRT-PCR was performed using the SYBR Green Master PCR Mix (Thermo Fisher Scientific). GAPDH was used as an internal control. The sequences of the primers used in this study are listed in Table 1.
Table 1.
The sequences of PCR primers in this study
| Primer | Sequences |
|---|---|
| miR-26a-5p | Forward: 5′-GCGCATTGCACTTGTCTCG-3′ |
| Reverse: 5′-AGTGCAGGGTCCGAGGTATT-3′ | |
| miR-223-3p | Forward: 5′-AGCTGGTGTTGTGAATCAGGCCG-3′ |
| Reverse: 5′-TGGTGTCGTGGAGTCG-3′ | |
| PTGS2 | Forward: 5’-TTCCTCCTGTGCCTGATGATT-3’ |
| Reverse: 5’-AAACTGATGCGTGAAGTGCTG-3’ | |
| GAPDH | Forward: 5’-CATGAGAAGTATGACAACAGCCT-3’ |
| Reverse: 5’-AGTCCTTCCACGATACCAAAGT-3’ | |
| U6 | Forward: 5’-GCTTCGGCAGCACATATACTAAAAT-3’ |
| Reverse: 5’-CGCTTCACGAATTTGCGTGTCAT-3’ |
CCK-8 assay
This assay was performed using the Cell Counting Kit-8 (Dojindo, Tokyo, Japan). Cells were digested with trypsin and prepared into single cell suspension with fresh medium after 48 h of transfection. The cells were transferred into a 96-well plate at a density of 1 × 10³ cells/well. After 24 h of culture, 20 μL of CCK-8 reagent was added and the cells were incubated for 4 h. The absorbance value was measured by ELISA at 24, 48, 72, and 96 h. The growth curve was plotted with the cell absorbance as the vertical coordinate and the culture time as the horizontal coordinate.
BrdU assay
BrdU incorporation was detected using a commercially available ELISA kit (Cell Signaling Technology, MA, USA) to determine the extent of cell proliferation. The cells were incubated with BrdU (10 mM) for 72 h and the optical density was determined at 450 nm.
Transwell assay
Cell migration and invasion assays were performed in Transwell chambers with or without Matrigel (invasion assay). Complete medium was added to the lower chamber to prepare the conditioned medium. One-hundred microliters of the cell suspension was added to the upper chamber and cultured at 4°C for 24 h. After culturing, the chamber culture medium was removed, and the cells were rinsed with PBS. After air-drying, the cells were carefully swabbed with a cotton swab to remove the cells from the upper chamber of the membrane. The cells that invaded and adhered to the surface of the filter membrane were fixed with 4% methanol, stained with 0.1% crystal violet, and sealed with neutral resin. The number of invasive cells in five visual fields was counted using a light microscope (Olympus, Tokyo. Japan).
Dual-luciferase reporter assay
The 3ʹ-untranslated region (UTR) of the synthesized PTGS2 (PTGS2 3ʹ-UTR) was inserted into the pGL4 vector (Promega, WI, USA) and named PTGS2-WT. Mutant-type PTGS2 fragments lacking the miR-26a-5p-binding site were obtained using the Quik-Change Site-Directed Mutagenesis Kit (Stratagene, CA, USA) and cloned into the pGL4 vector according to the manufacturer’s protocol. The recombinant plasmid was co-transfected with mimic-NC or the miR-26a-5p mimic into C666-1 and 5–8 F cells, respectively. After transfection for 48 h, luciferase activity was measured using a double luciferase reporter assay system (Promega, WI, USA). The PTGS2-WT and mimic-NC co-transfected groups were used as the control.
RNA pull-down assay
Biotinylated miR-NC (Bio-NC) or biotinylated miR-26a-5p (Bio-miR-26a-5p) at 20 nM concentration was transfected into the cells. After 48 h following transfection, cell lysates were obtained by ultrasound and incubated with streptavidin magnetic beads (Thermo Fisher Scientific). The lysates were purified using an RNeasy Mini Kit (Qiagen, Duesseldorf, Germany). PTGS2 enrichment was detected by qRT-PCR.
Western blot assay
Total cell protein was obtained, and the concentration of protein was measured using the BCA method. A total of 50 μg protein was mixed with an equal volume of 2× loading buffer and denatured at 98°C for 10 min. After centrifugation, 30 μL of the supernatant was extracted, transferred to a PVDF membrane via semi-dry electroporation, and blocked with 5% skimmed milk powder at 37°C for 2 h. The primary antibody against PTGS2 (1:1000; ab188183; Abcam, UK) and (1:1000; ab8245; Abcam, UK) was added, and the mixture was incubated overnight at 4°C. Next, the HRP-labeled secondary antibody was added and the mixture incubated at 37°C for 2 h and washed with PBS. The signal was detected using ECL, the image was captured using the UVI gel imaging system, and the gray value of the strip was analyzed using the Image software (Media Cybernetics, CA, USA). Protein expression was expressed as the ratio of the absorption area of the target band to that of GAPDH.
Statistical analysis
The SPSS software (SPSS, IL, USA) was used for statistical analysis. Data are presented as the mean ± standard. The differences between groups were analyzed using the Student’s t-test and one-way ANOVA. The Pearson’s correlation coefficient was used to analyze the correlation between miR-26a-5p and PTGS2. Statistical significance was set at p < 0.05.
Results
The identification of PTGS2 and miR-26a-5p in NPC
The GSE12452 data series was analyzed, and the top 10 most significantly upregulated genes were obtained and uploaded to the STRING database for the protein-protein interaction network. The network is shown in Figure 1(a). Among the 10 genes, seven were present in the network. PTGS2 was reported to be a cancer driver in human cancers other than NPC [18,20,22,23]. Moreover, the GSE12452 data analysis revealed that PTGS2 was significantly upregulated in NPC, which led us to speculate that PTGS2 might be a cancer driver in NPC as well.
Figure 1.
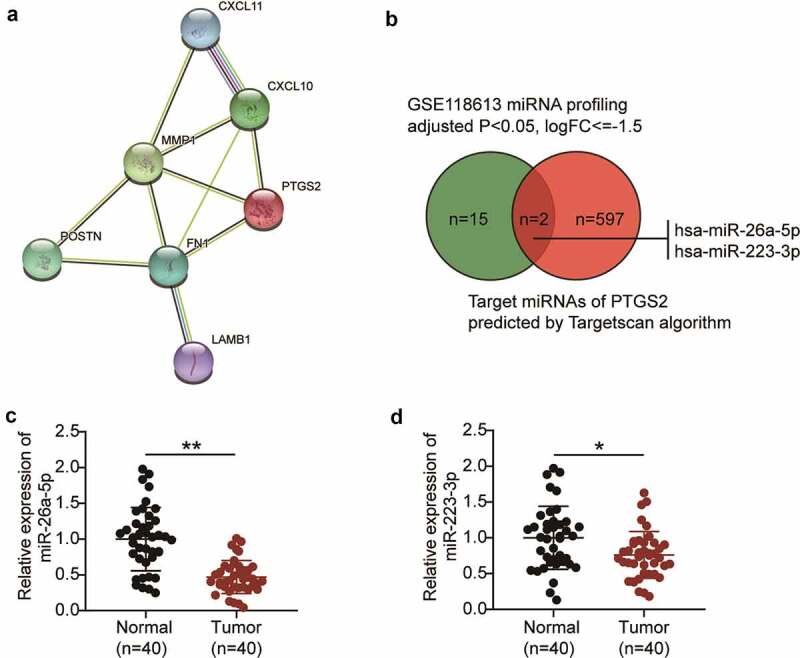
The identification of PTGS2 and miR-26a-5p in NPC. (a) STRING showed the PPI network analysis of the top 10 most upregulated genes from GSE12452 data analysis (Criteria: adjusted P < 0.01, logFC≥1.5). (b) The intersection between the predicted target miRNAs of PTGS2 by Targetscan algorithm and the significantly downregulated miRNAs from GSE118613 data analysis (adjusted P < 0.05, logFC≤-1.5). (c) qRT-PCR analysis was employed to measure miR-26a-5p expression in NPC tissues and normal tissues. **P < 0.001. (d) qRT-PCR analysis was employed to measure miR-223-3p expression in NPC tissues and normal tissues. **P < 0.05.
To identify an upstream miRNA regulator of PTGS2, we used the TargetScan algorithm to predict the potential regulators and obtained 599 unique miRNAs. Our analysis also revealed 17 differentially expressed miRNAs in GSE118613 with the criteria of adjusted p < 0.05, and logFC ≤ −1.5. Two candidate miRNAs (miR-26a-5p and miR-223-3p) were identified (Figure 1(b)). The two miRNAs have been reported to be tumor suppressors in NPC [13,24–28]. We detected the expression of the two miRNAs in our collected tissue samples and found that miR-26a-5p was more significantly downregulated in NPC than in the healthy controls (Figure 1(c–d)). We hypothesized that miR-26a-5p might suppress NPC cell phenotypes by inhibiting PTGS2.
Overexpression of miR-26a-5p inhibits proliferation and migration of NPC cells
First, we examined the expression of miR-26a-5p in NPC cells using qRT-PCR assay which revealed that miR-26a-5p was expressed at low levels in the established human NPC cell lines, including 5–8 F, C666-1, and TW03. miR-26a-5p expression in the C666-1 and 5–8 F cells was lower than that in the TW03 cells; therefore, the C666-1 and 5–8 F cells were selected for further experiments (Figure 2(a)). To clarify the potential effects of miR-26a-5p on NPC cell function, the miR-26a-5p mimic was transfected into 5–8 F and C666-1 cells. Following transfection, these cells showed an enhanced miR-26a-5p expression (Figure 2(b)). Moreover, the survival of the miR-26a-5p mimic-treated NPC cells was reduced by more than 30%, as revealed by the CCK-8 assay (Figure 2(c)). The miR-26a-5p overexpression also inhibited cell proliferation by approximately 30% in the BrdU assay (Figure 2(d)). These results revealed that the miR-26a-5p overexpression inhibited the proliferation and viability of the NPC cells. Furthermore, a Transwell migration assay revealed that the number of migrating cells was reduced following the overexpression of miR-26a-5p (Figure 3(a)). The Transwell invasion assay additionally indicated that upregulation of miR-26a-5p reduced the invasive level of NPC cells by approximately 60% (Figure 3(b)). In conclusion, these results revealed that miR-26a-5p overexpression suppressed the malignant proliferation of NPC cells.
Figure 2.
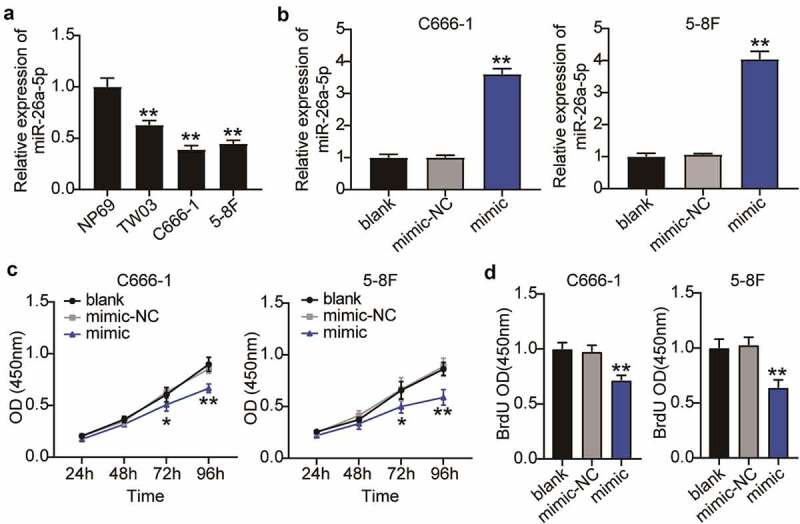
Overexpression of miR-26a-5p inhibits viability and proliferation of NPC cells. (a) MiR-26a-5p expression in NPC cell lines (TW03, C666-1, 5–8 F) and normal nasopharyngeal epithelial cell line (NP69) was detected by qRT-PCR. The error bars indicate SD. n = 3. **P < 0.001 suggested a statistically significant difference in comparison with NP69. (b) qRT-PCR showed miR-26a-5p expression was significantly increased in C666-1 and 5–8 F cells after upregulation of miR-26a-5p. (c) CCK-8 assay showed the proliferation in C666-1 and 5–8 F cells were inhibited after upregulation of miR-26a-5p. (d) BrdU assay showed that the viability of C666-1 and 5–8 F cells were restrained after miR-26a-5p was upregulated. (b-d) The error bars indicate SD. n = 3. *P < 0.05, **P < 0.001 suggested a statistically significant difference in comparison with blank group.
Figure 3.
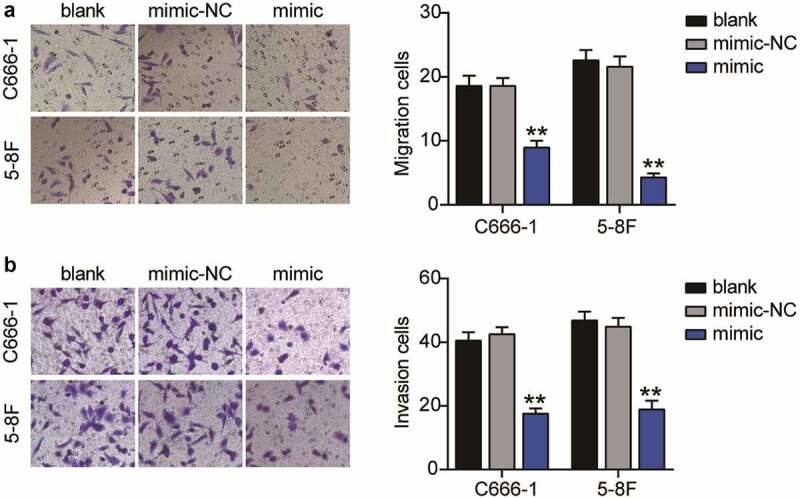
Overexpression of miR-26a-5p inhibits migration and invasion of NPC cells. (a) Transwell migration assay revealed that cell migration ability were decreased in C666-1 and 5–8 F cells after miR-26a-5p was upregulated. (b) Transwell invasion assay revealed that cell invasion in C666-1 and 5–8 F cells were decreased after upregulation of miR-26a-5p. The error bars indicate SD. n = 3. **P < 0.001 suggested a statistically significant difference in comparison with blank group.
PTGS2 is targeted by miR-26a-5p in NPC Cells
Bioinformatics analysis indicated that PTGS2 was a target of miR-26a-5p and closely related to miR-26a-5p. The predicted binding sites between miR-26a-5p and PTGS2 are shown in Figure 4(a). To study the association between miR-26a-5p and PTGS2, we subcloned wild-type PTGS2 (PTGS2-WT) containing an miR-26a-5p binding site and a mutant PTGS2 into a luciferase vector. The data showed that PTGS2-WT and the miR-26a-5p mimic inhibited luciferase activity in NPC cells, which was counteracted by miR-26a-5p and PTGS2 binding site mutations, indicating that miR-26a-5p directly targeted PTGS2 (Figure 4(b)). Furthermore, the enrichment of PTGS2 on Bio-miR-26a-5p was analyzed using an RNA pull-down assay. The results suggested that the enrichment of PTGS2 was approximately 15 times higher than that of bio-NC (Figure 4(c)). Next, we detected PTGS2 expression in NPC by qRT-PCR to further investigate the relationship between miR-26a-5p and PTGS2. The results suggested that the expression of PTGS2 increased approximately 5-fold in NPC tissues compared to the adjacent normal tissues and increased approximately 6-fold in NPC cells compared to NP69 cells (Figure 4(d–e)). Additionally, the Pearson’s correlation analysis also suggested a negative correlation between miR-26a-5p and PTGS2 in NPC (Figure 4(f)).
Figure 4.
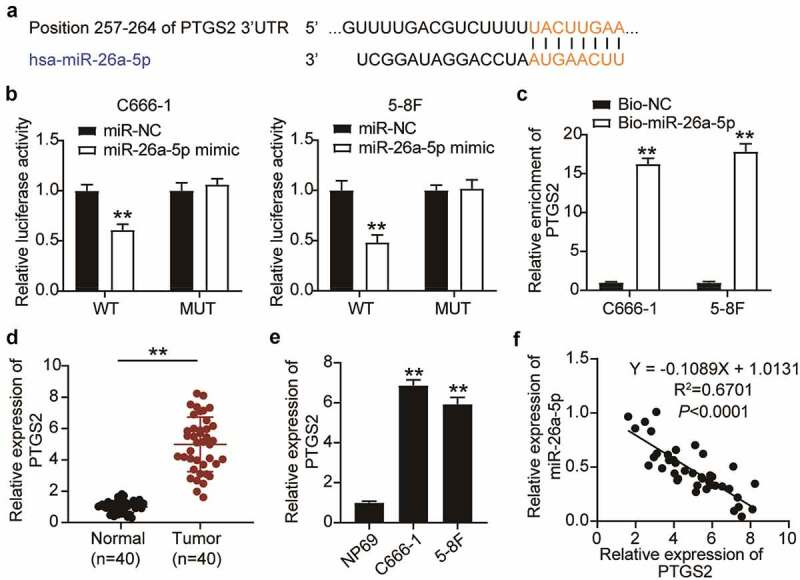
PTGS2 was targeted by miR-26a-5p in NPC Cells. (a) The binding site between miR-26a-5p and PTGS2 was presented from targetscan. (b) Luciferase reporter assay demonstrated that miR-26a-5p mimic significantly inhibited the luciferase activity of vectors that carried the wild-type of 3’-UTR of PTGS2 in C666-1 and 5–8 F cells. The error bars indicate SD. n = 3. **P < 0.001 suggested a statistically significant difference in comparison with miR-NC co-transfected with PTGS2-WT. (c) RNA pull-down assay showed that PTGS2 enrichment level increased in C666-1 and 5–8 F cells treated with biotin labeled miR-26a-5p. The error bars indicate SD. n = 3. **P < 0.001 suggested a statistically significant difference in comparison with Bio-NC group. (d) qRT-PCR analysis was employed to measure PTGS2 mRNA expression in NPC tissues and normal tissues. **P < 0.001. (e) qRT-PCR analysis was employed to test PTGS2 mRNA expression in NPC cell lines and NP69 cell line. The error bars indicate SD. n = 3. **P < 0.001 suggested a statistically significant difference in comparison with NP69. (f) The correlation between miR-26a-5p and PTGS2 was conducted by Pearson correlation analysis. The error bars indicate SD.
Overexpression of PTGS2 counteracts the inhibitory effect of miR-26a-5p upregulation on the development of NPC cells in vitro
To explore the relationship between PTGS2 and miR-26a-5p, PTGS2 expression was evaluated by Western blot assay following the upregulation of miR-26a-5p. The data revealed that the miR-26a-5p mimic inhibited PTGS2 expression, suggesting that miR-26a-5p negatively regulates PTGS2 expression (Figure 5(a)).
Figure 5.
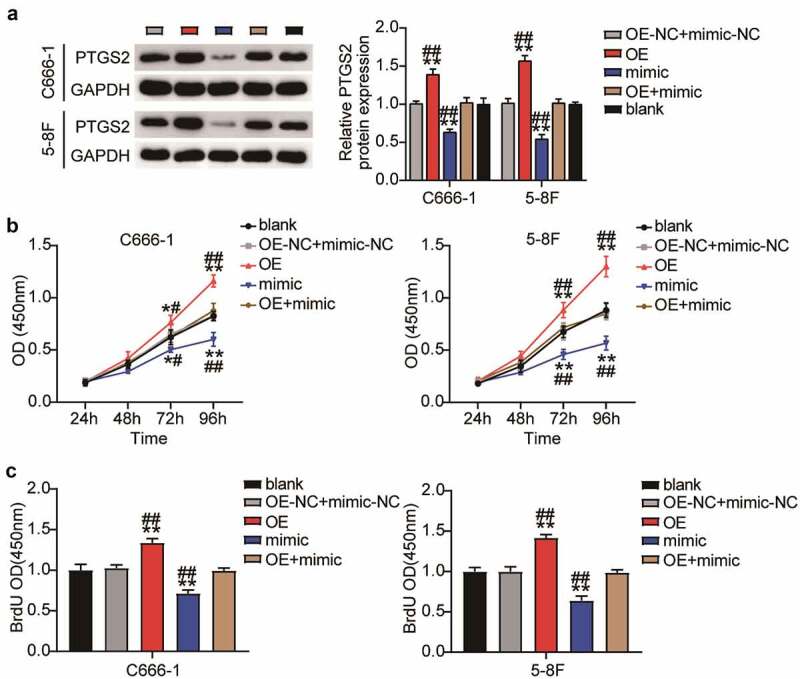
Overexpression of PTGS2 canceled out the inhibitory effect of upregulation of miR-26a-5p on the viability and proliferation of NPC cells in vitro. (a) Western blot revealed that overexpression of miR-26a-5p and PTGS2 plasmid reversed the down-regulation of PTGS2 protein induced by overexpression of miR-26a-5p in C666-1 and 5–8 F cells. (b) CCK-8 assay showed that overexpression of miR-26a-5p and PTGS2 plasmid reversed the inhibition of C666-1 and 5–8 F cell viability induced by upregulation of miR-26a-5p. (c) BrdU assay showed that overexpression of miR-26a-5p and PTGS2 plasmid reversed the inhibition of C666-1 and 5–8 F cell proliferation induced by upregulation of miR-26a-5p. The error bars indicate SD. n = 3. *P < 0.05, **P < 0.001 suggested a statistically significant difference in comparison with blank group. #P < 0.05, ##P < 0.001 suggested a statistically significant difference in comparison with OE + mimic group.
The downregulation of miR-26a-5p in NPC was associated with the upregulation of PTGS2. Therefore, we studied the effect of PTGS2 overexpression on miR-26a-5p upregulation in NPC cells. First, we confirmed PTGS2 upregulation in NPC cells, following OE-PTGS2 transfection, by Western blot analysis. Rescue experiments showed that PTGS2 expression level of PTGS2-upregulated NPC cells was also increased compared to that of cells co-transfected with OE-PTGS2 and the miR-26a-5p mimic (Figure 5(a)). Next, the presence of OE-PTGS2 led to an increase in the viability of NPC cells, whereas the miR-26a-5p mimic abolished this effect (Figure 5(b)). In addition, PTGS2 overexpression resulted in a reduction in the proliferation of NPC cells, and miR-26a-5p overexpression rescued the upregulation of NPC cells (Figure 5(c)). Furthermore, Transwell migration and invasion assays revealed that upregulation of PTGS2 increased the number of migrating and invading NPC cells, while upregulation of miR-26a-5p might further counteract this effect (Figure 6(a–b)). Therefore, we suggest that the enhanced antitumor effect of miR-26a-5 is dependent on PTGS2.
Figure 6.
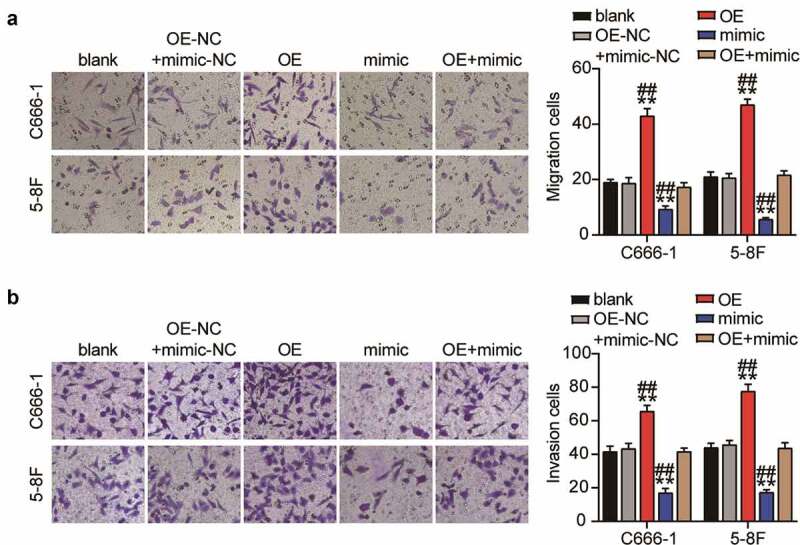
Overexpression of PTGS2 canceled out the inhibitory effect of upregulation of miR-26a-5p on the migration and invasion of NPC cells in vitro. (a) Transwell migration assay showed that the inhibition of migration ability of C666-1 and 5–8 F cells caused by miR-26a-5p overexpression was reversed by up-regulation of miR-26a-5p and PTGS2. (b) Transwell invasion assay showed that the inhibition of invasion ability of C666-1 and 5–8 F cells caused by miR-26a-5p overexpression was reversed by up-regulation of miR-26a-5p and PTGS2. The error bars indicate SD. n = 3. **P < 0.001 suggested a statistically significant difference in comparison with blank group. ##P < 0.001 suggested a statistically significant difference in comparison with OE + mimic group.
Discussion
NPC is a malignant tumor occurring in the top and side walls of the nasopharyngeal cavity, and its incidence rate is the highest among the malignant tumors of the ear, nose, and throat [29]. Early symptoms of NPC are similar to those of a cold and are easily ignored; however, it is highly malignant and tends to metastasize to the neck lymph nodes [30]. The treatment for NPC relies primarily on radiotherapy and chemotherapy, but chances of relapse and distant metastasis remain high. MicroRNAs have been shown to vary with varying stages of NPC progression and may be involved in the activation of key molecules in cancer [31]. In the present study, we found that miR-26a-5p was downregulated in NPC tissues and cells, and the miR-26a-5p mimic suppressed the proliferation, migration, and invasion of NPC cells. Furthermore, miR-26a-5p overexpression compromised the oncogenic action of PTGS2 overexpression. These findings revealed that miR-26a-5p inhibits NPC progression by targeting PTGS2 in vitro, which suggests that miR-26a-5p could be the basis of a promising therapeutic strategy against NPC.
miR-26a-5p has been shown to participate in the progression of various types of cancer. It is downregulated in colorectal cancer [32], esophageal cancer [11], and thyroid cancer [12], and functions as an inhibitor for malignant proliferation. However, miR-26a-5p can have an oncogenic role in certain cancer types. For example, miR-26a-5p enhances cell viability and drug resistance in hepatocellular carcinoma [33]. Conversely, blocking miR-26a-5p inhibited the oncogenic action of non-small cell lung cancer in vitro [34]. Recently, a study revealed that miR-26a-5p could negatively regulate NPC progression [35]. In this study, miR-26a-5p was poorly expressed in NPC tissues and cell lines. In addition, miR-26a-5p overexpression inhibited the viability, proliferation, invasion, and migration of NPC cells. Our results suggest that miR-26a-5p has a tumor-suppressing effect in NPC, which was consistent with the findings of the previous study.
MicroRNAs regulate gene transcription efficiency by recognizing the 3ʹ-UTR of mRNA [7]. A previous investigation has shown that miR-26a-5p regulates different target genes and influences their function in cancers. Bioinformatics analysis predicted that PTGS2 was a potential target gene for miR-26a-5p. PTGS2 is overexpressed in NPC and associated with poor prognosis, suggesting its oncogenic role [17,36]. Consistently, we also found that PTGS2 was highly expressed in NPC tissues and cells. Ectopic PTGS2 expression increased the malignant phenotype of NPC cells, suggesting that PTGS2 acts as an oncoprotein during NPC progression. The interaction between PTGS2 and miR-26a-5p was further validated by luciferase reporter assays and RNA pull-down assays. The antagonistic repression between PTGS2 and miR-26a-5p further supported their target interactions. Interestingly, PTGS2-promoting malignant behaviors of NPC cells were neutralized by the miR-26a-5p mimic. Collectively, miR-26a-5p, a malignant proliferation suppressor miRNA in NPC, may be mediated by targeting PTGS2.
Nevertheless, this study has some limitations. First, the lack of animal experiments to verify the effect of miR-26a-5p and PTGS2 on NPC is a major limitation of this study. Second, the potential signaling pathways related to tumorigenesis, such as MAPK or EDF signaling pathways, need to be further evaluated.
Conclusions
In conclusion, this study revealed that miR-26a-5p expression is significantly downregulated in NPC. miR-26a-5p negatively regulates transcription and translation by directly binding to the 3’-UTR of PTGS2. Moreover, the overexpression of miR-26a-5p inhibits NPC cell viability, proliferation, invasion, and migration by inhibiting PTGS2 expression. These results suggest that miR-26a-5p/PTGS2 is a potential biomarker and therapeutic target for NPC.
Supplementary Material
Funding Statement
The author(s) reported there is no funding associated with the work featured in this article.
Ethics approval and consent to participate
The present study was approved by the Ethics Committee of Affiliated Puren Hospital of Wuhan University of Science and Technology (Wuhan, China). The processing of clinical tissue samples is in strict compliance with the ethical standards of the Declaration of Helsinki. All patients signed written informed consent.
Consent for publication
Consent for publication was obtained from the participants.
Disclosure statement
No potential conflict of interest was reported by the author(s).
Availability of data and materials
The datasets used and analyzed during the current study are available from the corresponding author on reasonable request.
Authors’ contributions
XQ conducted the study, collected and analyzed the data. BLC designed the study and methods. DK interpreted the data, collected materials and resources, conducted literature analysis. YL prepared the manuscript. All authors read and approved the final manuscript.
Supplementary material
Supplemental data for this article can be accessed here
References
- [1].Liu X, Tang LL, Du XJ, et al. Changes in disease failure risk of nasopharyngeal carcinoma over time: analysis of 749 patients with long-term follow-up. J Cancer. 2017;8:455–459. [DOI] [PMC free article] [PubMed] [Google Scholar]
- [2].Wilmot VV, Hathorn I.. Surgical management of nasal stenosis following chemoradiation for nasopharyngeal carcinoma. J Laryngol Otol. 2017;131:429–432. [DOI] [PubMed] [Google Scholar]
- [3].Liu Y, Liu Q, Chen S, et al. APLNR is involved in ATRA-induced growth inhibition of nasopharyngeal carcinoma and may suppress EMT through PI3K-Akt-mTOR signaling. FASEB J. 2019;33:11959–11972. [DOI] [PubMed] [Google Scholar]
- [4].Lv Y, Yang H, Ma X, et al. Strand-specific miR-28-3p and miR-28-5p have differential effects on nasopharyngeal cancer cells proliferation, apoptosis, migration and invasion. Cancer Cell Int. 2019;19:187. [DOI] [PMC free article] [PubMed] [Google Scholar]
- [5].Zhan Y, Fan S.. Multiple mechanisms involving in radioresistance of nasopharyngeal carcinoma. J Cancer. 2020;11:4193–4204. [DOI] [PMC free article] [PubMed] [Google Scholar]
- [6].Strazzulla A, Barreca GS, Giancotti A, et al. Nasopharyngeal carcinoma: review of the literature with a focus on therapeutical implications. Le infezioni medicina. 2015;23:224–229. [PubMed] [Google Scholar]
- [7].Liu B, Wu S, Ma J, et al. lncRNA GAS5 reverses EMT and tumor stem cell-mediated gemcitabine resistance and metastasis by targeting miR-221/SOCS3 in pancreatic cancer. Mol Ther Nucleic Acids. 2018;13:472–482. [DOI] [PMC free article] [PubMed] [Google Scholar]
- [8].Wiklund ED, Kjems J, Clark SJ. Epigenetic architecture and miRNA: reciprocal regulators. Epigenomics. 2010;2:823–840. [DOI] [PubMed] [Google Scholar]
- [9].Liu C, Zhang H, Liu H. Long noncoding RNA UCA1 accelerates nasopharyngeal carcinoma cell progression by modulating miR-124-3p/ITGB1 axis. Onco Targets Ther. 2019;12:8455–8466. [DOI] [PMC free article] [PubMed] [Google Scholar] [Retracted]
- [10].Duan B, Shi S, Yue H, et al. Exosomal miR-17-5p promotes angiogenesis in nasopharyngeal carcinoma via targeting BAMBI. J Cancer. 2019;10:6681–6692. [DOI] [PMC free article] [PubMed] [Google Scholar]
- [11].Zhang XM, Wang J, Liu ZL, et al. LINC00657/miR-26a-5p/CKS2 ceRNA network promotes the growth of esophageal cancer cells via the MDM2/p53/Bcl2/Bax pathway. Biosci Rep. 2020;40:BSR20200525. [DOI] [PMC free article] [PubMed] [Google Scholar]
- [12].Shi D, Wang H, Ding M, et al. MicroRNA-26a-5p inhibits proliferation, invasion and metastasis by repressing the expression of Wnt5a in papillary thyroid carcinoma. Onco Targets Ther. 2019;12:6605–6616. [DOI] [PMC free article] [PubMed] [Google Scholar]
- [13].Lu J, He M-L, Wang L, et al. MiR-26a inhibits cell growth and tumorigenesis of nasopharyngeal carcinoma through repression of EZH2. Cancer Res. 2011;71(1):225–233. [DOI] [PubMed] [Google Scholar]
- [14].Cox DG, Pontes C, Guino E, et al. Polymorphisms in prostaglandin synthase 2/cyclooxygenase 2 (PTGS2/COX2) and risk of colorectal cancer. Br J Cancer. 2004;91:339–343. [DOI] [PMC free article] [PubMed] [Google Scholar]
- [15].Schmedtje JF Jr., Ji YS, Liu WL, et al. Hypoxia induces cyclooxygenase-2 via the NF-kappaB p65 transcription factor in human vascular endothelial cells. J Biol Chem. 1997;272:601–608. [DOI] [PubMed] [Google Scholar]
- [16].Zhou Z, Lu C, Meng S, et al. Silencing of PTGS2 exerts promoting effects on angiogenesis endothelial progenitor cells in mice with ischemic stroke via repression of the NF-κB signaling pathway. J Cell Physiol. 2019;234:23448–23460. [DOI] [PubMed] [Google Scholar]
- [17].Shi C, Guan Y, Zeng L, et al. High COX-2 expression contributes to a poor prognosis through the inhibition of chemotherapy-induced senescence in nasopharyngeal carcinoma. Int J Oncol. 2018;53:1138–1148. [DOI] [PMC free article] [PubMed] [Google Scholar]
- [18].Mima K, Nishihara R, Yang J, et al. MicroRNA MIR21 (miR-21) and PTGS2 expression in colorectal cancer and patient survival. Clin Cancer Res off J Am Assoc Cancer Res. 2016;22:3841–3848. [DOI] [PMC free article] [PubMed] [Google Scholar]
- [19].Chen P, Wang BL, Pan BS, et al. MiR-1297 regulates the growth, migration and invasion of colorectal cancer cells by targeting cyclo-oxygenase-2. Asian Pac J Cancer Prev. 2014;15:9185–9190. [DOI] [PubMed] [Google Scholar]
- [20].Li J, Kong X, Zhang J, et al. MiRNA-26b inhibits proliferation by targeting PTGS2 in breast cancer. Cancer Cell Int. 2013;13:7. [DOI] [PMC free article] [PubMed] [Google Scholar]
- [21].Livak KJ, Schmittgen TD. Analysis of relative gene expression data using real-time quantitative PCR and the 2(-Delta Delta C(T)) Method. Methods. 2001;25:402–408. [DOI] [PubMed] [Google Scholar]
- [22].Huang YC, Lee CT, Lee JC, et al. Epigenetic silencing of miR-137 contributes to early colorectal carcinogenesis by impaired Aurora-A inhibition. Oncotarget. 2016;7:76852–76866. [DOI] [PMC free article] [PubMed] [Google Scholar]
- [23].Maroni P, Bendinelli P, Matteucci E, et al. The therapeutic effect of miR-125b is enhanced by the prostaglandin endoperoxide synthase 2/cyclooxygenase 2 blockade and hampers ETS1 in the context of the microenvironment of bone metastasis. Cell Death Dis. 2018;9:472. [DOI] [PMC free article] [PubMed] [Google Scholar]
- [24].Yu L, Lu J, Zhang B, et al. miR-26a inhibits invasion and metastasis of nasopharyngeal cancer by targeting EZH2. Oncol Lett. 2013;5:1223–1228. [DOI] [PMC free article] [PubMed] [Google Scholar]
- [25].Alajez NM, Shi W, Hui AB, et al. Enhancer of Zeste homolog 2 (EZH2) is overexpressed in recurrent nasopharyngeal carcinoma and is regulated by miR-26a, miR-101, and miR-98. Cell Death Dis. 2010;1:e85. [DOI] [PMC free article] [PubMed] [Google Scholar]
- [26].Gao L, Xiong X. MiR-223 inhibits the proliferation, invasion and EMT of nasopharyngeal carcinoma cells by targeting SSRP1. Int J Clin Exp Pathol. 2018;11:4374–4384. [PMC free article] [PubMed] [Google Scholar]
- [27].Zhong Q, Chen Y, Chen Z. LncRNA MINCR regulates irradiation resistance in nasopharyngeal carcinoma cells via the microRNA-223/ZEB1 axis. Cell Cycle (Georgetown, Tex). 2020;19:53–66. [DOI] [PMC free article] [PubMed] [Google Scholar] [Retracted]
- [28].Yang W, Lan X, Li D, et al. MiR-223 targeting MAFB suppresses proliferation and migration of nasopharyngeal carcinoma cells. BMC Cancer. 2015;15:461. [DOI] [PMC free article] [PubMed] [Google Scholar]
- [29].Petersson F. Nasopharyngeal carcinoma: a review. Semin Diagn Pathol. 2015;32:54–73. [DOI] [PubMed] [Google Scholar]
- [30].Yang G, Deng Q, Fan W, et al. Cyclooxygenase-2 expression is positively associated with lymph node metastasis in nasopharyngeal carcinoma. PloS One. 2017;12:e0173641. [DOI] [PMC free article] [PubMed] [Google Scholar]
- [31].Zheng ZQ, Li ZX, Zhou GQ, et al. Long noncoding RNA FAM225A promotes nasopharyngeal carcinoma tumorigenesis and metastasis by acting as ceRNA to sponge miR-590-3p/miR-1275 and upregulate ITGB3. Cancer Res. 2019;79:4612–4626. [DOI] [PubMed] [Google Scholar]
- [32].Tian L, Zhao ZF, Xie L, et al. Taurine up-regulated 1 accelerates tumorigenesis of colon cancer by regulating miR-26a-5p/MMP14/p38 MAPK/Hsp27 axis in vitro and in vivo. Life Sci. 2019;239:117035. [DOI] [PubMed] [Google Scholar]
- [33].Yuan YL, Yu H, Mu SM, et al. MiR-26a-5p inhibits cell proliferation and enhances doxorubicin sensitivity in HCC cells via targeting AURKA. Technol Cancer Res Treat. 2019;18:1533033819851833. [DOI] [PMC free article] [PubMed] [Google Scholar]
- [34].Ye MF, Lin D, Li WJ, et al. MiR-26a-5p serves as an oncogenic MicroRNA in non-small cell lung cancer by targeting FAF1. Cancer Manag Res. 2020;12:7131–7142. [DOI] [PMC free article] [PubMed] [Google Scholar]
- [35].Yin X, Gu X, Li F, et al. LncRNA SNHG6 accelerates nasopharyngeal carcinoma progression via modulating miR-26a-5p/ARPP19 axis. Bioorg Med Chem Lett. 2021;40:127955. [DOI] [PubMed] [Google Scholar]
- [36].Soo R, Putti T, Tao Q, et al. Overexpression of cyclooxygenase-2 in nasopharyngeal carcinoma and association with epidermal growth factor receptor expression. Arch Otolaryngology Head Neck Surg. 2005;131:147–152. [DOI] [PubMed] [Google Scholar]
Associated Data
This section collects any data citations, data availability statements, or supplementary materials included in this article.
Supplementary Materials
Data Availability Statement
The datasets used and analyzed during the current study are available from the corresponding author on reasonable request.


