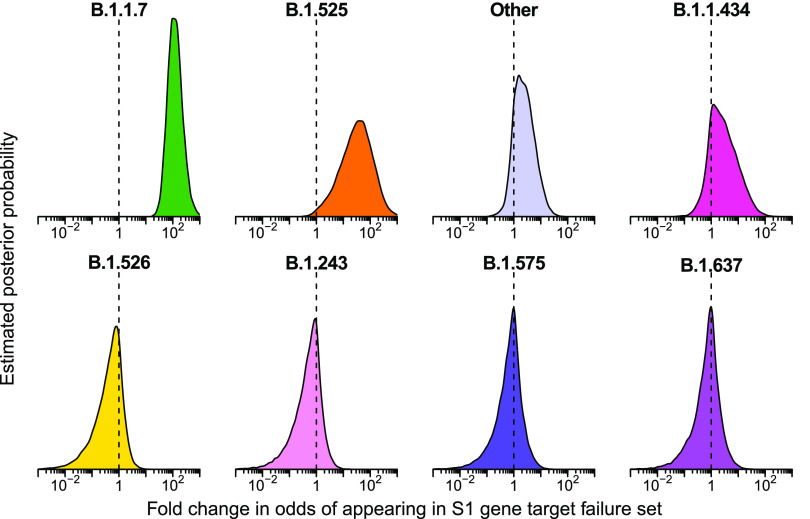
FIG 4.
Estimated posterior probability densities for the enrichment of variants among spike gene target failures produced by Bayesian autoregressive moving average multinomial logistic regression. The x axis shows the fold enrichment/depletion in the odds of a variant (labeled above each plot) appearing in the spike gene target failure set relative to the proportions estimated in the surveillance population and the y axis shows the posterior probability. No enrichment (fold change of 1) is indicated by the dashed vertical line. Increased density to the right indicates greater likelihood of inclusion among spike gene target failures, increased density to the left indicates decreased likelihood. The four lineages with highest posterior probability of enrichment are shown on the top and four lineages with high posterior probability of depletion are shown on the bottom. Color coding indicates the variant queried with colors as in earlier figures.

