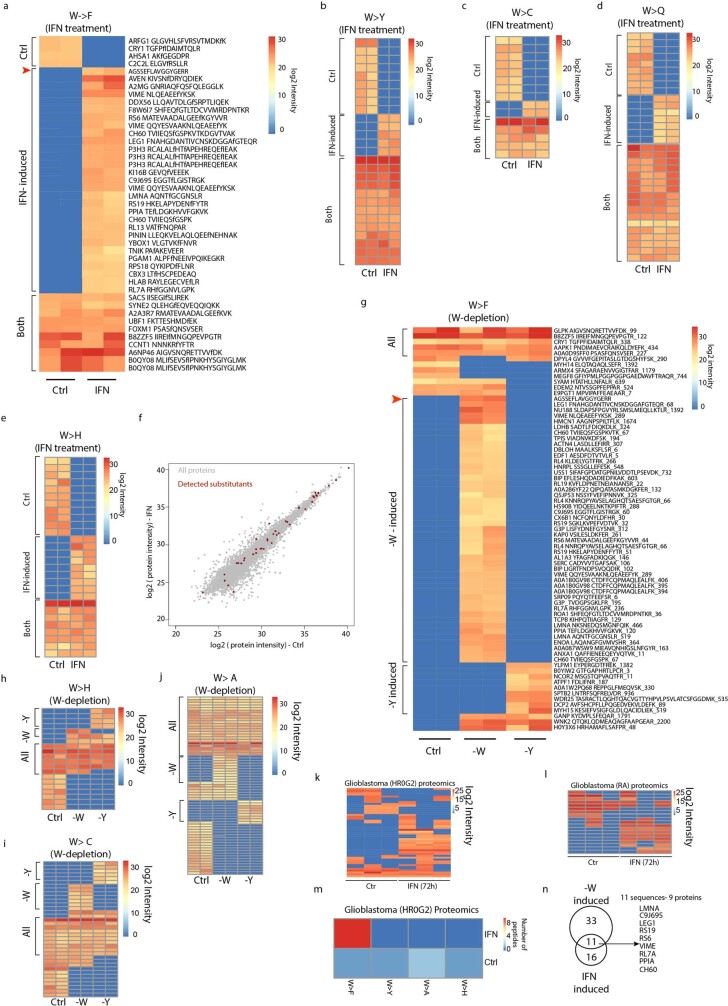
Extended Data Fig. 2. Detection of endogenous W>F substitutants.
(a) A heatmap depicting log2 peptide intensities for W>F substitution events in the proteome, selected to be reproducible across two biological replicates (1 column represents 1 replicate) in control (Ctrl) or IFNγ-treated (IFN) MD55A3-V5-ATF4(1-63)-tGFP+1 cells. Marked with an arrow is the peptide spanning the tryptophan at position 93 (W93) from the V5-ATF4(1-63)-tGFP+1 reporter. W>F substitutants are marked with a lower case “f”. (b-e) Heatmaps depicting substitutant peptide intensities detected specifically in mock (Ctrl) and IFNγ-treated (IFN) conditions; W>Y (b), W>C (c), W>Q (d) and W>H (e). (f) Scatter plot depicting protein expression calculated as log2 protein intensity from MS analysis in mock-treated (x-axis) and IFNγ-treated (y-axis) MD55A3-V5-ATF4(1-63)-tGFP+1 cells for all (grey) or substitutant (red) peptides. (g) Same analysis as in panel a, but for tryptophan (-W) and tyrosine (-Y) depletion. (h-j) Same analysis as presented in panels b-e, but for mock (Ctrl), tryptophan depletion (-W), and tyrosine depletion (-Y) conditions, for W>H (h), W>C (i) or W>A (j) comparisons. (k-l) Heatmaps depicting log 2 peptide intensities for W>F substitution events in the proteomes of glioblastoma cell lines HR0G2(k) and RA (l). (m) Heatmap depicting the number of substitutions peptides, as indicated, specifically detected in the proteomes of IFNγ−treated or control glioblastoma HROG02 cells. (n) A Venn diagram (same as Fig. 2f) depicting the overlap between the substitutant peptides specifically detected in IFNγ-treated or tryptophan-depleted MD55A3-V5-ATF4(1-63)-tGFP+1 cells with the names of the overlapping proteins indicated.

