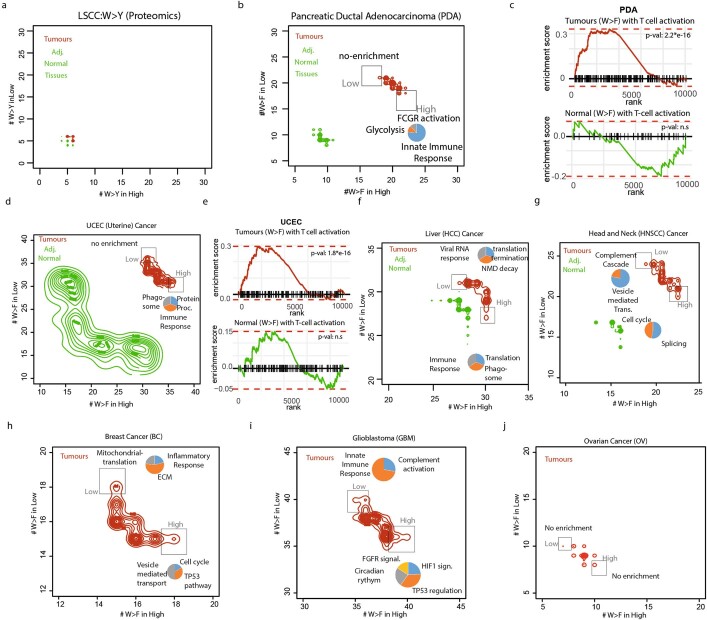
Extended Data Fig. 4. Detection of W>F substitutants in cancer proteomes.
(a) Analysis of LSCC tumour proteomes: A scatter contour plot depicting for every gene the number of W>Y peptides when the gene is higher expressed (intensity > 0) on X-axis (High Class) and when the gene is lower expressed (intensity < 0) on Y-axis (Low Class). Contours depict the density of the distribution. W>Y peptides in tumours and normal adjacent normal tissues are depicted in red and green, respectively. Inset: (HIGH) Pie chart depicting representative gene ontologies for genes that are higher expressed when the number of W>Y peptides is high in tumour samples. (LOW) Same as HIGH, but enriched for genes that are higher expressed with W>Y peptides is low. (b) Same as in panel a but for PDA tumour proteomes and for W>F peptides. (c) Gene Set Enrichment Analysis (GSEA) plot depicting the enrichment of T cell activation signature stratified against the difference in the number of substitutants in W>F High Class versus the W>F Low Class for PDA tumour and tumour-adjacent normal tissue dataset. P-values are calculated by GSEA statistical comparison of ranked distribution against random distribution. (d) Same as panel b but for UCEC tumour proteomes. (e) Same as panel c but for UCEC tumour proteomes. (f) Same as panel b but for Liver (HCC) Cancer. (g) Same as panel b but for Head and Neck (HNSCC) Cancer. (h) Same as panel a but for Breast Cancer (BC) tumours only. (i) Same as panel a but for Glioblastoma (GBM) tumours only. (j) Same as panel a but for Ovarian (OV) cancer.

