Abstract
Background
Presented work studies the association of COVID-19 severity, patient demographics, and clinical history with cycle threshold (Ct) values of SARS CoV2-rRT-PCR. We studied the Ct values for Orf1ab, N, and RdRp genes in association with all the factors mentioned above.
Methods and results
We examined the individuals (n = 6331) that consulted two private diagnostic centers for COVID-19 testing. SARS‐CoV‐2 was detected by RT‐PCR assays using different commercial kits. Clinical and demographic information was collected by the attending health care professional. Ct values were not associated with the age, sex, or clinical history of the patient. Orf1ab and N genes Ct values were only weakly associated with symptoms at the time of the SARS-CoV-2 RT-PCR test. Also, the distributions of Ct values in SARS-CoV-2 positive patients are very similar irrespective of symptomatology.
Conclusion
We conclude that the Ct values may have limitations in reliably predicting COVID-19 severity and should be used or reported with caution.
Supplementary Information
The online version contains supplementary material available at 10.1007/s11033-022-07360-x.
Keywords: COVID-19, SARS-CoV-2, Cycle threshold values
Introduction
The method generally used for diagnostic testing and screening for COVID-19 is quantitative (real-time) reverse transcriptase polymerase chain reaction (RT-PCR) analysis of viral RNA—extracted from upper respiratory tract samples [1–4]. Real-time RT-PCR cycle threshold or Ct value can be defined as the amplification cycle number required for the target gene to exceed the positivity threshold. Different countries or health organizations may recommend a slightly different Ct value (ranging between 25 and < 40) for declaring a positive result [5, 6]. In Pakistan, different labs use different cycle threshold values to determine a positive test, which usually depends upon the instructions on the commercial kits they are using [7].
The Ct values are inversely related to the viral load. They may provide an indirect method of quantifying the copy number of viral RNA in the sample. A few studies have linked Ct values with the severity of the disease (reviewed in [8]). However, others suggest that Ct values may have limitations in reliably predicting disease severity and should be used or reported with caution. There is no standardization for Ct values across various RT-PCR platforms; hence it is difficult to compare different test results. Also, there is a lack of clinical data that validates the use of Ct values to guide the management of COVID-19 cases.
The literature review indicates that there are only a handful of published studies to date that explore an association between Ct values and COVID-19 severity. Moreover, the association between Ct values and patient demographics has not been studied in detail. The presented work explores the association of various demographic factors, including the patient's age, sex, and clinical history, with Ct values. We explored the Ct values for the three target genes in association with the patient demographics. We also explored the variation in Ct values across patients that were asymptomatic or developed COVID-19 symptoms. Besides, the association between the number of detected genes and Ct values was also determined.
Material and methods
Study-population, ethics, and sample collection
This study includes the patients (n = 6331) that consulted various collection centers of the two private diagnostic centers (Hormone Lab, Lahore, and Test Zone diagnostic centre, Lahore) in Lahore between May 1, 2020, and November 30, 2020, for COVID-19 testing. The institutional biosafety committee-Hormone lab, approved the study protocol for human subjects (Ethical Approval Number HM/ 56-06). Informed consent was obtained from each study-subject before sample collection. The information on symptoms, clinical history, and demographics of each participant was collected by the attending healthcare professional. A confirmed case of COVID-19 was defined as having a positive result through real-time reverse-transcriptase-polymerase-chain-reaction (RT-PCR) assay of nasopharyngeal swab specimens. Only laboratory-confirmed cases were included in the analysis. The patients were classified as asymptomatic, have severe or mild symptoms based on the guidelines provided by the WHO [9].
RNA extraction and RT-PCR
Deep nasal cavity swab (nasopharyngeal) samples were collected from patients, and viral RNA was extracted by using FavorPrep™ Viral Nucleic Acid Extraction Kit according to the manufacturer's instructions. SARS‐CoV‐2 was detected by RT‐PCR assay using commercially available COVID‐19 Nucleic Acid Detection Kits (Sansure 1 and Sansure 2;Novel Coronavirus (2019-nCoV) Nucleic Acid Diagnostic Kit, Systaaq;2019-Novel Coronavirus (COVID-19) Multigene Real Time PCR Kit, Anatolia; Bosphore Novel Coronavirus (2019-nCoV) Detection Kit v2, and Geneproof; SARS-CoV-2 PCR Kit) according to the manufacturer's protocol.
Statistical analysis
The differences between groups were analyzed by ANOVA or t-test (paired or unpaired), where applicable. P-values < 0.05 were considered statistically significant and indicated when different.
Results and discussion
For the present study, we examined the individuals (n = 6331) that consulted two private diagnostic centers in Lahore for COVID-19 testing between May 1, 2020, and November 30, 2020. SARS‐CoV‐2 was detected by RT‐PCR assays using different commercial kits.
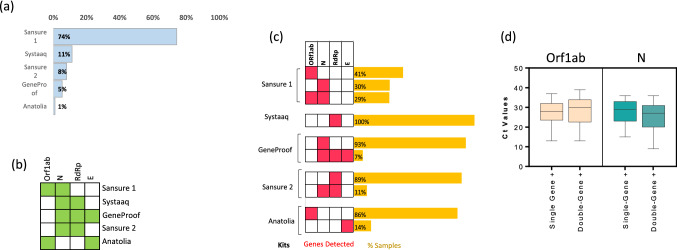
Figure 1a displays the proportion of samples analyzed by different kits. We noticed that there were two different versions of Sansure COVID-19 nuclecic acid test kits; we will refer to them as Sansure 1 and 2. The highest number of samples were analyzed by Sansure 1. The gene targets for each of the kits are displayed in Fig. 1b. We observed that 17.3% of patients were found to be PCR positive for SARS-CoV-2. Patient demographics are summarized in Table 1.
Fig. 1.
Detection frequencies of target genes and Ct values in SARS-CoV-2 positive samples. a Bar graph showing the proportion of samples analyzed by different commercial kits. b The heatmap displaying the target genes for each kit. The green-colored box indicates that this particular kit (see row labels) targets the given gene (see column labels), while the white-colored box indicates the absence of the probe for the corresponding gene. c Labels on the right side indicate the commercial kit used to analyze the SARS‐CoV‐2 suspected samples. The heatmap in the middle displays the detected genes (red, detected; white, not detected). The bar graph on the left indicates the proportion of the samples tested positive for the respective gene or combination of genes. d Box plots showing Ct values for the respective genes in single-gene positive (Orf1ab or N were detected) or double-gene positive (Orf1ab + N were detected) samples. The graphs show the distribution of Ct values, with the box indicating the 25th–75th percentiles, with the median indicated. The whiskers show the range
Table 1.
Demographic characteristics of the cohort by SARS-CoV-2 PCR status
| Variable | Total (n = 6331) | PCR Negative (n = 5237) | PCR Positive (n = 1094) |
|---|---|---|---|
| Age (years), median (IQR) | 34 (28–48) | 33 (29–46) | 42 (32–55) |
| < 20 | 410 (6.5%) | 364 (7.0%) | 46 (4.2%) |
| 20 s | 1400 (22.1%) | 1236 (23.6%) | 164 (15.0%) |
| 30 s | 1730 (27.3%) | 1485 (28.4%) | 245 (22.4%) |
| 40 s | 1137 (18.0%) | 916 (17.5%) | 221 (20.2%) |
| ≥ 50 | 1553 (24.5%) | 1154 (22.0%) | 399 (36.5%) |
| NA | 101 (1.6%) | 82 (1.6%) | 19 (1.7%) |
| Gender n (%) | |||
| Men | 4063 (64.1%) | 3323 (63.0%) | 740 (67.5%) |
| Women | 2268 (35.9%) | 1914 (37.0%) | 354 (32.5%) |
| Symptom severity | |||
| Asymptomatic | 3888 (61.4%) | 3353 (64.0%) | 535 (48.9%) |
| Mild Symptoms | 729 (11.5%) | 501 (9.6%) | 228 (20.8%) |
| Severe Symptoms | 156 (2.5%) | 99 (1.9%) | 57 (5.2%) |
| NA | 1558 (24.6%) | 1284 (24.5%) | 274 (25.0%) |
| Number of comorbidities | |||
| 0 | 5672 (89.6%) | 4709 (89.9%) | 936 (88.0%) |
| 1 | 487 (7.7%) | 391 (7.5%) | 96 (8.8%) |
| ≥ 2 | 172 (2.7%) | 137 (2.6%) | 35 (3.2%) |
Varying detection frequencies of target genes in SARS-CoV-2 positive samples
We observed that in the SARS-CoV-2-positive samples, different target genes had varying detection frequencies (Fig. 1c) For instance, the samples tested positive by the Sansure 1 kit were mostly single-gene positive—with Orf1ab gene detected in 41% and N gene in 30% of the samples. Nevertheless, 29% of the positive samples (tested via Sansure 1 kit) were double-gene positive, which means both the target genes—Orf1ab and N—were detected. Similarly, most samples tested positive via other kits were also single-gene positive.
Previous studies have shown that Ct values are lower for the samples in which more genes are detected [10]. We categorized the SARS-CoV-2 positive group into single-gene and double-gene positives to confirm this hypothesis. It has been reported that CT values show a significant difference across various kits [11]. Therefore, we only used data obtained from the same kit for each of the comparative analysis. Figure 1d compares the Ct values for Orf1ab and N genes among the participants tested SARS-CoV-2 positive using Sansure1 diagnostic kit. We observed that the single-gene positive groups displayed an approximately similar Ct values distribution to that in the double-gene positive group.
Ct-values of SARS-CoV2-rRT-PCR in association with patients' age, sex, or clinical history
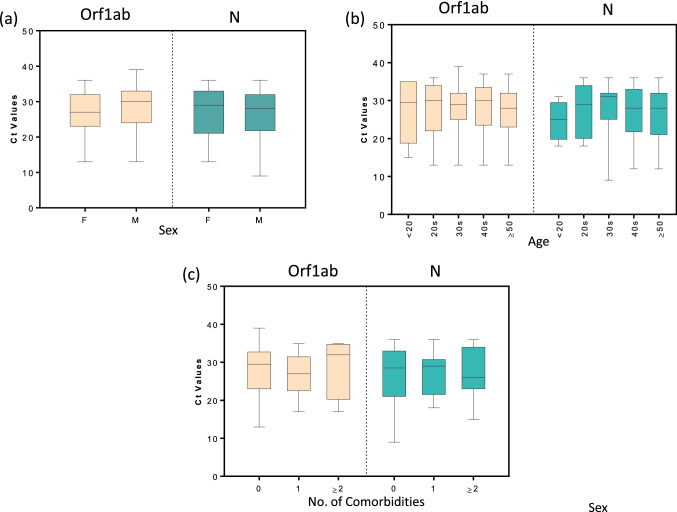
Next, we compared the Ct values between male and female participants. Figure 2a shows that the Ct values for Orf1ab and N genes (Sansure 1) were not significantly different between the two sexes. The data for the other diagnostic kits (Supplementary Fig. 1) also showed similar results for all the different genes analyzed. This observation is in line with that of Lieberman et al. [12]; they reported that the Ct values for the N gene are not significantly different between men and women.
Fig. 2.
Comparison of Ct values among participants classified according to their age, sex, or clinical history. Box plots showing Ct values for Orf1ab, N, or RdRp genes in participants classified according to a Sex, b Age, and c Number of comorbidities (0, 1, or ≥ 2). The graphs show the distribution of Ct values, with the box indicating the 25th–75th percentiles, with the median indicated. The whiskers show the range
COVID-19 cases tend to be more severe for older patients [13–15]. Here, we aimed to study the impact of age on Ct values. We categorized our study population into different age groups. It was observed that the Ct values for Orf1ab and N genes (Sansure 1) did not significantly vary across various age groups (Fig. 2b). The age-based analyses for the data obtained from other kits are presented in Supplementary Fig. 2. Similar results were also noted for the data from these kits. A previous study has also indicated that the Ct values for the N gene do not vary among different age groups [12].
It has been reported that certain comorbidities affect the severity of COVID-19. Here, we assessed whether the presence of comorbidities affects Ct values of the target genes. As shown in Fig. 2c, the Ct values for Orf1ab and N genes (Sansure 1) were not significantly different across the participants with a different number of comorbidities. Supplementary Fig. 3 compares the Ct values obtained from other diagnostic kits among people with a different number of comorbidities. These analyses also failed to provide any significant difference in the Ct values.
Ct-values of SARS-CoV2-rRT-PCR in association with symptomology
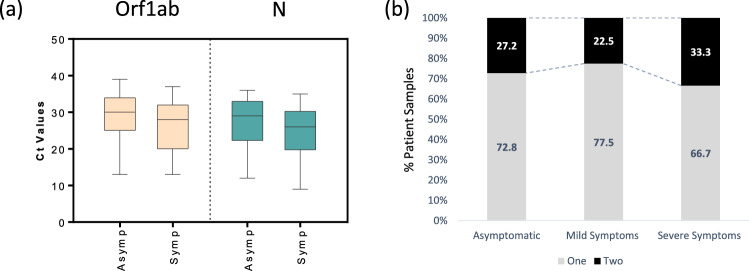
The Ct values were also compared between symptomatic versus asymptomatic SARS-CoV-2 positive patients. We observed that the median Ct values for the Orf1ab and N gene (Sansure 1) were slightly lower for the symptomatic patients (Fig. 3a). Similarly, the data obtained from yet another diagnostic kit (Anatolia) displayed a slight decrease in the median Ct values for the Orf1ab gene. Nonetheless, the Ct values for the RdRp gene (Sansure 2 and Systaaq) showed no such trend (Supplementary Fig. 4).
Fig. 3.
Comparison of Ct values among asymptomatic and symptomatic participants. a Box plots showing Ct values for Orf1ab, N, or RdRp genes in asymptomatic and symptomatic participants. The graphs show the distribution of Ct values, with the box indicating the 25th–75th percentiles, with the median indicated. The whiskers show the range. b Segmented-bar-graph displaying the percentage of samples from SARS-CoV-2 positive patients( categorized based on symptomology: Asymptomatic, Mild Symptoms or Severe Symptoms) in which one or two genes were detected
We want to emphasize that there is a significant overlap in Ct values among symptomatic and asymptomatic patients. Hence, the clinical outcome may not be predicted by only examining the Ct values obtained in the current RT-PCR assays validated to detect SARS-CoV-2 RNA. We also assessed whether the number of genes detected correlates with COVID-19 severity. Only one gene was detected in a significant majority of the positive samples, categorized based on patient symptomology. Nonetheless, there was a slight increase in double-gene positive samples in the severe symptom category (Fig. 3b).
This study shows that Ct values for Orf1ab and N genes are associated with symptoms at the time of the SARS-CoV-2 RT-PCR test. Previous works report a similar phenomenon [10, 16, 17]. However, the distributions of Ct values in SARS-CoV-2 positive patients are very similar irrespective of symptomatology. Hence, we conclude the Ct values may have limitations in reliably predicting disease severity and should be used or reported with caution.
Supplementary Information
Below is the link to the electronic supplementary material.
Acknowledgements
We are grateful to Miss Noor e Zerqoon, Mr. Banaras Masih, Mr. M. Shakeel Shafique, and Mr. Shan Yousif for their technical assistance for this project. We are also thankful to the The Public Health Initiative⃒ Pakistan, for their technical support.
Author contribution
This study was designed by NZ. Samples and data were acquired by NS, NN, AF, MZ, MI and AA; analyzed by NS, NN, RM, and NZ; and interpreted by RM and NZ. The manuscript was written by RM and NZ; and reviewed and approved by all authors.
Funding
This work was financially supported by the Social Science Research Council under Rapid-Response Grants on Covid-19 (PI: N.Zaidi) and University of the Punjab (PI: N.Zaidi).
Data availability
The datasets supporting the conclusions of this article are included within the article and supplementary files.
Code availability
Not applicable.
Declarations
Conflict of interest
The authors declare that they have no competing interests.
Informed consent
Informed consent was obtained from each study participant before the interview with WMA Declaration of Helsinki-Ethics principles for research involving human subjects.
Ethical approval
The Cancer Research Centre Bioethics Committee and the Institutional Biosafety Committee-Hormone lab, approved the study protocol for human subjects (Ethical Approval Number HM/ 56-06).
Consent for publication
Not applicable.
Footnotes
Publisher's Note
Springer Nature remains neutral with regard to jurisdictional claims in published maps and institutional affiliations.
Rimsha Munir and Nousheen Zaidi: senior authors contributed equally to this work.
References
- 1.Madurani KA, et al. Recent development of detection methods for controlling COVID-19 outbreak. J Electrochem Soc. 2021;168(3):037511. doi: 10.1149/1945-7111/abe9cc. [DOI] [Google Scholar]
- 2.Jalandra R, et al. Strategies and perspectives to develop SARS-CoV-2 detection methods and diagnostics. Biomed Pharmacother. 2020;129:110446. doi: 10.1016/j.biopha.2020.110446. [DOI] [PMC free article] [PubMed] [Google Scholar]
- 3.Mishra A, Disease C, et al. Coronavirus disease 2019 (COVID-19): origin impact, and drug development. IntechOpen. 2021 doi: 10.5772/intechopen.98358. [DOI] [Google Scholar]
- 4.Yadav AK, et al. The perspectives of biomarkers based electrochemical immunosensors, artificial intelligence and the internet of medical things towards COVID-19 diagnosis and management. Mater Today Chem. 2021 doi: 10.1016/j.mtchem.2021.100443. [DOI] [PMC free article] [PubMed] [Google Scholar]
- 5.Sule WF, Oluwayelu DO. Real-time RT-PCR for COVID-19 diagnosis: challenges and prospects. Pan Afr Med J. 2020;35(Suppl 2):121. doi: 10.11604/pamj.supp.2020.35.24258. [DOI] [PMC free article] [PubMed] [Google Scholar]
- 6.Vogels CBF, et al. Analytical sensitivity and efficiency comparisons of SARS-CoV-2 RT–qPCR primer–probe sets. Nat Microbiol. 2020;5(10):1299–1305. doi: 10.1038/s41564-020-0761-6. [DOI] [PMC free article] [PubMed] [Google Scholar]
- 7.Shoaib N, et al. COVID-19 severity: Studying the clinical and demographic risk factors for adverse outcomes. PLoS ONE. 2021;16(8):e0255999. doi: 10.1371/journal.pone.0255999. [DOI] [PMC free article] [PubMed] [Google Scholar]
- 8.Rao SN, et al. A Narrative Systematic Review of the Clinical Utility of Cycle Threshold Values in the Context of COVID-19. Infectious Diseases and Therapy. 2020;9(3):573–586. doi: 10.1007/s40121-020-00324-3. [DOI] [PMC free article] [PubMed] [Google Scholar]
- 9.WHO (2020) Coronavirus disease (COVID-19). https://www.who.int/emergencies/diseases/novel-coronavirus-2019/question-and-answers-hub/q-a-detail/coronavirus-disease-covid-19#:~:text=symptoms.
- 10.Walker AS, et al. Viral load in community SARS-CoV-2 cases varies widely and temporally. medRxiv. 2020 doi: 10.7554/eLife.64683. [DOI] [PMC free article] [PubMed] [Google Scholar]
- 11.Altamimi AM, et al. Assessment of 12 qualitative RT-PCR commercial kits for the detection of SARS-CoV-2. J Med Virol. 2021;93(5):3219–3226. doi: 10.1002/jmv.26900. [DOI] [PMC free article] [PubMed] [Google Scholar]
- 12.Lieberman NAP, et al. In vivo antiviral host transcriptional response to SARS-CoV-2 by viral load, sex, and age. PLoS Biol. 2020;18(9):e3000849. doi: 10.1101/2020.06.22.165225. [DOI] [PMC free article] [PubMed] [Google Scholar]
- 13.Li X, et al. Risk factors for severity and mortality in adult COVID-19 inpatients in Wuhan. J Allergy Clin Immunol. 2020;146(1):110–118. doi: 10.1016/j.jaci.2020.04.006. [DOI] [PMC free article] [PubMed] [Google Scholar]
- 14.Liu W, et al. Analysis of factors associated with disease outcomes in hospitalized patients with 2019 novel coronavirus disease. Chin Med J (Engl) 2020;133(9):1032–1038. doi: 10.1097/CM9.0000000000000775. [DOI] [PMC free article] [PubMed] [Google Scholar]
- 15.Al-Lami RA, et al. Sex hormones and novel corona virus infectious disease (COVID-19) Mayo Clin Proc. 2020;95(8):1710–1714. doi: 10.1016/j.mayocp.2020.05.013. [DOI] [PMC free article] [PubMed] [Google Scholar]
- 16.Edwards T, et al. Variation of SARS-CoV-2 viral loads by sample type, disease severity and time: a systematic review. medRxiv. 2020 doi: 10.1001/jamainternmed.2020.3862. [DOI] [PMC free article] [PubMed] [Google Scholar]
- 17.Lee S, et al. Clinical course and molecular viral shedding among asymptomatic and symptomatic patients with SARS-CoV-2 infection in a community treatment center in the Republic of Korea. JAMA Intern Med. 2020;180(11):1447–1452. doi: 10.1001/jamainternmed.2020.3862. [DOI] [PMC free article] [PubMed] [Google Scholar]
Associated Data
This section collects any data citations, data availability statements, or supplementary materials included in this article.
Supplementary Materials
Data Availability Statement
The datasets supporting the conclusions of this article are included within the article and supplementary files.
Not applicable.


