

Abstract
Background and aims
Mobile phone addiction (MPA) is frequently reported to be correlated with anxiety, depression, stress, impulsivity, and sleep quality among college students. However, to date, there is no consensus on the extent to which those factors are correlated with MPA among college students. We thus performed a meta-analysis to quantitatively synthesize the previous findings.
Methods
A systematic review and meta-analysis was conducted by searching PubMed, Embase, Cochrane Library, Wanfang, Chinese National Knowledge Infrastructure (CNKI), China Science and Technology Journal Database (VIP), and Chinese Biological Medicine (CBM) databases from inception to August 1, 2020. Pooled Pearson's correlation coefficients between MPA and anxiety, depression, impulsivity, and sleep quality were calculated by R software using random effects model.
Results
Forty studies involving a total of 33, 650 college students were identified. Weak-to-moderate positive correlations were found between MPA and anxiety, depression, impulsivity and sleep quality (anxiety: summary r = 0.39, 95% CI = 0.34–0.45, P < 0.001, I2 = 84.9%; depression: summary r = 0.36, 95% CI = 0.32–0.40, P < 0.001, I2 = 84.2%; impulsivity: summary r = 0.38, 95% CI = 0.28–0.47, P < 0.001, I2 = 94.7%; sleep quality: summary r = 0.28, 95% CI = 0.22–0.33, P < 0.001, I2 = 85.6%). The pooled correlations revealed some discrepancies when stratified by some moderators. The robustness of our findings was further confirmed by sensitivity analyses.
Conclusions
The current meta-analysis provided solid evidence that MPA was positively correlated with anxiety, depression, impulsivity, and sleep quality. This indicated that college students with MPA were more likely to develop high levels of anxiety, depression, and impulsivity and suffer from poor sleep quality. More studies, especially large prospective studies, are warranted to verify our findings.
Keywords: Mobile phone addiction, anxiety, depression, impulsivity, sleep quality, college students, meta-analysis
Introduction
Mobile phones, especially smartphones, are widely used worldwide. Compared with traditional mobile phones, smartphones are superior with their numerous functions depending on the ways to use (Grant, Lust, & Chamberlain, 2019; Y. Zhang et al., 2020). Owing mobile phones enables us to connect with anyone, anywhere, and at any time; it also helps us stay organized, makes everyday chores easier via mobile apps, ensures stress-free travel via GPS apps or navigation apps, helps us deal with emergency situations, provides easy access to information and technology for students, and even promotes overall health and well-being via health-related apps. Given the convenience and efficiency that they provide to our daily lives, mobile phones have achieved generalized popularity in present society, and the number of mobile phone owners is rapidly increasing. According to a recent report, the number of mobile phone users was approximately 4.78 billion in 2020, which accounts for approximately 61.62% of the global population (BankMyCell, 2020).
Mobile phones are a “double-edged” sword that facilitates our modern lives and might cause a series of worrisome problems due to excessive use or even mobile phone addiction (MPA) (Choi et al., 2015). MPA was previously defined as the inability to regulate one's mobile phone usage, which would eventually lead to negative consequences in daily life (Joël Billieux, 2012). MPA had many synonyms in the literature. Sometimes, it was also known as “smartphone addiction,” “problematic smartphone use,” “excessive smartphone use,” “problematic mobile phone use,” and “mobile phone dependence.”
Unfortunately, it was reported that college students were more vulnerable to MPA (Long et al., 2016). Compared to older social groups, college students are usually mentally immature and have less self-regulatory ability (L. Li et al., 2018). Therefore, they are more likely to use mobile phones excessively. Furthermore, today's college students are “digital natives” who grow up with the surroundings of mobile phones. Thus, mobile phones have become a necessity in their lives (Long et al., 2016). The prevalence of MPA among college students varied greatly in previous studies depending on the measurement instruments and study populations. According to a meta-analysis, the average prevalence of MPA among Chinese college students was approximately 23% (Tao, Luo, Huang, & Liang, 2018).
An increasing amount of evidence has shown that MPA is closely related to many detrimental psychological and behavioral problems such as anxiety, depression, stress, impulsivity, poor sleep quality, and maladaptive behavioral difficulties (Demirci, Akgonul, & Akpinar, 2015; Thomee, 2018). Based on published literature, anxiety, depression, impulsivity, and sleep quality are among those factors that were most frequently observed among college students. Since MPA was not included in the fifth edition of the Diagnostic and Statistical Manual of Mental Disorders (American Psychiatric Association, 2013), there is no official uniform diagnostic criteria to date. Currently, the most widely used screening instruments for MPA include the Mobile Phone Addiction Index (MPAI) (Leung, 2008), the Mobile Phone Addiction Tendency Scale for College Students (MPATS) (Xiong, Zhou, Chen, You, & Zhai, 2012), the Smartphone Addiction Inventory (SPAI) and its Brazilian version (SPAI-BR) (Khoury et al., 2017; Lin et al., 2014), and the Smartphone Addiction Scale (SAS) and its short version (SAS-SV) (Kwon, Kim, Cho, & Yang, 2013; Kwon, Lee, et al., 2013). Similarly, the most commonly used questionnaire for impulsivity is the Barratt Impulsiveness Scale (BIS-11) and its short form BIS-15 (Patton, Stanford, & Barratt, 1995; Spinella, 2007). The most commonly used questionnaire for sleep quality is the Pittsburgh Sleep Quality Index (PSQI) (Buysse, Reynolds, Monk, Berman, & Kupfer, 1989). No obvious tendency was found for the measurement instruments of anxiety and depression.
However, there has been no consensus on the extent to which these factors are correlated with MPA among college students so far. Therefore, we conducted a meta-analysis to quantitatively synthesize the Pearson's correlation coefficients between MPA and anxiety, depression, impulsivity, and sleep quality.
Materials and methods
The current meta-analysis was conducted and reported according to the Preferred Reporting Items for Systematic Review and Meta-Analyses (PRISMA) guidelines (Moher, Liberati, Tetzlaff, Altman, & The PRISMA Group, 2009). Moreover, the protocol has been registiered in PROSPERO (ID: CRD42020173405), an international prospective registry of systematic reviews.
Searching strategy
Relevant literature was retrieved by searching studies the PubMed, Embase, Cochrane Library, Wanfang, Chinese National Knowledge Infrastructure (CNKI), China Science and Technology Journal Database (VIP), and Chinese Biological Medicine (CBM) databases for studies published prior to August 1, 2020. Search terms used for mobile phones included “cell phone*,” “cellular phone*,” “cellular telephone*,” “mobile devices,” “mobile phone,” “smart phone” and “smartphone.” Search terms used for addiction included “addiction,” “dependence,” “dependency,” “abuse,” “addicted to,” “overuse,” “problem use,” and “compensatory use.” Search terms for college students included “college students,” “university students” and “undergraduate students.” Other search terms such as “smartphone use disorder,” “problematic smartphone use,” “problematic smart phone use,” “problematic mobile phone use,” “problematic cell phone use,” “problematic cellular phone use,” and “Nomophobia” were also taken into consideration. Finally, those search terms were combined using appropriate Boolean operators. A detailed search strategy is available in Appendix A. Publication languages were limited to English and Chinese. The reference lists of the retrieved articles were also manually checked to identify additional relevant papers.
Study selection criteria
All literature records were independently screened against the following selection criteria by two reviewers for potentially eligible articles: (a) cross-sectional studies offering Pearson's correlation coefficients for the associations between MPA and anxiety, depression, impulsivity, or sleep quality; (b) participants were college students; (c) MPA measurement instruments were limited to the MPAI, MPATS, SAS, SAS-SV, SPAI or SPAI-BR; (d) impulsivity measurement instruments were limited to the BIS-11 or BIS-15; (e) sleep quality measurement instrument was limited to the PSQI; (f) there was no restriction on anxiety and depression scales; (g) published in English or Chinese; (h) conference abstracts and review articles were excluded; (i) literature with poor quality or apparent data mistakes were also excluded; (j) studies with sample sizes lower than 250 were excluded; (k) when duplicate publications reporting on the same participants were identified, the primary study was selected.
Data extraction
Data were independently extracted by two researchers (YL and GXL) using a purpose-designed form. Any discrepancy was resolved by discussion. The following information was extracted: first author, year of publication, geographic location, students' specialty, survey method, sample size, cases of male and female students, school year, mean age, instruments used to measure the degree of MPA, instruments used to measure levels of anxiety, depression, impulsivity and sleep quality, Pearson's correlation coefficients between MPA and the above four outcomes.
Quality assessment
The methodological quality of all studies included was independently assessed by two researchers (GXL and YL) using the nine-item Joanna Briggs Institution Critical Appraisal Checklist for Studies Reporting Prevalence Data (Munn, Moola, Lisy, Riitano, & Tufanaru, 2015) (see Appendix B). A minor adjustment was made to the third item. That is, the proper sample size was judged according to Pearson's correlation study design rather than the prevalence study design. For ambiguous items, they would seek assistance from the third researcher (HW) to achieve a consensus. The answers for each item included “yes,” “no,” “unclear,” and “not applicable.” The item would be scored one if the answer is “yes.” Otherwise, it would be scored zero. Higher scores reflected better methodological quality. Detailed information about quality assessment is shown in Appendix C. All included studies were considered to be of moderate to high quality (total score≥6).
Statistical analysis
The pooled Pearson's correlation coefficients and their corresponding 95% confidence intervals (CIs) between MPA and anxiety, depression, impulsivity, and sleep quality were calculated using the inverse variance method. To obtain variance-stabilized correlation coefficients, Pearson's correlation coefficients were transformed into Fisher's Z scores before the pooled estimate, which was previously described by Y. Zhang et al., 2020. Heterogeneity across studies was assessed using Cochran's Q and I2 statistics. A P-value <0.10 or I2 > 50% indicated that the between-study heterogeneity was statistically significant. Then, the random effects model was used to calculate the summary Pearson's correlation coefficient. Otherwise, the fixed effects model would be used.
Subgroup analyses were completed based on geographic location, students' specialty (medical students or not), sampling strategy (random sampling or not), sample size (≥500 or <500), sex ratio (≥0.6 or <0.60), survey method, MPA measurement instruments, and the measurement instruments for the four targeted outcomes. The between-subgroup difference was compared by meta-regression analysis. To evaluate the influence of individual studies on the summary correlation coefficients and test the robustness of the correlations between MPA and anxiety, depression, impulsivity and sleep quality, sensitivity analyses were conducted by sequentially omitting one study each turn. Potential publication bias was detected using funnel plots. Additionally, Begg's rank correlation test and Egger's linear regression test were performed to help us judge publication bias. In case of publication bias, the trim-and-fill method was used to adjust for funnel plot asymmetry. All statistical analyses were conducted using R software, version 3.6.0 (packages meta, R foundation).
Results
Characteristics of the eligible studies
Our search strategy identified 4, 773 studies without duplicates (Fig. 1). There were 4, 429 studies excluded according to titles and abstracts. Additionally, six articles were manually retrieved from reference lists. Finally, the full texts of 350 articles were reviewed. We excluded 242 studies because they were either irrelevant, not correlation studies, duplicate publications, had insufficient data, had apparent data mistakes, or had a small sample size. Furthermore, sixty-eight studies were removed for the following reasons: measurement instruments not meeting the inclusion criteria, conference abstracts or reviews, or poor quality. As shown in Table 1, forty studies (Aker, Sahin, Sezgin, & Oguz, 2017b; B. Chen, Ying, Fang, Li, & Yue, 2016; C. Chen, Liang, Yang, & Zhou, 2019; J. Chen, Li, Yang, Wang, & Hong, 2020; L. Chen & Zeng, 2017; X. Chen, 2018; Cheng, Zhang, Chen, & Pang, 2020; Choi et al., 2015; Demirci et al., 2015; Dong, 2018; Elhai, Yang, Fang, Bai, & Hall, 2020; Gundogmus, Taşdelen; Kul, & Çoban, 2020; H. Huang, Hou, Yu, & Zhou, 2014; H. Huang et al., 2015; M.; Huang, Han, & Chen, 2019; Jiang, He, & Wang, 2019; Khoury, 2019; H. Li, Li, & Zhang, 2018; J.; Li, 2016; L.; Li, Mei, & Niu, 2016; M.; Li, 2018; S. Li, Peng, & Ni, 2020; T. Liu, Zhou, Tang, & Wang, 2017; Z. Liu & Zhu, 2018; Luo, Xiong, Zhang, & Mao, 2019; Mei, Chai, Li, & Wang, 2017; Nie & Yang, 2019; Niu, Huang, & Guo, 2018; Qing, Cao, & Wu, 2017; Shi, Jin, Xv, & Li, 2016; Song, Xie, & Li, 2019; Wang, Sigerson, Jiang, & Cheng, 2018; Yan, Tong, Guo, Yan, & Guo, 2018; Zhan, 2017; M. X. Zhang & Wu, 2020; Y. Zhang et al., 2020; Y. Zhang, Zhang, Xiong, & Gu, 2018; F. Zhou, 2018; L. Zhou, Jin, & Wang, 2019; Zhu, Tian, Zhi, & Zhang, 2019) ultimately met the inclusion criteria, involving a total of 33, 650 college students. Of these forty studies, thirteen reported Pearson's correlation coefficients between MPA and anxiety, twenty-one reported Pearson's correlation coefficients between MPA and depression, seven reported Pearson's correlation coefficients between MPA and impulsivity, and fourteen reported Pearson's correlation coefficients between MPA and sleep quality. Most of the studies were from China, except for five studies (Aker et al., 2017b; Choi et al., 2015; Demirci et al., 2015; Gundogmus et al., 2020; Khoury, 2019).
Fig. 1.

The flow chart of the study selection process
Table 1.
The characteristics of MPA-related 40 studies included in this meta-analysis
| First author, year, country | Medical students | Paper-and-pencil survey | Male/Female | School year | Age (mean ± SD) | MPA measure-ment | Measurement instrument (Pearson's r) | |||
| Anxiety | Depression | Impulsivity | Sleep quality | |||||||
| Chen JJ, 2020, China | Yes | Yes | 230/348 | 1st–2nd | 19.7 ± 1.02 | MPAI | DASS-21(0.451) | DASS-21(0.411) | N/A | N/A |
| Cheng L, 2020, China | Yes | Yes | 91/254 | 1st–4th | 20.25 ± 1.14 | MPATS | N/A | N/A | N/A | PSQI(0.248) |
| Elhai JD, 2020, China | No | No | 359/675 | 1st–2nd | 19.34 ± 1.61 | SAS-SV | DASS-21(0.48) | DASS-21(0.43) | N/A | N/A |
| Gundogmus I, 2020, Turkey | Mixed | Yes | 578/791 | N/A | 21.54 ± 2.97 | SAS-SV | N/A | N/A | N/A | PSQI(0.326) |
| Li SB, 2020, China | No | Yes | 95/503 | 1st–2nd | 19.48 ± 0.93 | MPAI | N/A | N/A | N/A | PSQI(0.386) |
| Zhang MX, 2020, China | No | No | 145/282 | N/A | 19.36 ± 1.06 | MPAI | N/A | N/A | N/A | PSQI(0.23) |
| Zhang YC, 2020, China | Mixed | Yes | 522/782 | 1st–2nd | 19.7 ± 1.03 | MPAI | N/A | DASS-21(0.46) | N/A | N/A |
| Chen CY, 2019, China | No | Yes | 349/399 | 1st–3rd | 19.36 ± 1.20 | MPAI | N/A | CES-D(0.343) | N/A | N/A |
| Huang MM, 2019, China | No | Yes | 204/300 | N/A | 20.10 ± 1.51 | MPATS | N/A | SDS(0.408) | N/A | N/A |
| Jiang XJ, 2019, China | Yes | Yes | 155/310 | 1st–5th | 19.94 ± 1.51 | SAS-SV | GAD-7(0.266) | N/A | N/A | PSQI(0.268) |
| Khoury JM, 2019, Brazil | No | Yes | 189/226 | N/A | 23.6 ± 3.4 | SPAI-BR | N/A | N/A | BIS-11(0.36) | N/A |
| Luo XS, 2019, China | Yes | Yes | 226/448 | 1st–3rd | N/A | MPAI | N/A | SDS(0.407) | N/A | N/A |
| Nie GH, 2019, China | Yes | Yes | 349/849 | 1st–4th | N/A | MPAI | N/A | CES-D(0.26) | N/A | PSQI(0.28) |
| Song LP, 2019, China | Yes | Yes | 18/284 | N/A | N/A | MPAI | N/A | SDS(0.344) | N/A | N/A |
| Zhou L, 2019, China | Mixed | Yes | 252/282 | 1st–5th | N/A | MPAI | N/A | N/A | N/A | PSQI(0.519) |
| Zhu Q, 2019, China | Yes | Yes | 526/631 | 1st–5th | N/A | SPAI | N/A | N/A | BIS-11(0.19) | N/A |
| Chen XH, 2018, China | Yes | Yes | 750 (N/A) | N/A | N/A | MPATS | N/A | N/A | N/A | PSQI(0.176) |
| Dong DD, 2018, China | No | Yes | 194/281 | 1st–4th | N/A | MPAI | SCL-90(0.33) | SCL-90(0.379) | N/A | N/A |
| Li H, 2018, China | Yes | Yes | 292/534 | 1st–3rd | 20.1 ± 1.2 | MPAI | SAS(0.267) | N/A | N/A | N/A |
| Li M, 2018, China | No | Mixed | 116/238 | 1st–4th | N/A | MPAI | N/A | N/A | N/A | PSQI(0.172) |
| Liu ZQ, 2018, China | No | No | 1,333/584 | N/A | 19.31 ± 1.39 | MPATS | SAS(0.455) | N/A | N/A | N/A |
| Niu LY, 2018, China | No | Yes | 1,344/1,050 | 1st–3rd | 19.10 ± 1.33 | MPAI | N/A | N/A | BIS-11(0.45) | N/A |
| Wang HY, 2018, China | No | Yes | 361/102 | N/A | 18.75 ± 0.99 | SPAI | N/A | CES-D(0.32) | BIS-15(0.43) | N/A |
| Yan MZ, 2018, China | Yes | Yes | 211/226 | 1st–5th | 20 ± 1 | MPATS | N/A | N/A | N/A | PSQI(0.303) |
| Zhang Y, 2018, China | No | Yes | 324/351 | 1st–4th | 20.99 ± 1.75 | MPAI | DASS-21(0.315) | DASS-21(0.317) | N/A | N/A |
| Zhou FR, 2018, China | No | Yes | 174/206 | 1st–4th | N/A | MPATS | N/A | CES-D(0.324) | N/A | N/A |
| Aker S, 2017, Turkey | Yes | Yes | 119/375 | N/A | 20.22 ± 0.05 | SAS-SV | N/A | GHQ-28(0.28) | N/A | N/A |
| Chen L, 2017, China | No | Yes | 189/382 | 1st–4th | 20.23 ± 1.67 | MPATS | SCL-90(0.4) | SCL-90(0.45) | N/A | N/A |
| Liu TT, 2017, China | Yes | No | 218/1,599 | 2nd | 19.67 ± 0.56 | MPATS | N/A | N/A | N/A | PSQI(0.277) |
| Mei SL, 2017, China | Yes | Yes | 404/505 | 1st–5th | N/A | MPATS | N/A | N/A | BIS-11(0.22) | N/A |
| Qing ZH, 2017, China | No | Yes | 125/137 | 1st–4th | N/A | MPAI | SCL-90(0.288) | SCL-90(0.313) | N/A | N/A |
| Zhan HD, 2017, China | No | Yes | 302/804 | 1st–4th | N/A | MPATS | N/A | SDS(0.29) | N/A | N/A |
| Chen BF, 2016, China | Yes | Yes | 149/178 | N/A | 20.7 ± 2.21 | SAS | N/A | BDI(0.285) | N/A | PSQI(0.194) |
| Li L, 2016, China | Yes | Yes | 517/536 | 1st–4th | 20.4 ± 1.1 | SAS | N/A | N/A | N/A | PSQI(0.174) |
| Li JM, 2016, China | Yes | Yes | 528/577 | 1st–3rd | N/A | MPAI | DASS-21(0.447) | DASS-21(0.407) | N/A | N/A |
| Shi GR, 2016, China | Mixed | Yes | 413/841 | 1st–4th | N/A | MPAI | N/A | N/A | BIS-11(0.40) | N/A |
| Choi SW, 2015, Korea | Mixed | Yes | 178/270 | 1st–4th | 0.89 ± 3.09 | SAS | STAI-T(0.347) | BDI(0.063) | N/A | N/A |
| Demirci K, 2015, Turkey | No | Yes | 116/203 | N/A | 20.5 ± 2.45 | SAS | BAI(0.276) | BDI(0.267) | N/A | PSQI(0.156) |
| Huang H, 2015, China | No | Yes | 1,409/1,105 | 1st–3rd | 19.23 ± 1.34 | MPAI | N/A | N/A | BIS-11(0.45) | N/A |
| Huang H, 2014, China | No | Yes | 680/492 | 2nd–3rd | 19.95 ± 1.11 | MPAI | SCL-90(0.45) | SCL-90(0.42) | N/A | N/A |
Abbreviations: BAI, Beck Anxiety Inventory; BDI, Beck Depression Inventory; BIS-11, Barrat Impulsivity Scale 11; BIS-15, the short form of the Barratt Impulsiveness Scale; CES-D, the Center for Epidemiological Studies Depression Scale; DASS-21, Depression anxiety stress scale-21; GAD-7, General Anxiety Disorder Scale-7; GHQ-28, the General Health Questionnaire; MPA, mobile phone addiction; MPAI, Mobile Phone Addiction Index; MPATS, Mobile Phone Addiction Tendency Scale for College Students; PSQI, Pittsburgh Sleep Quality Index; SAS, the Smartphone Addiction Scale or Self-rating Anxiety Scale; SAS-SV, the Smartphone Addiction Scale-Short Version; SCL-90, the Symptom checklist 90; SDS, Self-rating Depression Scale; SPAI, the Smartphone Addiction Inventory; SPAI-BR, Brazilian version of the Smartphone Addiction Inventory. STAI-T, the State-Trait Anxiety Inventory-Trait Version.
Pooled analyses
The number of college students involved in the correlations between MPA and anxiety, depression, impulsivity, and sleep quality was 9,847, 14,139, 9,106, and 9,969, respectively. Considering the significant between-study heterogeneity, random effects models were therefore used for the summary of four different outcomes (heterogeneity for anxiety: I2 = 84.9%, P < 0.01; heterogeneity for depression: I2 = 84.2%, P < 0.01; heterogeneity for impulsivity: I2 = 94.7%, P < 0.01; heterogeneity for sleep quality: I2 = 85.6%, P < 0.01). Our results demonstrated that MPA was positively correlated with anxiety, depression, impulsivity, and sleep quality (anxiety: summary r = 0.39, 95% CI = 0.34–0.45, P < 0.001; depression: summary r = 0.36, 95% CI = 0.32–0.40, P < 0.001; impulsivity: summary r = 0.38, 95% CI = 0.28–0.47, P < 0.001; sleep quality: summary r = 0.28, 95% CI = 0.22–0.33, P < 0.001) (Figs. 2 and 3).
Fig. 2.

Forest plots for the correlation between mobile phone addiction (MPA) and anxiety (A), and depression (B), respectively
Fig. 3.

Forest plots for the correlation between mobile phone addiction (MPA) and impulsivity (A), and sleep quality (B), respectively
Subgroup analyses
As shown in Table 2, the summary correlation coefficient between MPA and anxiety did not reveal any significant difference when stratified by geographic location, students' specialty, sampling strategy, sex ratio, MPA measurement instrument, and measurement instrument for anxiety (all with P > 0.05). However, we found that the summary correlation coefficient for anxiety in studies with large sample sizes were higher than that in studies with small sample sizes (≥500: summary r = 0.44, 95% CI: 0.38–0.50, P < 0.001; <500: summary r = 0.31, 95% CI: 0.27–0.36, P < 0.001; between-subgroup P < 0.01). Similarly, the summary correlation coefficient for the electronic survey group (summary r = 0.50, 95% CI = 0.47–0.54, P < 0.001) was significantly higher than that for the paper-and-pencil survey group (summary r = 0.37, 95% CI = 0.32–0.43, P < 0.001), with a between-subgroup P of 0.03.
Table 2.
Subgroup analyses of the summary correlation between MPA and anxiety among college students
| Moderators | No. of studies | Sample size | Summary r (95%CI) | P a | P b | Heterogeneity | |
| I2 (%) | P c | ||||||
| Geographic location | |||||||
| China | 11 | 9,080 | 0.41 (0.35, 0.46) | <0.001 | Ref | 86.0 | <0.01 |
| Other countries | 2 | 767 | 0.33 (0.25, 0.40) | <0.001 | 0.29 | 12.6 | 0.28 |
| Medical students # | |||||||
| Yes | 4 | 2,974 | 0.38 (0.26, 0.50) | <0.001 | Ref | 90.6 | <0.01 |
| No | 8 | 6,425 | 0.41 (0.34, 0.47) | <0.001 | 0.69 | 82.8 | <0.01 |
| Random sampling | |||||||
| Yes | 8 | 5,869 | 0.37 (0.29, 0.45) | <0.001 | Ref | 88.4 | <0.01 |
| No | 5 | 3,978 | 0.43 (0.37, 0.50) | <0.001 | 0.29 | 76.2 | <0.01 |
| Sample size | |||||||
| ≥500 | 8 | 7,878 | 0.44 (0.38, 0.50) | <0.001 | Ref | 85.5 | <0.01 |
| <500 | 5 | 1,969 | 0.31 (0.27, 0.36) | <0.001 | <0.01 | 0 | 0.63 |
| Sex ratio (M/F) | |||||||
| ≥0.6 | 8 | 6,632 | 0.42 (0.36, 0.47) | <0.001 | Ref | 77.8 | <0.01 |
| <0.6 | 5 | 3,215 | 0.36 (0.25, 0.47) | <0.001 | 0.32 | 89.9 | <0.01 |
| Survey method | |||||||
| Paper-and-pencil | 11 | 6,896 | 0.37 (0.32, 0.43) | <0.001 | Ref | 81.2 | <0.01 |
| Electronic | 2 | 2,951 | 0.50 (0.47, 0.54) | <0.001 | 0.03 | 0.0 | 0.41 |
| MPA measurement instrument | |||||||
| MPAI | 7 | 5,093 | 0.39 (0.31, 0.46) | <0.001 | Ref | 85.3 | <0.01 |
| MPATS | 2 | 2,488 | 0.47 (0.40, 0.53) | <0.001 | 0.38 | 49.7 | 0.16 |
| SAS/SAS-SV | 4 | 2,266 | 0.36 (0.23, 0.50) | <0.001 | 0.74 | 89.3 | <0.01 |
| Anxiety measurement instrument | |||||||
| BAI | 1 | 319 | 0.28 (0.17, 0.39) | <0.001 | Ref | N/A | N/A |
| DASS-21 | 4 | 3,392 | 0.46 (0.37, 0.54) | <0.001 | 0.16 | 82.3 | <0.01 |
| GAD-7 | 1 | 465 | 0.27 (0.18, 0.36) | <0.001 | 0.94 | N/A | N/A |
| SAS | 2 | 2,743 | 0.38 (0.17, 0.60) | <0.001 | 0.44 | 96.3 | <0.01 |
| SCL-90 | 4 | 2,480 | 0.40 (0.31, 0.48) | <0.001 | 0.37 | 74.2 | <0.01 |
| STAI-T | 1 | 448 | 0.36 (0.27, 0.45) | <0.001 | 0.61 | N/A | N/A |
Note: aP value for the within-subgroup effect sizes by Z test; bP value for between-subgroup difference using meta-regression analysis; cP value for the heterogeneity within subgroups by Q test. #One study in which medical and nonmedical students mixed together was excluded.
Abbreviations: BAI, Beck Anxiety Inventory; CI, confidence interval; DASS-21, Depression anxiety stress scale-21; GAD-7, General Anxiety Disorder Scale-7; MPA, mobile phone addition; MPAI, Mobile Phone Addiction Index; MPATS, Mobile Phone Addiction Tendency Scale for College Students; SAS, Self-rating Anxiety Scale; SAS/SAS-SV, Smartphone Addiction Scale or its Short Version; SCL-90, Symptom checklist 90; STAI-T, State-Trait Anxiety Inventory-Trait Version.
Subgroup analyses showed that geographic location (P < 0.001), sample size (P < 0.01), measurement instrument for depression (all P < 0.05 except for the GHQ-28 group), not student's specialty (P = 0.75), sampling strategy (P = 0.42), sex ratio (P = 0.90), survey method (P = 0.29) or measurement instrument for MPA (all P ≥ 0.05) had a significant impact on the summary correlation coefficient between MPA and depression (Table 3).
Table 3.
Subgroup analyses of the summary correlation between MPA and depression among college students
| Moderators | No. of studies | Sample size | Summary r (95%CI) | P a | P b | Heterogeneity | |
| I2 (%) | P c | ||||||
| Geographic location | |||||||
| China | 18 | 12,878 | 0.39 (0.35, 0.42) | <0.001 | Ref | 76.5 | <0.01 |
| Other countries | 3 | 1,261 | 0.21 (0.06, 0.35) | <0.001 | <0.001 | 85.5 | <0.01 |
| Medical students # | |||||||
| Yes | 7 | 4,678 | 0.36 (0.30, 0.42) | <0.001 | Ref | 77.9 | <0.01 |
| No | 12 | 7,709 | 0.38 (0.34, 0.42) | <0.001 | 0.75 | 68.9 | <0.01 |
| Random sampling | |||||||
| Yes | 13 | 8,456 | 0.38 (0.33, 0.43) | <0.001 | Ref | 81.4 | <0.01 |
| No | 8 | 5,683 | 0.34 (0.26, 0.42) | <0.001 | 0.42 | 88.5 | <0.01 |
| Sample size | |||||||
| ≥500 | 12 | 10,669 | 0.41 (0.36, 0.45) | <0.001 | Ref | 82.6 | <0.01 |
| <500 | 9 | 3,470 | 0.30 (0.23, 0.36) | <0.001 | <0.01 | 74.9 | <0.01 |
| Sex ratio (M/F) | |||||||
| ≥0.6 | 13 | 8,441 | 0.36 (0.31, 0.42) | <0.001 | Ref | 85.1 | <0.01 |
| <0.6 | 8 | 5,698 | 0.36 (0.29, 0.42) | <0.001 | 0.90 | 83.4 | <0.01 |
| Survey method | |||||||
| Paper-and-pencil | 20 | 13,105 | 0.36 (0.31, 0.40) | <0.001 | Ref | 84.0 | <0.01 |
| Electronic | 1 | 1,034 | 0.46 (0.40, 0.52) | <0.001 | 0.29 | N/A | N/A |
| MPA measurement instrument | |||||||
| MPAI | 11 | 8,493 | 0.39 (0.35, 0.44) | <0.001 | Ref | 78.2 | <0.01 |
| MPATS | 4 | 2,561 | 0.39 (0.29, 0.48) | <0.001 | 0.94 | 80.7 | <0.01 |
| SAS/SAS-SV | 5 | 2,622 | 0.28 (0.14, 0.42) | <0.001 | 0.05 | 92.1 | <0.01 |
| SPAI | 1 | 463 | 0.33 (0.24, 0.42) | <0.001 | 0.58 | N/A | N/A |
| Depression measurement instrument | |||||||
| BDI | 3 | 1,094 | 0.21 (0.06, 0.36) | <0.001 | Ref | 84.4 | <0.01 |
| CES-D | 4 | 2,789 | 0.32 (0.27, 0.36) | <0.001 | 0.04 | 32.6 | 0.22 |
| DASS-21 | 5 | 4,696 | 0.43 (0.38, 0.49) | <0.001 | <0.001 | 69.5 | 0.01 |
| SCL-90 | 4 | 2,480 | 0.43 (0.37, 0.48) | <0.001 | <0.001 | 44.5 | 0.14 |
| SDS | 4 | 2,586 | 0.38 (0.30, 0.45) | <0.001 | <0.01 | 70.6 | 0.02 |
| GHQ-28 | 1 | 494 | 0.29 (0.20, 0.38) | <0.001 | 0.32 | N/A | N/A |
Note: aP value for the within-subgroup effect sizes by Z test; bP value for between-subgroup difference using meta-regression analysis; cP value for the heterogeneity within subgroups by Q test.
#Two studies in which medical and nonmedical students mixed together was excluded.
Abbreviations: BAI, Beck Depression Inventory; CES-D, the Center for Epidemiological Studies Depression Scale; CI, confidence interval; DASS-21, Depression anxiety stress scale-21; GHQ-28, the General Health Questionnaire; MPA, mobile phone addition; MPAI, Mobile Phone Addiction Index; MPATS, Mobile Phone Addiction Tendency Scale for College Students; SAS/SAS-SV, Smartphone Addiction Scale or its Short Version; SCL-90, Symptom checklist 90; SDS, Self-rating Depression Scale; SPAI, the Smartphone Addiction Inventory.
The summary correlation coefficient between MPA and impulsivity was substantially changed when stratified by the students' specialty, sampling strategy, and measurement instrument for MPA (all with P < 0.05). No difference was observed in subgroup analyses by geographic location, sample size or measurement instrument for impulsivity (all with P > 0.05) (Table 4).
Table 4.
Subgroup analyses of the summary correlation between MPA and impulsivity among college students
| Moderators | No. of studies | Sample size | Summary r (95%CI) | P a | P b | Heterogeneity | |
| I2 (%) | P c | ||||||
| Geographic location | |||||||
| China | 6 | 8,691 | 0.38 (0.27, 0.48) | <0.001 | Ref | 95.6 | <0.01 |
| Other countries | 1 | 415 | 0.38 (0.28, 0.47) | <0.001 | 0.99 | N/A | N/A |
| Medical students # | |||||||
| Yes | 2 | 2,066 | 0.21 (0.16, 0.25) | <0.001 | Ref | 0 | 0.48 |
| No | 4 | 5,786 | 0.47 (0.43, 0.50) | <0.001 | <0.001 | 31.3 | 0.22 |
| Random sampling | |||||||
| Yes | 3 | 3,320 | 0.28 (0.13, 0.43) | <0.001 | Ref | 94.7 | <0.01 |
| No | 4 | 5,786 | 0.47 (0.43, 0.50) | <0.001 | <0.01 | 31.3 | 0.22 |
| Sample size | |||||||
| ≥500 | 5 | 8,228 | 0.36 (0.25, 0.48) | <0.001 | Ref | 96.4 | <0.01 |
| <500 | 2 | 878 | 0.42 (0.34, 0.50) | <0.001 | 0.62 | 33.2 | 0.22 |
| MPA measurement instrument | |||||||
| MPAI | 3 | 6,162 | 0.47 (0.44, 0.50) | <0.001 | Ref | 40.5 | 0.19 |
| MPATS | 1 | 909 | 0.22 (0.16, 0.29) | <0.001 | <0.01 | N/A | N/A |
| SPAI/SPAI-BR | 3 | 2,035 | 0.34 (0.17, 0.51) | <0.001 | 0.04 | 92.7 | <0.01 |
| Questionnaire for impulsivity | |||||||
| BIS-11 | 6 | 8,643 | 0.37 (0.26, 0.47) | <0.001 | Ref | 95.6 | <0.01 |
| BIS-15 | 1 | 463 | 0.46 (0.37, 0.55) | <0.001 | 0.51 | N/A | N/A |
Note: aP value for the within-subgroup effect sizes by Z test; bP value for between-subgroup difference using meta-regression analysis; cP value for the heterogeneity within subgroups by Q test.
#One study in which medical and non-medical students mixed together was excluded.
Abbreviations: BIS-11, Barrat Impulsivity Scale 11; BIS-15, the short form of the Barratt Impulsivity Scale; CI, confidence interval; MPA, mobile phone addition; MPAI, Mobile Phone Addiction Index; SPAI, the Smartphone Addiction Inventory; SPAI-BR, Brazilian version of the Smartphone Addiction Inventory; MPATS, Mobile Phone Addiction Tendency Scale for College Students.
For the summary correlation coefficient between MPA and sleep quality, the subgroup analyses by geographic location, students' specialty, sampling strategy, sample size, sex ratio, survey method, and measurement instrument for MPA did not differ between subgroups (all with P ≥ 0.05) (Table 5).
Table 5.
Subgroup analyses of the summary correlation between MPA and sleep quality among college students
| Moderators | No. of studies | Sample size | Summary r (95%CI) | P a | P b | Heterogeneity | |
| I2 (%) | P c | ||||||
| Geographic location | |||||||
| China | 12 | 8,281 | 0.28 (0.22, 0.34) | <0.001 | Ref | 86.4 | <0.01 |
| Other countries | 2 | 1,688 | 0.25 (0.08, 0.43) | <0.001 | 0.78 | 88.1 | <0.01 |
| Medical students # | |||||||
| Yes | 8 | 6,392 | 0.25 (0.21, 0.29) | <0.001 | Ref | 57.4 | 0.02 |
| No | 4 | 1,698 | 0.25 (0.12, 0.37) | <0.001 | 0.94 | 84.2 | <0.01 |
| Random sampling | |||||||
| Yes | 8 | 6,366 | 0.24 (0.19, 0.28) | <0.001 | Ref | 63.1 | <0.01 |
| No | 6 | 3,603 | 0.33 (0.23, 0.44) | <0.001 | 0.05 | 89.5 | <0.01 |
| Sample size | |||||||
| ≥500 | 6 | 6,785 | 0.28 (0.21, 0.34) | <0.001 | Ref | 85.1 | <0.01 |
| <500 | 8 | 3,184 | 0.27 (0.17, 0.37) | <0.001 | 0.97 | 87.6 | <0.01 |
| Sex ratio (M/F) # | |||||||
| ≥0.6 | 5 | 3,696 | 0.32 (0.19, 0.45) | <0.001 | Ref | 93.3 | <0.01 |
| <0.6 | 8 | 5,523 | 0.27 (0.22, 0.31) | <0.001 | 0.97 | 64.2 | <0.01 |
| Survey method # | |||||||
| Paper-and-pencil | 11 | 7,371 | 0.29 (0.22, 0.36) | <0.001 | Ref | 88.2 | <0.01 |
| Electronic | 2 | 2,244 | 0.27 (0.23, 0.32) | <0.001 | 0.75 | 0 | 0.35 |
| MPA measurement instrument | |||||||
| MPAI | 5 | 3,087 | 0.34 (0.21, 0.46) | <0.001 | Ref | 91.7 | <0.01 |
| MPATS | 4 | 3,349 | 0.26 (0.20, 0.32) | <0.001 | 0.25 | 59.2 | 0.06 |
| SAS/SAS-SV | 5 | 3,533 | 0.23 (0.15, 0.31) | <0.001 | 0.11 | 80.3 | <0.01 |
Note: aP value for the within-subgroup effect sizes by Z test; bP value for between-subgroup difference using meta-regression analysis; cP value for the heterogeneity within subgroups by Q test.
#Two studies in which medical and nonmedical students mixed together was excluded; One study with sex ratio unknown was excluded; One study with mixed survey method was excluded.
Abbreviations: CI, confidence interval; MPA, mobile phone addition; MPAI, Mobile Phone Addiction Index; MPATS, Mobile Phone Addiction Tendency Scale for College Students; SAS/SAS-SV, Smartphone Addiction Scale or its Short Version.
Sensitivity analyses
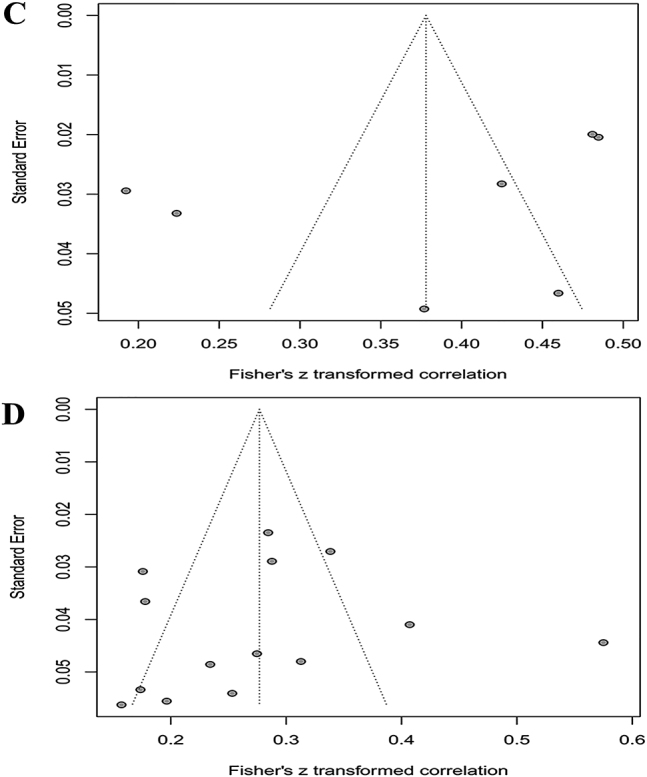
To evaluate the robustness of our findings, sensitivity analyses were performed by sequentially removing one individual study each turn and then recalculating the summary correlation coefficients. Sensitivity analyses for summary correlation coefficients between MPA and anxiety, depression, impulsivity, and sleep quality revealed minor changes, indicating that our results were stable (Appendix D).
Publication bias
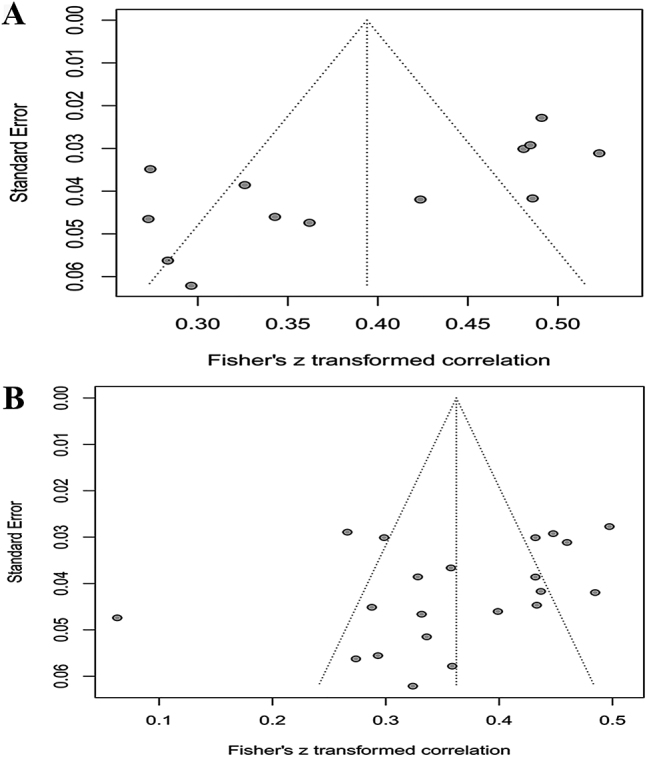
Judging subjectively, it was difficult to determine whether the funnel plots for the summary correlation coefficients between MPA and anxiety, depression, impulsivity, and sleep quality were symmetric or not (Appendix E). Begg's rank correlation tests and Egger's linear regression tests revealed significant publication bias for anxiety, but not for depression, or impulsivity (anxiety: P < 0.01 and 0.04, respectively; depression: P = 0.12 and 0.09, respectively; impulsivity: P = 0.30 and 0.37, respectively; sleep quality: P = 0.75 and 0.23, respectively). Therefore, the trim-and-fill method was employed to adjust for funnel plot asymmetry for the summary correlation coefficients between MPA and anxiety. After trim-and-fill analysis, the correlation between MPA and anxiety remained statistically significant (number to trim and fill = 5, summary r = 0.46, 95% CI = 0.40–0.52, P < 0.001, I2 = 90.7%).
Discussion
To the best of our knowledge, this was the first meta-analysis exploring the pooled correlation coefficients of MPA with anxiety, depression, impulsivity, and sleep quality among college students. Our results indicated that there were weak-to-moderate positive correlations between MPA and the four outcomes mentioned above, with a series of summary Pearson's correlation coefficients of 0.39, 0.36, 0.38 and 0.28, respectively. Sensitivity analyses were robust after the removal of specified studies, which indicated that the pooled analyses of the correlation coefficients were reliable and convincing.
According to cognitive-behavioral theory, individuals' cognitions and emotions could not only affect their behaviors but also be influenced by their own behaviors (L. Chen et al., 2016). Therefore, MPA could also affect one's emotions and cognitions. As shown in the current meta-analysis, a high level of MPA was a positive indicator of anxiety and depression. The effects that MPA has on one's emotions are likely to be mediated by other variables rather than act directly, which is different from that of chemical addiction (L. Chen et al., 2016). Evidence has shown that the association between MPA and negative emotions such as anxiety and depression could be mediated by interpersonal problems (L. Chen et al., 2016). Based on interpersonal theory, individuals with a high level of MPA usually neglect real-world social networking, resulting in frustrated personal companionship and reduced social support resources, thus leading to elevated levels of anxiety and depression (L. Chen et al., 2016). Interestingly, there is also evidence that psychopathology can cause MPA. Mobile phones are frequently used as a coping strategy for individuals with anxiety and depression to relieve themselves from their negative emotions (Firth et al., 2017; Kim, Seo, & David, 2015). In fact, the possibility that psychopathology can cause problematic mobile phone use is in accordance with Billieux et al.'s opinion on the excessive reassurance seeking pathway toward addictive behaviors (Joel Billieux, Maurage, Lopez-Fernandez, Kuss, & Griffiths, 2015). Excessive reassurance seeking is common among individuals with anxiety and depression, which is characterized as repeated, problematic use of phone checking behaviors (Elhai, Dvorak, Levine, & Hall, 2017). Considering the bidirectional causal relationship mentioned above, MPA can involve a vicious cycle with psychopathology. Furthermore, the association between overuse of mobile phones and negative emotions might be partly mediated by sleep quality (Nie & Yang, 2019). The influence of sleep quality on emotions has long been confirmed. It is an important factor that is involved in the biological mechanism of emotion regulation. Those students whose sleep rhythm is disrupted due to MPA are more likely to experience anxious and depressive symptoms (Joël Billieux, 2012).
Consistent with previous literature, impulsivity was positively correlated with MPA. Individuals with a higher level of impulsivity were more likely to have difficulties concentrating because of irrelevant and unwanted thoughts (Joël Billieux, 2012). Since a variety of activities instantly available on mobile phones could relieve their boredom or frustrations resulting from an inability to concentrate while accomplishing tasks, impulsivity has been considered a major MPA-prone personality trait (Roberts, Pullig, & Manolis, 2015). Poor impulse control would result in uncontrollable urges and excessive mobile phone use.
There were also several explanations for the positive correlation between MPA and poor sleep quality (Demirci et al., 2015). First, excessive mobile phone use at bed time might postpone, replace, or disturb sleep processes. Second, overuse of mobile phones usually resulted in a higher level of psychological stress and psychological arousal, which also had a negative impact on sleep and recovery. Third, the blue light emitted from the screens might have an impact on melatonin levels and thus affect sleep and wakefulness. Finally, the electromagnetic fields emitted by mobile phones might account for the poor sleep quality as well. Subgroup analysis showed that the summary correlation coefficients between MPA and anxiety were significantly different when stratified by sample size and survey method. The larger the sample size, the higher the summary correlation coefficient. According to the results of meta-regression, the sample size accounted for 37.2% of the between-study heterogeneity. The MPA-anxiety correlation was stronger among college students who were investigated by electronic questionnaires than among those who were investigated by paper-and-pencil surveys (P = 0.03) (Table 2). We speculated that this might be because an electronic questionnaire survey was generally conducted through network platforms (Elhai et al., 2020), and college students who frequently surfed the Internet or used mobile phones were more likely to be sampled. They were more likely to develop MPA and have a high level of anxiety. Thus, there was a higher correlation coefficient between MPA and anxiety.
There was a significant difference in the summary MPA-depression correlation coefficients between studies from China and other countries (summary r: 0.39 vs. 0.21, P < 0.001) (Table 3). Previous evidence has shown that the diversity of socioenvironmental and cultural factors in different countries might have an impact on the nature of addictive behaviors such as MPA (Long et al., 2016). As a developing country with a large population, China has cultural particularity and special practices, as compared to other countries (Long et al., 2016). In addtion, all the MPA measurement instruments used in non-Chinese studies were the SAS or the SAS-SV (Aker, Sahin, Sezgin, & Oguz, 2017a; Choi et al., 2015; Demirci et al., 2015), while the proportion was two out of nineteen in Chinese studies (B. Chen et al., 2016; Elhai et al., 2020). Subgroup analysis by sample size showed that the summary MPA-depression correlation coefficients were higher in larger sample size studies than in smaller sample size studies (summary r: 0.41 vs. 0.30, P < 0.01) (Table 3). Studies with larger sample sizes were more representative and therefore might result in a more reliable conclusion. Heterogeneity in summary MPA-depression correlation coefficients might also result from differences in depression measurement instruments. The heterogeneity was still high after the conduction of subgroup analyses. To further examine the source of between-study heterogeneity in the summary MPA-depression correlation, the forest and funnel plots were carefully checked and one study by Choi et al. (2015) was identified as an outlier due to its relatively low correlation coefficient. After the exclusion of this study from the pooled analysis, the between-study heterogeneity (I2) decreased from 84.2% to 76.7%, which indicated that the excluded study was a source of heterogeneity.
Interestingly, we found that MPA was more closely related to impulsivity among nonmedical students than that among medical students (summary r = 0.47 and 0.21, respectively) (Table 4). Moreover, the between-study heterogeneity within the two subgroups became statistically insignificant (I2 = 0% and 31.3%, respectively). Therefore, the between-study heterogeneity might originate from students' specialty, which could be partly explained by the difference in the sex ratios between medical and nonmedical students. As revealed in Table 1, the crude pooled sex ratio was 0.82 (930/1,136) for medical students, while it was 1.19 (2,943/2,483) for nonmedical students, with chi-square test P < 0.001. A previous meta-analysis showed that there was indeed a gender difference in impulsivity (Cross, Copping, & Campbell, 2011). Differences in sampling strategy and MPA measurement instruments also had a significant influence on the summary MPA-impulsivity correlation coefficients. We failed to find any significant stratified moderators accounting for the between-study heterogeneity of the summary MPA-sleep quality correlation coefficients.
Strengths and limitations
One strength of this meta-analysis was that all studies were rated as moderate to high quality. Furthermore, the majority of studies (36/40) reported response rates which were higher than 80%. Nevertheless, some limitations of the current meta-analysis should be taken into consideration. First, to minimize the potential source of heterogeneity, MPA measurement instruments were restricted to the MPAI, MPATS, SAS/SAS-SV, and SPAI/SPAI-BR. Similarly, measurement instruments for impulsivity were restricted to the BIS 11/15 and the measurement instrument for sleep quality restricted to the PSQI. As a result, the studies included in the current meta-analysis were limited, especially for MPA-impulsivity correlation. Attention should, therefore, be paid to the interpretation of our findings, as it might have been underpowered. Second, given the limited number of the included studies, subgroup analyses based on some moderators should be interpreted with caution to some extent. Third, there remained substantial heterogeneity in the summary correlation coefficients even after the conduction of subgroup analyses. Other underlying factors such as personality, pre-existing illness, comorbidity, lifestyle, living conditions, and university environment might account for this. Regrettably, since the effect sizes were Pearson's correlation coefficients rather than partial correlation coefficients, the correlations between MPA and the four clinical outcomes were calculated without adjustment for relevant variables. Few studies conducted stratified Pearson's correlation analysis according to these variables. Thus, we were unable to verify our assumption due to the scarcity of such data. Fourth, as a meta-analysis based on cross-sectional studies, the possibilities to draw valid conclusions about causal directions of the correlations were hindered. The found correlations might thus be due to reverse causality. Sometimes the casual relationships may be bidirectional.
Conclusions
Despite the limitations mentioned above, all available evidence supports weak-to-moderate correlations between MPA and anxiety, depression, impulsivity, and sleep quality. Their summary Pearson's correlation coefficients were 0.39, 0.36, 0.38 and 0.28, respectively. This meant that college students with MPA were more likely to develop high levels of anxiety, depression, and impulsivity and suffer from poor sleep quality. More studies, especially large prospective studies with long follow-up periods, are warranted to verify our findings.
Funding sources
The research is not funded by a specific project grant.
Author's contribution
HW conceived of the present idea and design the study. GXL and YL performed the statistical analysis and interpreted the findings. LL verified the analytical methods. All authors discussed the results and took responsibility for the integrity of the data and the accuracy of the data analysis.
Conflict of interest
The authors declared no conflicts of interests.
Appendix A. Systematic literature review search strategy in PubMed database.
#1: cell phone[Title/Abstract]
#2: cell phones[Title/Abstract]
#3: cellular phone[Title/Abstract]
#4: cellular phones[Title/Abstract]
#5: cellular telephone[Title/Abstract]
#6: cellular telephones[Title/Abstract]
#7: mobile devices[Title/Abstract]
#8: mobile phone[Title/Abstract]
#9: smart phone[Title/Abstract]
#10: smartphone[Title/Abstract]
#11: addiction[Title/Abstract]
#12: dependence[Title/Abstract]
#13: dependency[Title/Abstract]
#14: abuse[Title/Abstract]
#15: addicted to[Title/Abstract]
#16: overuse[Title/Abstract]
#17: problem use[Title/Abstract]
#18: compensatory use[Title/Abstract]
#19: problematic smartphone use[Title/Abstract]
#20: problematic smart phone use[Title/Abstract]
#21: problematic mobile phone use[Title/Abstract]
#22: problematic cell phone use[Title/Abstract]
#23: problematic cellular phone use[Title/Abstract]
#24: Nomophobia[Title/Abstract]
#25: smartphone zombies[Title/Abstract]
#26: Phubbing[Title/Abstract]
#27: fear of missing out[Title/Abstract]
#28: FoMO[Title/Abstract]
#29: smartphone separation anxiety[Title/Abstract]
#30: smartphone use disorder[Title/Abstract]
#31: compulsive mobile phone use[Title/Abstract]
#32: fear of being without a mobile phone[Title/Abstract]
#33: fear of being without a smartphone[Title/Abstract]
#34: college students[Title/Abstract]
#35: university students[Title/Abstract]
#36: undergraduate students[Title/Abstract]
#37: #1 or #2 or #3 or #4 or #5 or #6 or #7 or #8 or #9 or #10
#38: #11 or #12 or #13 or #14 or #15 or #16 or #17 or #18
#39: #19 or #20 or #21 or #22 or #23
#40: #24 or #25 or #26 or #27 or #28 or #29 or #30 or #31 or #32 or #33
#41: #34 or #35 or #36
#42: #37 and #38 and #41
#43: #39 and #41
#44: #40 and #41
#45: #42 or #43 or #44
Appendix B. JBI critical appraisal checklist for studies reporting prevalence data.
| Items | Yes | No | Unclear | Not applicable |
| 1. Was the sample frame appropriate to address the target population? | ||||
| 2. Were study participants sampled in an appropriate way? | ||||
| 3. Was the sample size adequate? | ||||
| 4. Were the study subjects and the setting described in detail? | ||||
| 5. Was the data analysis conducted with sufficient coverage of the identified sample? | ||||
| 6. Were valid methods used for the identification of the condition? | ||||
| 7. Was the condition measured in a standard, reliable way for all participants? | ||||
| 8. Was there appropriate statistical analysis? | ||||
| 9. Was the response rate adequate, and if not, was the low response rate managed appropriately? |
Quality assessment adapted from: Munn Z, Moola S, Lisy K, Riitano D, Tufanaru C. Methodological guidance for systematic reviews of observational epidemiological studies reporting prevalence and incidence data. Int J Evid Based Healthc. 2015;13(3):147–153.
Appendix C. Quality assessment for the 40 studies in the current meta-analysis.
| Study | Quality Item | |||||||||
| Item1 | Item2 | Item3 | Item4 | Item5 | Item6 | Item7 | Item8 | Item9 | Total | |
| Chen JJ, 2020, China | Y | N | Y | Y | Y | Y | Y | Y | Y | 8 |
| Cheng L, 2020, China | Y | N | Y | Y | Y | N | U | Y | Y | 6 |
| Elhai JD, 2020, China | Y | Y | Y | Y | Y | Y | Y | Y | Y | 9 |
| Gundogmus I, 2020, Turkey | Y | N | Y | Y | Y | N | Y | Y | Y | 7 |
| Li SB, 2020, China | Y | N | Y | Y | Y | Y | N | Y | Y | 7 |
| Zhang MX, 2020, China | Y | N | Y | Y | Y | Y | Y | Y | Y | 8 |
| Zhang YC, 2020, China | Y | Y | Y | Y | Y | Y | Y | Y | N | 8 |
| Chen CY, 2019, China | Y | N | Y | N | Y | Y | Y | Y | Y | 7 |
| Huang MM, 2019, China | Y | Y | Y | Y | Y | Y | Y | Y | Y | 9 |
| Jiang XJ, 2019, China | Y | Y | Y | Y | Y | N | Y | Y | Y | 8 |
| Khoury JM, 2019, Brazil | Y | N | Y | Y | Y | Y | Y | Y | N | 7 |
| Luo XS, 2019, China | Y | Y | Y | Y | Y | N | Y | Y | Y | 8 |
| Nie GH, 2019, China | Y | Y | Y | Y | Y | Y | N | Y | Y | 8 |
| Song LP, 2019, China | Y | Y | Y | Y | Y | Y | Y | Y | Y | 9 |
| Zhou L, 2019, China | Y | N | Y | N | Y | Y | Y | Y | Y | 7 |
| Zhu Q, 2019, China | Y | Y | Y | Y | Y | Y | Y | Y | Y | 9 |
| Chen XH, 2018, China | Y | Y | Y | N | Y | Y | N | Y | Y | 7 |
| Dong DD, 2018, China | Y | Y | Y | Y | Y | N | Y | Y | Y | 8 |
| Li H, 2018, China | Y | Y | Y | Y | Y | Y | Y | Y | Y | 9 |
| Li M, 2018, China | Y | Y | Y | N | Y | N | Y | Y | Y | 7 |
| Liu ZQ, 2018, China | Y | Y | Y | Y | Y | Y | Y | Y | Y | 9 |
| Niu LY, 2018, China | Y | N | Y | Y | Y | Y | Y | Y | Y | 8 |
| Wang HY, 2018, China | Y | U | Y | N | Y | Y | Y | Y | Y | 7 |
| Yan MZ, 2018, China | Y | Y | Y | Y | Y | Y | Y | Y | Y | 9 |
| Zhang Y, 2018, China | Y | N | Y | N | Y | Y | Y | Y | Y | 7 |
| Zhou FR, 2018, China | Y | Y | Y | Y | Y | Y | Y | Y | Y | 9 |
| Aker S, 2017, Turkey | Y | U | Y | Y | Y | N | Y | Y | N | 6 |
| Chen L, 2017, China | Y | Y | Y | Y | Y | Y | Y | Y | Y | 9 |
| Liu TT, 2017, China | Y | Y | Y | Y | Y | N | Y | Y | Y | 8 |
| Mei SL, 2017, China | Y | N | Y | N | Y | Y | N | Y | Y | 6 |
| Qing ZH, 2017, China | Y | Y | Y | N | Y | Y | Y | Y | Y | 8 |
| Zhan HD, 2017, China | Y | Y | Y | N | Y | Y | Y | Y | Y | 8 |
| Chen BF, 2016, China | Y | Y | Y | Y | Y | Y | Y | Y | Y | 9 |
| Li L, 2016, China | Y | Y | Y | Y | Y | N | Y | Y | Y | 8 |
| Li JM, 2016, China | Y | N | Y | Y | Y | Y | N | Y | Y | 7 |
| Shi GR, 2016, China | Y | Y | Y | Y | Y | Y | Y | Y | Y | 9 |
| Choi SW, 2015, Korea | Y | U | Y | Y | Y | N | Y | Y | Y | 7 |
| Demirci K, 2015, Turkey | Y | Y | Y | Y | Y | N | Y | Y | Y | 8 |
| Huang H, 2015, China | Y | N | Y | N | Y | N | Y | Y | Y | 6 |
| Huang H, 2014, China | Y | N | Y | N | Y | Y | Y | Y | Y | 7 |
Abbreviations: Y, yes; N, No; U, unclear.
Appendix D. Sensitivity analyses by removing one study each turn.Sensitivity analyses for the correlation between mobile phone addition (MPA) and (A) anxiety, (B) depression, (C) impulsivity, and (D) sleep quality.


Appendix E. Funnel plots to assess publication bias.Funnel plots with pseudo 95% confidence limits used to assess publication bias for correlation between MPA and (A) anxiety, (B) depression, (C) impulsivity, and (D) sleep quality.
Contributor Information
Ying Li, Email: liy@cmu.edu.cn.
Guangxiao Li, Email: liguangxiao1007@sina.com.
Li Liu, Email: lliu09@cmu.edu.cn.
Hui Wu, Email: hwu@cmu.edu.cn.
References
- Aker, S., Sahin, M. K., Sezgin, S., & Oguz, G. (2017a). Psychosocial factors affecting smartphone addiction in university students. Journal of Addictions Nursing, 28(4), 215–219. 10.1097/jan.0000000000000197. [DOI] [PubMed] [Google Scholar]
- Aker, S., Sahin, M. K., Sezgin, S., & Oguz, G. (2017b). Psychosocial factors affecting smartphone addiction in university students. Perspect Psychiatr Care, 28(4), 215–219. 10.1097/jan.0000000000000197. [DOI] [PubMed] [Google Scholar]
- American Psychiatric Association . (2013). Diagnostic and statistical manual of mental disorders (DSM-5®): American Psychiatric Pub. [Google Scholar]
- BankMyCell. (2020). How many smartphones are in the world? Source: https://www.bankmycell.com/blog/how-many-phones-are-in-the-world. Accessed on March 6th, 2020.
- Billieux, J. (2012). Problematic use of the mobile phone: A literature review and a pathways model. Current Psychiatry Reviews, 8(4), 299–307. 10.2174/157340012803520522. [DOI] [Google Scholar]
- Billieux, J., Maurage, P., Lopez-Fernandez, O., Kuss, D., & Griffiths, M. (2015). Can disordered mobile phone use be considered a behavioral addiction? An update on current evidence and a comprehensive model for future research. Current Addiction Reports, 2, 156–162. 10.1007/s40429-015-0054-y. [DOI] [Google Scholar]
- Buysse, D. J., Reynolds, C. F., 3rd, Monk, T. H., Berman, S. R., & Kupfer, D. J. (1989). The Pittsburgh sleep quality index: A new instrument for psychiatric practice and research. Psychiatry Research, 28(2), 193–213. 10.1016/0165-1781(89)90047-4. [DOI] [PubMed] [Google Scholar]
- Chen, X. (2018). Correlation study between mobile phone dependence syndrome and sleep quality and personality traits among college nursing students (in Chinese). Chinese Nursing Research, 32(21), 3440–3443. [Google Scholar]
- Chen, J., Li, H., Yang, Y., Wang, Q., & Hong, L. (2020). Mediation effect of psychological resilience in the relationship between mobile phone addiction and mental health in college students (in Chinese). Modern Preventive Medicine, 47(01), 93–96. [Google Scholar]
- Chen, C., Liang, S., Yang, C., & Zhou, Z. (2019). Effect of mobile phone addiction on college students' depression: Mediation and moderation analyses (in Chinese). Chinese Journal of Clinical Psychology, 27(04), 746–749+745. 10.16128/j.cnki.1005-3611.2019.04.021. [DOI] [Google Scholar]
- Chen, L., Yan, Z., Tang, W., Yang, F., Xie, X., & He, J. (2016a). Mobile phone addiction levels and negative emotions among Chinese young adults: The mediating role of interpersonal problems. Computers in Human Behavior, 55, 856–866. 10.1016/j.chb.2015.10.030. [DOI] [Google Scholar]
- Chen, B., Ying, X., Fang, L., Li, F., & Yue, N. (2016b). Relationship between smartphone addiction, sleep and depression in college students from a medical school (in Chinese). Journal of Chifeng University (Natural Science Edition), 32(06), 191–193. 10.3969/j.issn.1673-260X.2016.06.074. [DOI] [Google Scholar]
- Chen, L., & Zeng, M. (2017). Relationship between mobile phone addiction and mental health among college students from frontier ethnic regions (in Chinese). Journal of Chuxiong Normal University, 32(01), 108–112. 10.3969/j.issn.1671-7406.2017.01.021. [DOI] [Google Scholar]
- Cheng, L., Zhang, H., Chen, Y., & Pang, X. (2020). Relationship of mobile phone dependence, resilience and sleep quality among private college students (in Chinese). Occupation and Health, 36(10), 1407–1410. [Google Scholar]
- Choi, S. W., Kim, D. J., Choi, J. S., Ahn, H., Choi, E. J., Song, W. Y., et al. (2015). Comparison of risk and protective factors associated with smartphone addiction and Internet addiction. Journal of Behavioral Addictions, 4(4), 308–314. 10.1556/2006.4.2015.01010.1556/2006.4.2015.043. [DOI] [PMC free article] [PubMed] [Google Scholar]
- Cross, C. P., Copping, L. T., & Campbell, A. (2011). Sex differences in impulsivity: A meta-analysis. Psychological Bulletin, 137(1), 97–130. 10.1037/a0021591. [DOI] [PubMed] [Google Scholar]
- Demirci, K., Akgonul, M., & Akpinar, A. (2015). Relationship of smartphone use severity with sleep quality, depression, and anxiety in university students. Journal of Behavioral Addictions, 4(2), 85–92. 10.1556/2006.4.2015.010. [DOI] [PMC free article] [PubMed] [Google Scholar]
- Dong, D. (2018). Research on the correlation between mobile phone dependence and mental health of college students in the information age (in Chinese). Journal of Tonghua Normal University, 39(08), 80–84. 10.13877/j.cnki.cn22-1284.2018.08.019. [DOI] [Google Scholar]
- Elhai, J. D., Dvorak, R. D., Levine, J. C., & Hall, B. J. (2017). Problematic smartphone use: A conceptual overview and systematic review of relations with anxiety and depression psychopathology. Journal of Affective Disorders., 207, 251–259. 10.1016/j.jad.2016.08.030. [DOI] [PubMed] [Google Scholar]
- Elhai, J. D., Yang, H., Fang, J., Bai, X., & Hall, B. J. (2020). Depression and anxiety symptoms are related to problematic smartphone use severity in Chinese young adults: Fear of missing out as a mediator. Addictive Behaviors, 101, 105962. 10.1016/j.addbeh.2019.04.020. [DOI] [PubMed] [Google Scholar]
- Firth, J., Torous, J., Nicholas, J., Carney, R., Rosenbaum, S., & Sarris, J. (2017). Can smartphone mental health interventions reduce symptoms of anxiety? A meta-analysis of randomized controlled trials. Journal of Affective Disorders, 15–22. [DOI] [PubMed] [Google Scholar]
- Grant, J.E., Lust, K., & Chamberlain, S.R. (2019). Problematic smartphone use associated with greater alcohol consumption, mental health issues, poorer academic performance, and impulsivity. Journal of Behavioral Addictions, 8(2), 335–342. 10.1556/2006.8.2019.32. [DOI] [PMC free article] [PubMed] [Google Scholar]
- Gundogmus, I., Taşdelen Kul, A, & Çoban, D. (2020). Investigation of the relationship between social network usage and sleep quality among university students. Anatolian Journal of Psychiatry, 21(2), 141–148. 10.5455/apd.55929. [DOI] [Google Scholar]
- Huang, M., Han, W., & Chen, L. (2019). Relationship between mobile phone addiction tendency and depression in college students: The mediating of ruminative responses (in Chinese). Journalof Neijiang Normal University, 34(12), 8–12. 10.13603/j.cnki.51-1621/z.2019.12.002. [DOI] [Google Scholar]
- Huang, H., Hou, J., Yu, L., & Zhou, C. (2014). A comparative analysis on mental health of college students with internet addiction and mobile phone addiction (in Chinese). Chinese Journal of School Health, 35(11), 1654–1656, 1659. 10.16835/j.cnki.1000-9817.2014.11.020. [DOI] [Google Scholar]
- Huang, H., Li, C., Gui, Y., Zhou, C., Wu, H., & zhang, J. (2015). Undergraduates' impulsivity and mobile phone addiction: A mediating role of alienation (in Chinese). Chinese Journal of Clinical Psychology, 23(4), 674–677. 10.16128/j.cnki.1005-3611.2015.04.024. [DOI] [Google Scholar]
- Jiang, X., He, B., & Wang, J. (2019). Association between smartphone addiction and sleep quality and mediating role of generalized anxiety among students in a medical college of Nanjing City (in Chinese). Occupation and Health, 35(13), 1851–1853. 10.13329/j.cnki.zyyjk.2019.0484. [DOI] [Google Scholar]
- Khoury, J. M. (2019). Smartphone and Facebook addictions share common risk and prognostic factors in a sample of undergraduate students. International Journal of Environmental Research and Public Health, 41(4), 358–368. 10.1590/2237-6089-2018-0069. [DOI] [PubMed] [Google Scholar]
- Khoury, J. M., de Freitas, A. A. C., Roque, M. A. V., Albuquerque, M. R., das Neves, M. C. L., & Garcia, F. D. (2017). Assessment of the accuracy of a new tool for the screening of smartphone addiction. PloS One, 12(5), e0176924. 10.1371/journal.pone.0176924. [DOI] [PMC free article] [PubMed] [Google Scholar]
- Kim, J.-H., Seo, M., & David, P. (2015). Alleviating depression only to become problematic mobile phone users: Can face-to-face communication be the antidote? Computers in Human Behavior, 51. 10.1016/j.chb.2015.05.030. [DOI] [Google Scholar]
- Kwon, M., Kim, D. J., Cho, H., & Yang, S. (2013). The smartphone addiction scale: Development and validation of a short version for adolescents. PloS One, 8(12), e83558. 10.1371/journal.pone.0083558. [DOI] [PMC free article] [PubMed] [Google Scholar]
- Kwon, M., Lee, J. Y., Won, W. Y., Park, J. W., Min, J. A., Hahn, C., et al. (2013). Development and validation of a smartphone addiction scale (SAS). PLoS One, 8(2), e56936. 10.1371/journal.pone.0056936. [DOI] [PMC free article] [PubMed] [Google Scholar]
- Leung, L. (2008). Linking psychological attributes to addiction and improper use of the mobile phone among adolescents in Hong Kong. Journal of Children and Media, 2(2), 93–113. 10.1080/17482790802078565. [DOI] [Google Scholar]
- Li, J. (2016). Effect of mobile phone use on college students' physical and mental health (in Chinese). (Master), Jinlin University, Available from Cnki. [Google Scholar]
- Li, M. (2018). A study on the relationship among college students' social support, mobile phone dependence and sleep quality (in Chinese). Think Tank Era, 44, 163–164. [Google Scholar]
- Li, H., Li, Y., & Zhang, Y. (2018). Mediating effect of anxiety on relationship between mobile phone addiction and locus of control in college students (in Chinese). Chinese Journal of Behavioral Medicine and Brain Science, 27(7), 650–654. 10.3760/cma.j.issn.1674-6554.2018.07.014. [DOI] [Google Scholar]
- Li, L., Mei, S., & Niu, Z. (2016). Influences of smartphone addiction and negative affect on sleep quality among university students (in Chinese). Chinese Journal of Public Health, 32(5), 646–649. 10.16128/j.cnki.1005-3611.2016.02.036. [DOI] [Google Scholar]
- Li, S., Peng, X., & Ni, P. (2020). Effects of mobile phone addiction, anxiety and depression on the sleep quality among junior college students (in Chinese). Journal of Shenyang Medical College, 22(01), 54–58. [Google Scholar]
- Li, L., Xu, D. D., Chai, J. X., Wang, D., Li, L., Zhang, L., et al. (2018). Prevalence of internet addiction disorder in Chinese university students: A comprehensive meta-analysis of observational studies. Journal of Behavioral Addictions, 7(3), 610–623. 10.1556/2006.7.2018.53. [DOI] [PMC free article] [PubMed] [Google Scholar]
- Lin, Y. H., Chang, L. R., Lee, Y. H., Tseng, H. W., Kuo, T. B., & Chen, S. H. (2014). Development and validation of the smartphone addiction inventory (SPAI). PLoS One, 9(6), e98312. 10.1371/journal.pone.0098312. [DOI] [PMC free article] [PubMed] [Google Scholar]
- Liu, T., Zhou, L., Tang, X., & Wang, S. (2017). Investigation of the relationship between mobile addiction and sleep and academic achievement in medical college students (in Chinese). Chinese Journal of Drug Dependence, 26(01), 33–37. [Google Scholar]
- Liu, Z., & Zhu, L. (2018). The relationship between mobile phone addiction and anxiety of college students: The mediating effect of sleep quality (in Chinese). Chinese Journal of Health Education, 34(6), 541–544. 10.16168/j.cnki.issn.1002-9982.2018.06.014. [DOI] [Google Scholar]
- Long, J., Liu, T. Q., Liao, Y. H., Qi, C., He, H. Y., Chen, S. B., et al. (2016). Prevalence and correlates of problematic smartphone use in a large random sample of Chinese undergraduates BMC Psychiatry, 16(1), 408. 10.1186/s12888-016-1083-3. [DOI] [PMC free article] [PubMed] [Google Scholar]
- Luo, X., Xiong, S., Zhang, B., & Mao, X. (2019). Relationship between mobile phoene addiction and depression: A mediating roles of loneliness (in Chinese). China Journal of Health Pyschology, 27(6), 915–918. 10.13342/j.cnki.cjhp.2019.06.031. [DOI] [Google Scholar]
- Mei, S., Chai, J., Li, J., & Wang, L. (2017). Research on the relationship between impulsivity, self-regulation and mobile phone dependence: Mediation effect of mobile phone usage (in Chinese). Studies of Psychology and Behavior, 15(01), 136–143. [Google Scholar]
- Moher, D., Liberati, A., Tetzlaff, J., Altman, D. G., & The PRISMA Group. (2009). Preferred reporting items for systematic reviews and meta-analyses: The PRISMA statement. PLoS Medicine, 6(7), e1000097. 10.1371/journal.pmed.1000097. [DOI] [PMC free article] [PubMed] [Google Scholar]
- Munn, Z., Moola, S., Lisy, K., Riitano, D., & Tufanaru, C. (2015). Methodological guidance for systematic reviews of observational epidemiological studies reporting prevalence and cumulative incidence data. International Journal of Evidence-Based Healthcare, 13(3), 147–153. 10.1097/xeb.0000000000000054. [DOI] [PubMed] [Google Scholar]
- Nie, G., & Yang, X. (2019). Relationship between mobile phone addiction and sleep quality, depression among students in a medical college in Guangxi (in Chinese). Modern Preventive Medicine, 46(14), 2591–2593+2611. [Google Scholar]
- Niu, L., Huang, H., & Guo, L. (2018). The impact of college students' subjective well-being and impulsivity on mobile phone dependence and their interaction (in Chinese). Chinese Journal of School Health, 39(8), 1259. 10.16835/j.cnki.1000-9817.2018.08.043. [DOI] [Google Scholar]
- Patton, J. H., Stanford, M. S., & Barratt, E. S. (1995). Factor structure of the Barratt impulsiveness scale. Journal of Clinical Psychology, 51(6), 768–774. . [DOI] [PubMed] [Google Scholar]
- Qing, Z., Cao, J., & Wu, C. (2017). Research on the relationship between mobile phone dependence and mental health of college students (in Chinese). Journal of Mudanjiang Normal University(Social Sciences), 24(3), 136–139. 10.3969/j.issn.1003-6121.2017.03.023. [DOI] [Google Scholar]
- Roberts, J., Pullig, C., & Manolis, C. (2015). I need my smartphone: A hierarchical model of personality and cell-phone addiction. Personality and Individual Differences, 79. 10.1016/j.paid.2015.01.049. [DOI] [Google Scholar]
- Shi, G., Jin, S., Xv, X., & Li, H. (2016). Correlation between mobile phone dependence, impulsive behavior and procrastination in college students (in Chinese). China Journal of Health Psychology 24(6), 916–919. 10.13342/j.cnki.cjhp.2016.06.032. [DOI] [Google Scholar]
- Song, L., Xie, F., & Li, L. (2019). Cognitive orientation and family environment on smartphone addiction among undergraduate nursing students (in Chinese). Chinese Journal of Modern Nursing, 25(16), 2093–2097. [Google Scholar]
- Spinella, M. (2007). Normative data and a short form of the Barratt impulsiveness scale. International Journal of Neuroscience, 117(3), 359–368. 10.1080/00207450600588881. [DOI] [PubMed] [Google Scholar]
- Tao, J., Luo, C., Huang, J., & Liang, L. (2018). Meta-analysis of the current situation of mobile phone dependence among college students in China (in Chinese). Chinese Journal of School Health, 39(9), 1391–1394. 10.16835/j.cnki.1000-9817.2018.09.032. [DOI] [Google Scholar]
- Thomee, S. (2018). Mobile phone use and mental health. A review of the research that takes a psychological perspective on exposure. International Journal of Environmental Research and Public Health, 15(12), 2692. 10.3390/ijerph15122692. [DOI] [PMC free article] [PubMed] [Google Scholar]
- Wang, H. Y., Sigerson, L., Jiang, H., & Cheng, C. (2018). Psychometric properties and factor structures of Chinese smartphone addiction inventory: Test of two models Frontiers in Psychology, 9, 1411. 10.3389/fpsyg.2018.01411. [DOI] [PMC free article] [PubMed] [Google Scholar]
- Xiong, J., Zhou, Z., Chen, W., You, Z., & Zhai, Z. (2012). Development of the mobile phone addiction tendency scale for college students (in Chinese). Chinese Mental Health Journal, 26(3), 222–225. 10.3969/j.issn.1000-6729.2012.03.013. [DOI] [Google Scholar]
- Yan, M., Tong, B., Guo, S., Yan, B., & Guo, L. (2018). Relationship between smartphone addiction behavior and sleep quality among medical students (in Chinese). Chinese Rural Health Service Administration, 38(08), 1066–1069. [Google Scholar]
- Zhan, H. (2017). A study on mobile phone dependence of an independent college students and its relationship with academic and mental health (in Chinese). Lingnan Academic Research, 12(4), 72–76. [Google Scholar]
- Zhang, Y., Long, G., Ding, B., Sun, G., Ouyang, W., & Liu, M., et al. (2020). The impact of ambient temperature on the incidence of urolithiasis: A systematic review and meta-analysis. Scandinavian Journal of Work, Environment & Health, 46(2), 117–126. 10.5271/sjweh.3866. [DOI] [PubMed] [Google Scholar]
- Zhang, Y., Lv, S., Li, C., Xiong, Y., Zhou, C., Li, X., et al. (2020). Smartphone use disorder and future time perspective of college students: The mediating role of depression and moderating role of mindfulness. Child and Adolescent Psychiatry and Mental Health, 14, 3. 10.1186/s13034-020-0309-9. [DOI] [PMC free article] [PubMed] [Google Scholar]
- Zhang, M. X., & Wu, A. M. S. (2020). Effects of smartphone addiction on sleep quality among Chinese university students: The mediating role of self-regulation and bedtime procrastination. Addictive Behaviors, 111, 106552. 10.1016/j.addbeh.2020.106552. [DOI] [PubMed] [Google Scholar]
- Zhang, Y., Zhang, D., Xiong, L., & Gu, C. (2018). Effects of mobile phone addiction on depression and anxiety: Mediation and moderation analyses (in Chinese). Chinese Journal of Clinical Psychology 26(6), 1086–1090. 10.16128/j.cnki.1005-3611.2018.06.008. [DOI] [Google Scholar]
- Zhou, F. (2018). The relationship among depression, loneliness and mobile phone dependence in college students: The mediating role of mobile phone usage types (in Chinese). (Master), Jinlin University. Available from: Cnki. [Google Scholar]
- Zhou, L., Jin, J., & Wang, C. (2019). Study on the relationship between sleep quality and mobile phone dependence among college students (in Chinese). Psychological Monthly, 14(18), 25–27. 10.19738/j.cnki.psy.2019.18.013. [DOI] [Google Scholar]
- Zhu, Q., Tian, D., Zhi, Y., & Zhang, Y. (2019). The effect of impulsiveness on college students' smartphone addiction: The intermediary role of sleep status (in Chinese). Journal of Zunyi Medical University, 42(04), 459–463. 10.14169/j.cnki.zunyixuebao.2019.0093. [DOI] [Google Scholar]