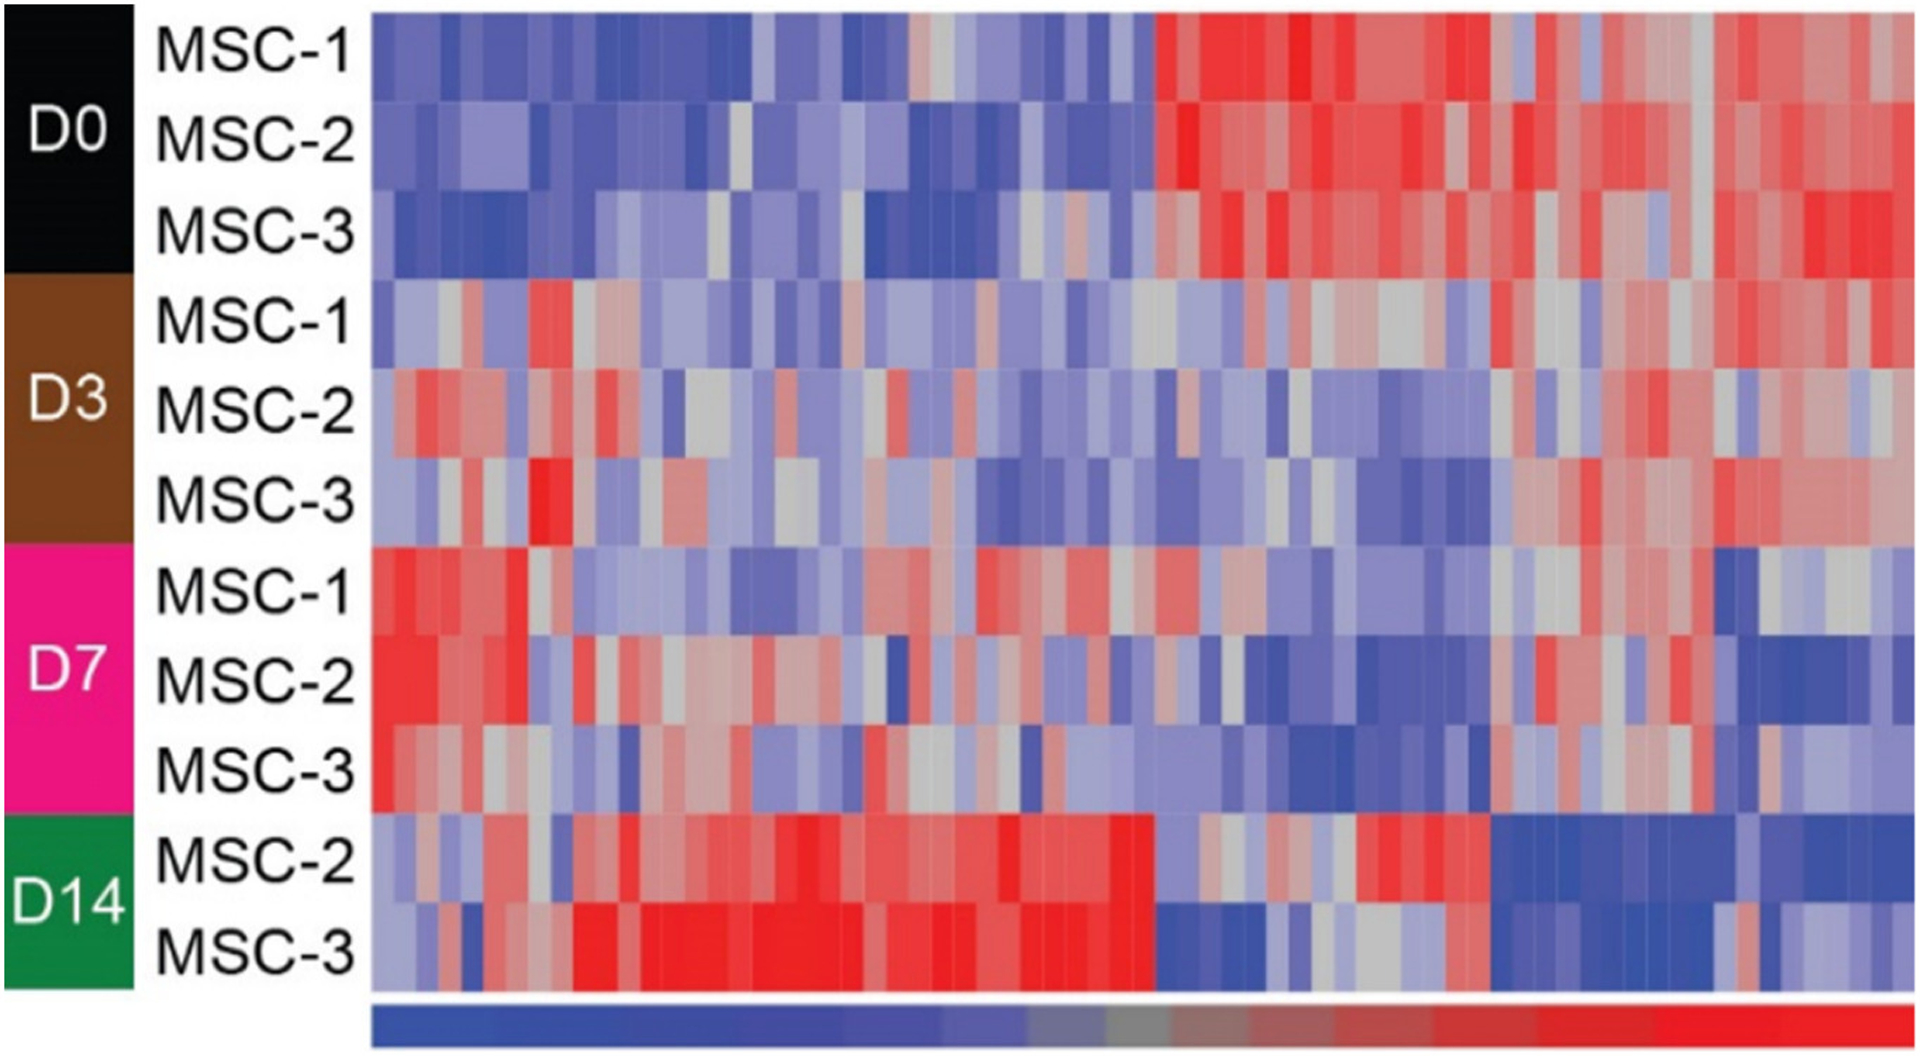
Fig. 5.

Heat map of differentially-expressed miRNAs from whole cell extracts following comparisons between day 0 and days 3, 7 or 14. Significant differential expression was set at fold change absolute ≥ 1.5 and adjusted p value <0.05. miRNAs were clustered in an unsupervised manner with Euclidean distance and Ward method. Signal values in the heat map were z-score normalized with a mean of 0 and a standard deviation of 1 across the miRNAs. Red color denotes higher signal and blue color represents lower signal. Note there are two samples for MSC day 14 since one was an outlier. Also note that there are more differentially expressed miRNAs identified at day 14 compared to day 0.
