Abstract
Using both group (nomothetic) and individual (idiographic) approaches to measuring clinical change may provide more information about the effectiveness of an intervention than either approach alone. The current study re-examined previously published data from two randomized clinical trials of omega-3 fatty acids and Individual-Family Psychoeducational Psychotherapy as treatment for mood disorders in youth, using modified Brinley plots, a method of illustrating individuals’ treatment response in the context of group information. Although the original nomothetic approach provided information about the average effect of treatment, modified Brinley plots gave more information about individual children’s outcomes. Practicing clinicians in particular could use modified Brinley plots to track treatment trajectories and outcomes for specific clients and subsequently use these data to inform treatment planning.
Keywords: children and adolescents, modified Brinley plots, mood disorders, reliable change index, treatment outcomes
1 |. INTRODUCTION
When selecting a clinical intervention to use with a particular client, the most important criterion is the intervention’s established record of producing clinically significant change (CSC) for the type of individual receiving the treatment. Randomized controlled trials (RCTs) use random assignment and masking procedures to ensure that any therapeutic effect or change is the result of the experimental intervention rather than systematic differences in participant characteristics between groups or investigator confirmation biases (see Kaptchuk, 2001), and are considered the gold-standard method to evaluate both effectiveness and change. Typically, the control group’s mean pre- and postintervention scores are compared to analogous scores from the experimental group, and a significantly greater magnitude of response in the experimental group (p < 0.05) is interpreted as showing that the intervention was more effective and produced greater change than the placebo treatment or control condition.
Nomothetic approaches, such as RCTs, seek to generate universal laws that will stand up to variations in time, space, and individuals (Lamiell, 1998). Null hypothesis statistical testing (NHST; Rucci & Tweney, 1980), as used in RCTs, is such an approach. When NHST is used to evaluate a treatment, a statistically significant result indicates that the experimental treatment is superior to placebo for the average participant in that particular clinical trial. However, an average participant may not actually exist; the group mean may be an average of a bimodal or some other non-normal response distribution (Grice, 2015). This is a notable limitation of RCTs, because as Bergin and Strupp (1972) argued, the key clinical issue is to match specific clients to specific treatments, rather than the average client to the average treatment. Although many researchers now systematically assess interindividual moderators of change in response to treatment (e.g., sex, race/ethnicity, age), these analyses are also conducted using mean symptom score values as outcomes (Baron & Kenny, 1986). Recently, RCT analyses have more often utilized sophisticated analytic approaches, including multilevel modeling (MLM), which allow for investigation of both within- and between-subject effects and thus combine idiographic and nomothetic approaches (Cerin, 2004; Fayad et al., 2016; Kahn & Schneider, 2013), albeit without a graphical depiction of one’s data. Single-case designs are also gaining popularity (Cohen, Feinstein, Masuda, & Vowles, 2013), although they require strictly controlled assessment and intervention procedures that may not be applicable to typical clinical practice.
Thus, nomothetic approaches continue to be the primary method by which to assess new interventions. Although superior to clinical intuition, they have some notable limitations. Specifically, nomothetic approaches may obscure vastly different clinical responses across participants in the same group (Busch, Wagener, Gregor, Ring, & Borrelli, 2011; Jacobson & Truax, 1991). For example, if many individuals in the experimental group improve, some stay the same, and a few see a sharp decline in functioning, a nomothetic approach would suggest that the average response to treatment was positive, while concealing the reality of deterioration for some (Jacobson & Truax, 1991; Kravitz, Duan, & Braslow, 2004). Furthermore, traditional NHST, with its almost exclusive reliance on p-values as the basis for inference, is strongly dependent on sample size and homogeneity (Micceri, 1989). Finally, nomothetic approaches may be problematic for practicing clinicians, who are working with individual patients, since practical applications of treatment are always to the single case (Allport, 1942). Effect sizes, or the standardized mean difference between treatment and control conditions, have been highlighted as a useful way to further evaluate the quality of a treatment without excessive reliance on p-values (Sullivan & Feinn, 2012), although this approach typically still takes a group rather than individual-level approach. Though effect sizes are also available for idiographic measures, they do not necessarily address the clinical significance of the individual’s change.
To address these issues, some researchers have advocated for a more idiographic approach to assessing change (Barlow & Nock, 2009), with the individual rather than the group as the unit of measure. One example of an idiographic approach to assessing clinical outcomes is a modified Brinley plot (Blampied, 2017). Traditional Brinley plots (Brinley, 1965) have been used to graphically depict group differences based on specific participant characteristics (e.g., age; see Temprado et al., 2013), or to present meta-analytic data (e.g., Bopp & Verhaeghen 2005; Peiffer, Maldjian, & Laurienti, 2008). Relatedly, modified Brinley plots provide a graphical depiction of individual change in a context that allows for visual comparison between different treatment conditions, thus fulfilling the Task Force on Statistical Inferences’ injunction to first “look at your data” before doing any kind of statistical analysis (Wilkinson & Task Force on Statistical Inference, 1999). They also permit the viewer to observe both individual variation in treatment response and clinically significant improvement or deterioration (Blampied, 2017).
Determination of CSC, as defined by Jacobson and Truax (1991), requires that two criteria are met: First, an individual’s post-treatment symptom scores must be improved (either lower or higher based on the measure in question) compared to their pretreatment scores; furthermore, the magnitude of this improvement must pass the threshold of reliable change (RC). Second, the post-treatment score must exceed agreed-upon standards for improvement, as defined by the measure in question. This two-tiered approach assures that both statistical and clinical improvement be considered when defining CSC.
Assessing the first criterion requires the calculation of reliable change index (RCI; Jacobson & Truax, 1991; Wise, 2004), against which a difference score (post-treatment–pretreatment value) is compared. Ideally, an RCI should be calculated for each dependent variable, based on published psychometric properties for the given measure. The classic approach to calculating RCI (Jacobson & Truax, 1991) classifies participants’ pre- to post-treatment change scores as either RC+ (difference score > RCI, with the post-treatment score indicating an improvement over the pretreatment score, thus reliable improvement), RC0 (within the RCI boundaries, thus not significantly larger than measurement error), or RC- (difference score > RCI, with the post-treatment score indicating a decline compared to the pretreatment score, thus reliable deterioration).
Blampied (2017) provides detailed instructions for the creation and interpretation of modified Brinley plots (see Figure 1 as an example). Individuals’ X-Y score pairs are plotted, where the x-axis represents prestudy scores and the y-axis represents poststudy scores. If there is no pre-to-post change, an individual’s data point will lie on the 450° diagonal line. Dotted lines parallel to 450° indicate the upper and lower limits of the RCI; if improvement is indicated by a lower score, RC+ scores appear below the lower dotted line and RC-scores will appear above the upper dotted line (and vice versa for measures where higher scores indicate improvement). Finally, RC+% can be calculated as an effect size indicating the percentage of participants who demonstrated clinically significant change during the course of the trial.
FIGURE 1.
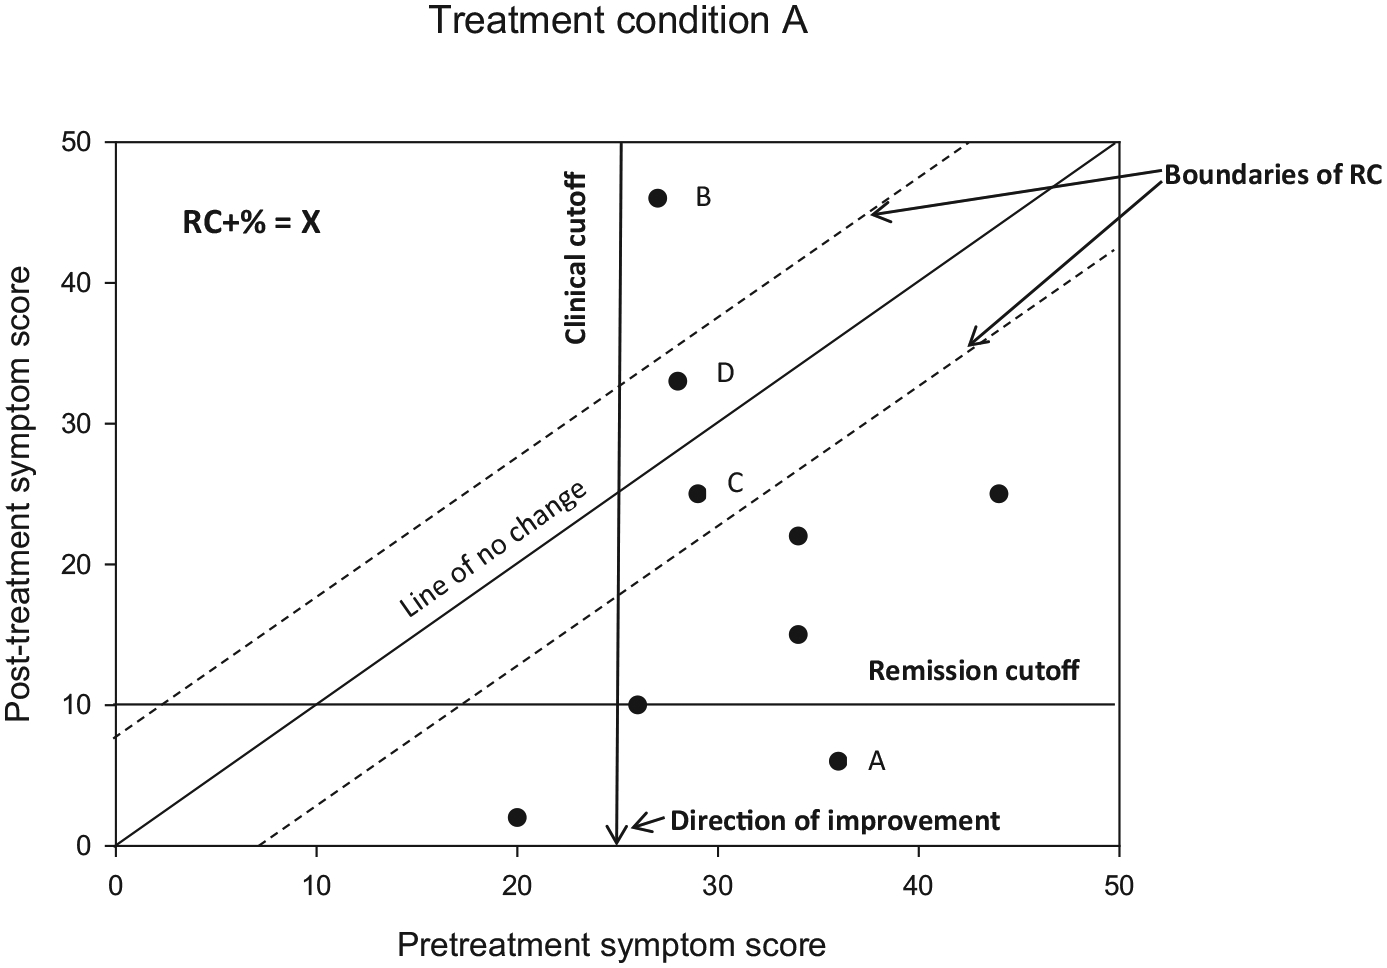
Example of a modified Brinley plot depicting clinical change over time
If reliable change is indicated in the first step, then published clinical cutoffs can be used to assess the second criterion for CSC. An individual’s post-treatment score may be reliably changed from their initial assessment, but may still be considered to be in the “clinical” range. A clinician working with this individual may wish to continue treatment, but utilize the same approach as there has been evidence of reliable change but not CSC. In contrast, an individual’s reliable improvement may move them into a “remission” classification if their scores have improved such that they are no longer considered to be experiencing significant clinical dysfunction (determined by a predefined cutoff score). This individual’s clinician may elect to discontinue therapy in light of a successful course of treatment, as there is evidence of both reliable and clinical change which together constitute CSC. Finally, reliable deterioration and moving to or remaining in a “clinical” range of illness would indicate clinically significant deterioration, under which circumstances a clinician may wish to continue treatment but choose a new modality or approach that may be better suited to the specific individual.
Figure 1 depicts several possible scenarios—point “A” represents an individual who had a clinically significant symptom score at study entry, and then moved into remission status by study end. Point “B,” in contrast, represents reliable deterioration, as this individual’s initial symptom score was in the clinical range, and then increased and remained well above the boundary signifying remission status following treatment. Points “C” and “D” represent individuals who demonstrated modest improvement and decline, respectively, in their symptom scores, but not more than would be expected by chance, as they are within the dotted lines demarcating reliable change.
Modified Brinley plots, while useful for presenting data from large treatment studies, also may provide practicing clinicians with a meaningful and relatively simple method by which to track session-by-session clinical change. Such monitoring informs effective clinical practice and decision-making, especially decisions around treatment modification or discontinuation. Furthermore, recent changes to insurance guidelines as a result of the Affordable Care Act (ACA) provide additional reimbursement to clinicians for ongoing patient-reported outcomes; this change will likely result in more consistent collection of session-by-session data by practicing clinicians. Modified Brinley plots provide a method by which to present these ongoing assessment measures in an intuitive and clinically useful format.
Previous studies have used modified Brinley plots alone (Stunkard & Penick, 1979) or in conjunction with traditional nomothetic approaches (Sobell, Sobell, & Gavin, 1995). Furthermore, previous work has highlighted the importance of combining these approaches in research settings (e.g., Evans, Margison, & Barkham, 1998; Ogles, Lambert, & Sawyer, 1995; Ogles, Lambert, & Fields, 2002; Sobell et al., 1995; Wilson, Becker, & Tinker, 1997). Despite their clinical utility, however, modified Brinley plots are not regularly utilized in reporting clinical outcome research. Ideally, combining idiographic and nomothetic approaches to clinical change would offer both general and specific guidelines for when and how to apply particular treatments. Furthermore, modified Brinley plots provide a direct visual representation of study outcomes, which are easier to apprehend than the examination of tables or text reporting data. The first aim of the current study was to apply modified Brinley plots (an approach that combines idiographic and nomothetic features in one display) to previously published findings using traditional NHST (a nomothetic approach) to assess outcome data from two clinical trials of psychotherapy and omega-3fatty acids for children and adolescents with mood disorders (Fristad et al., 2016, 2015), as a way to demonstrate the utility of modified Brinley plots in research settings. The second aim was to provide guidance on how to utilize modified Brinley plots in clinical practice.
2 |. METHOD
2.1 |. Participants
Participants were recruited between July 2011 and May 2014, from community advertisements and clinician referrals in the Midwestern United States, to participate in one of two parallel RCTs for 7- to 14-year-old youth with mood disorders. Participants in the first trial (n = 72; Fristad et al., 2016) were diagnosed with major depressive disorder (MDD), dysthymic disorder (DD), or depressive disorder not otherwise specified (D-NOS) using DSM-IV-TR criteria and were approximately 11.6 years old (SD = 2.1), 57% male, 57% Caucasian, and 10% Hispanic/Latino. Participants in the second trial (n = 23; Fristad et al., 2015) were diagnosed with either cyclothymic disorder (CYC) or bipolar disorder not otherwise specified (BP-NOS) using DSM-IV-TR criteria; these participants were approximately 10.3 years old (SD = 2.2), 57% male, 74% Caucasian, and 0% Hispanic/Latino. Inclusion criteria for participation in either trial included age 7–14 years old, one caregiver willing to complete the assessments and follow-up procedures, diagnosis of DSM-IV-TR MDD, DD, or D-NOS (depression trial) or CYC or BP-NOS (BP-NOS/CYC trial), and clinically significant symptom severity as demonstrated by scores on the Children’s Depression Rating Scale-Revised (CDRS-R; Poznanski et al., 1984; depression trial) or Young Mania Rating Scale (YMRS; Young, Biggs, Ziegler, & Meyer, 1978; BP-NOS/CYC trial). Exclusion criteria for participation in either trial included inability to swallow omega-3 capsules, major medical disorder, DSM-IV-TR diagnosis of autistic disorder, intellectual disability (IQ < 70), recent introduction of a mental health intervention, medication for the mood disorder, severe mood symptoms (as indicated by 3 or more symptoms rated at a “severe” or “marked” level on the Kiddie Schedule for Affective Disorders-Present and Lifetime version [K-SADS-PL; Kaufman et al., 1997]), or presence of active suicidal ideation or psychosis warranting immediate further treatment. All research was undertaken with the full understanding of study participants and their parents. Accordingly, parents provided written informed consent and youth provided written assent to all study procedures as required by local Institutional Review Board (IRB) guidelines.
2.2 |. Treatments
2.2.1 |. IF-PEP
Individual-Family Psychoeducational Psychotherapy (IF-PEP; Fristad, Goldberg-Arnold, & Leffler, 2011) is a manualized therapy that incorporates psychoeducation, family systems concepts, and cognitive behavioral therapy (CBT) techniques to address mood disturbances. Youth and at least one parent participated in separate weekly sessions focusing on symptom identification, emotion regulation, and skills building techniques.
2.2.2 |. Ω3
Participants received either omega-3 (Ω3) or matching placebo pills at each assessment following randomization. Both Ω3 and PBO were manufactured by OmegaBrite Corporation (www.omegabrite.com; Las Vegas, NV). Ω3 pills contained 350 mg EPA; 50 mg DHA; 65 mg other Ω3, and participants in either Ω3 condition were instructed to take two tablets twice per day; PBO pills were matched for appearance and odor to ensure effective masking. Additionally, all participants were provided with a daily multivitamin supplement in order to standardize micronutrition.
2.3 |. Measures
2.3.1 |. CDRS-R
Depressive symptomatology was measured using the CDRS-R, a 17-item scale designed to measure symptoms of depression in youth ages 6–17 years old. Items are scored on a Likert scale from 1 to 7 (or 1 to 5 on some items), with higher scores indicating greater severity. Total scores range from 17 to 113, scores ≥40 indicate clinically significant depression, and scores <28 indicate remission. Inter-rater reliability (IRR; r = 0.86) and test–retest reliability over a 4-week period (r = 0.81) are excellent (Poznanski et al., 1984), as was the study IRR (ICC = 0.87). The CDRS-R provides “unfiltered” ratings, meaning that mood symptoms were captured regardless of whether they occurred during a mood episode (see Yee et al., 2014, for a thorough discussion of “filtered” vs. “unfiltered” ratings). The CDRS-R was completed at each study assessment. See Table 1 for RCIs and relevant psychometric data.
TABLE 1.
Standardized and calculated data for outcome measures of interest
| Measure | Citation(s)a | Cronbach’s alpha | Standard deviation | SEM | SEDiff | RCI |
|---|---|---|---|---|---|---|
| CDRS-R | Emslie et al. (2008), Mayes, Bernstein, Haley, Kennard, & Emslie (2010) | 0.79 | 7.30 | 3.35 | 4.73 | 9.27 |
| CGAS | Bird, Canino, Rubio-Stipec, & Ribera (1987) | 0.91 | 12.90 | 3.87 | 5.47 | 10.73 |
| YMRS | Gracious, Youngstrom, Findling, & Calabrese (2002) | 0.73 | 7.19 | 3.74 | 5.28 | 10.36 |
Note. CDRS-R: Children’s Depression Rating Scale-Revised; CGAS: Children’s Global Assessment Scale; YMRS: Young Mania Rating Scale; SEM: standard error of measurement; SEDiff: standard error of the difference score; RCI: reliable change index.
Multiple published reports were utilized to calculate RCI values for the CDRS-R. Specifically, the standard deviation of the assessment is derived from a larger sample of similar aged participants to the current sample (Emslie et al., 2008); while alpha was not available for the full sample, it was available from 12 to 16 year olds in the same sample (Mayes et al., 2010).
2.3.2 |. YMRS
Manic symptoms were measured using the YMRS, an 11-item scale designed for use in adults and children. Items are scored on a Likert scale from 0 to 8 (or 0 to 4 on some items) with higher scores indicating greater severity. Total scores range from 0 to 56, with a score of ≥20 indicating current mania and scores <8 indicating remission. Internal consistency (α = 0.91; Youngstrom, Danielson, Findling, Gracious, & Calabrese, 2002) and IRR (Gracious, Holmes, Ruppar, Burke, & Hurt, 1994) are strong. The YMRS, like the CDRS-R, provides “unfiltered” symptom ratings and was administered at each study assessment. See Table 1 for RCIs and relevant psychometric data.
2.3.3 |. Children’s Global Assessment Scale
The Children’s Global Assessment Scale (CGAS) (Shaffer et al., 1983) is an adaptation of the Global Assessment Scale (GAS; Endicott, Spitzer, Fleiss, & Cohen, 1976) which is designed to measure global functioning in youth. Scores range from 1 to 100, with lower scores indicating impairment and scores of ≥70 indicating normal functioning. The CGAS has demonstrated strong IRR and test–retest reliability in previous investigations (Dyrborg et al., 2000; Shaffer et al., 1983). See Table 1 for RCIs and relevant psychometric data.
2.3.4 |. K-SADS-PL
Mood disorder diagnoses were made using the Depression and Mania Rating Scales (KDRS and KMRS) of the K-SADS-PL (Kaufman et al., 1997). In the current sample, IRR for both the KDRS and the KMRS was excellent (ICC = 0.89 and 0.82, respectively). The KDRS and KMRS were administered at each study assessment.
2.3.5 |. Maternal depression
At screen, parents provided information regarding biological mothers’ depressive symptoms via the Family History Screen (FHS). The FHS is a semistructured interview with sound validity and reliability (Weissman et al., 2000). Mothers were identified as having a history of depression if there was evidence of depressed mood or prolonged lack of energy and one or more additional depressive symptoms lasting ≥2 weeks.
2.3.6 |. Psychosocial stress
Items from the Psychosocial Stressors section of the Children’s Interview for Psychiatric Syndromes Child and Parent Versions (ChIPS/P-ChIPS; Weller, Fristad, et al., 1999; Weller, Weller, et al., 1999) were summed to result in a possible score from 0 to 8. Stressors included family illness, financial concerns, domestic conflicts, divorce/marital separation, substance use in the home, police involvement, and bereavement due to murder or bereavement due to accidental death/illness. Stress was considered continuously in the original nomothetic analyses; in the current idiographic analyses, stress scores were dichotomized such that scores from 0 to 3 were considered “low” stress, while scores from 4 to 7 were classified as “high” stress (as the mean stress level in the overall sample was 2.56 events [SD = 1.57]).
2.4 |. Procedure
Following confirmation of eligibility and the baseline assessment, participants were randomized to one of four treatment conditions: 1. IF-PEP + Ω3; 2. IF-PEP + placebo pill (PBO); 3. Active clinical monitoring (AM) + Ω3; or 4. AM + PBO. (See Figures 2 and 3 for CONSORT diagrams depicting recruitment and allocation of participants into treatment conditions in the depression and BP-NOS/CYC trials.) Participants in all treatment conditions were assessed five more times during the trial, at 2, 4, 6, 9, and 12 weeks following baseline. Study assessments were conducted by postdoctoral fellows or graduate students in child clinical psychology, supervised by the co-investigators (LEA and MAF). Participants in either IF-PEP condition also attended two therapy sessions per week for the duration of the 12-week trial; these sessions were conducted by postdoctoral fellows supervised by the co-investigator (MAF). Participants and all study staff who had contact with participants were masked to Ω3/PBO assignment, and interviewers conducting study assessments were masked to IF-PEP/AM assignment, as well.
FIGURE 2.
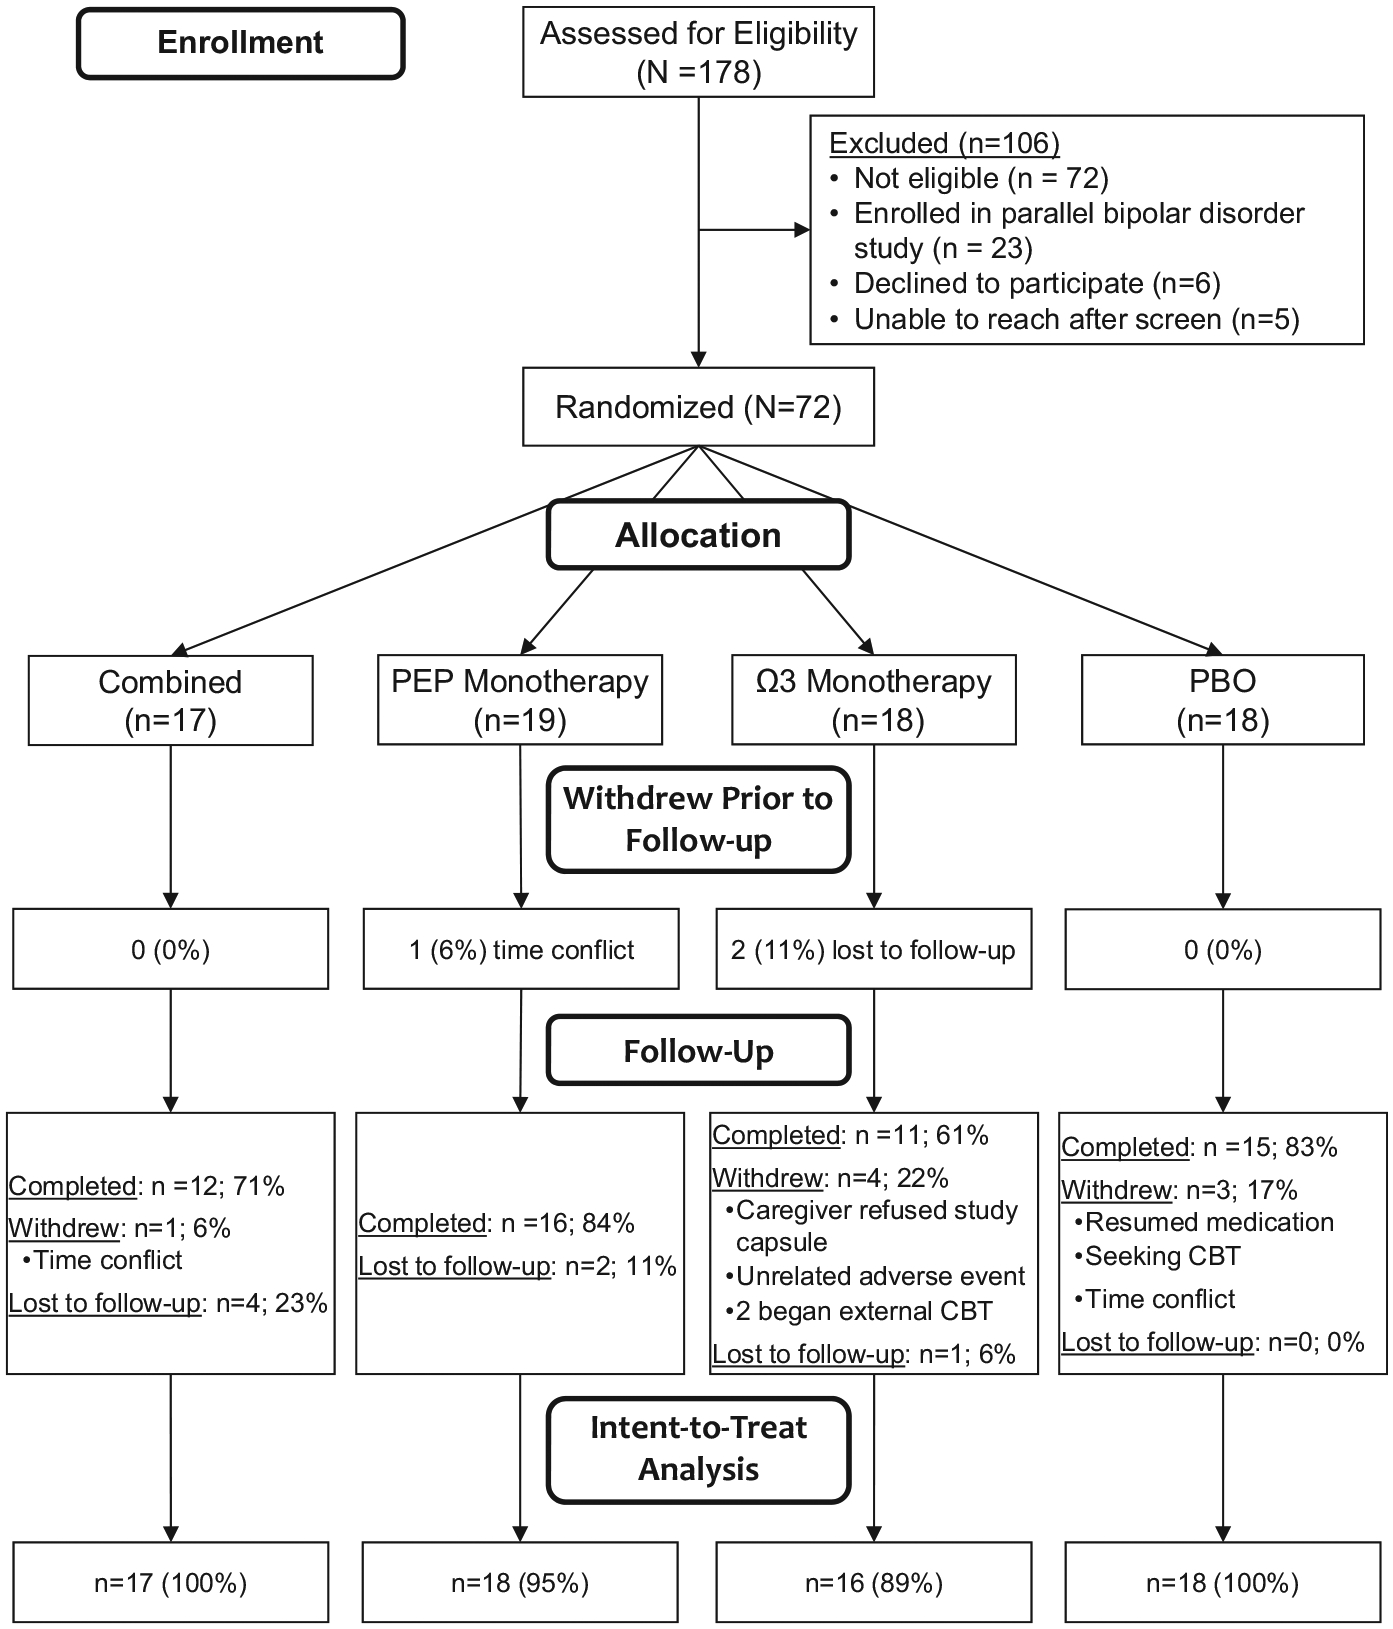
CONSORT diagram for trial 1
FIGURE 3.
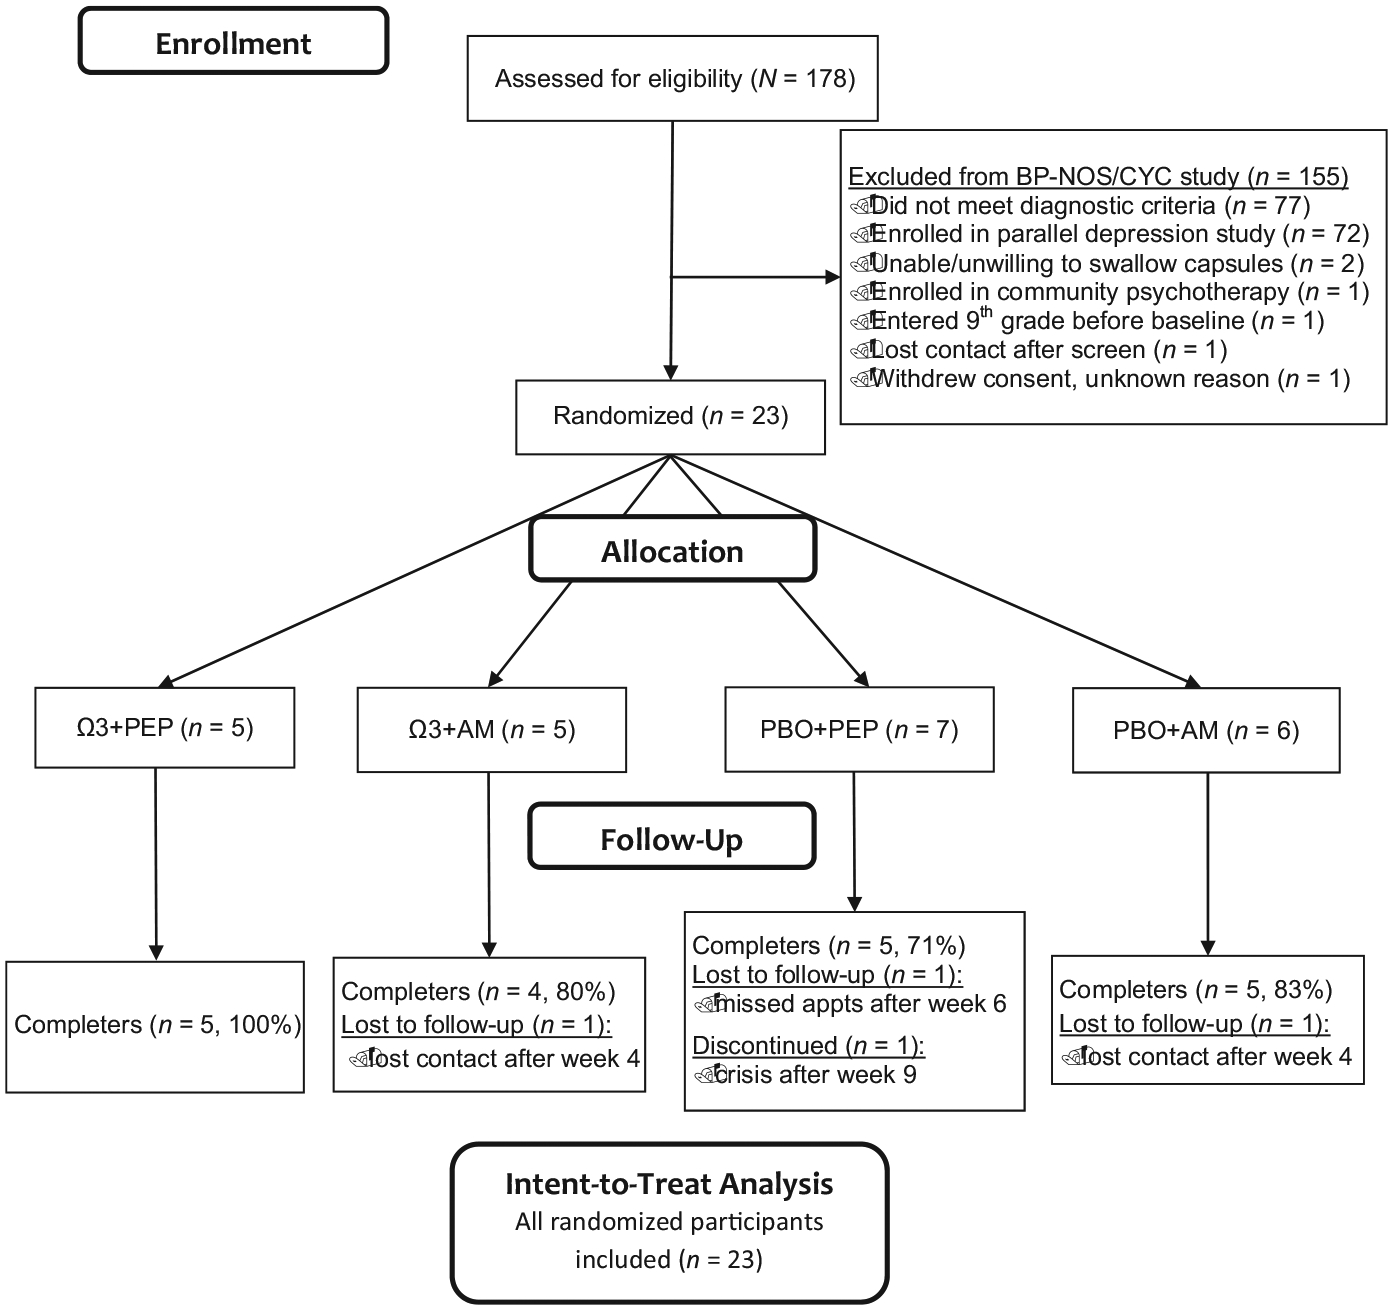
CONSORT diagram for trial 2
2.5 |. Data analyses
A nomothetic approach to measuring change in these data has been presented previously (Fristad et al., 2016, 2015). Briefly, linear mixed effects (LME) models were used to model depression and mania symptom severity using either the CDRS-R (depression and BP-NOS/CYC trials) or YMRS (BP-NOS/CYC trial only) scores, in intent-to-treat (ITT) analyses. Cohen’s ds effect sizes were also calculated for each treatment group relative to placebo (Feingold, 2009) using the subscript conventions of Lakens (2013).
To demonstrate the idiographic approach, modified Brinley plots were used in subsequent analyses. Following the classic Jacobson and Truax (1991) approach, the standard error of measurement (SEM) was first calculated using:
(where s = the standard deviation of the representative sample for a particular measure, and rxx = the reliability/consistency of the measure) and the standard error of the difference score (SEDiff) derived as:
Finally, RCI is calculated:
RCI(0.05) represents the minimum change score between pre-and postassessment sufficient to reject the null hypothesis that the change is due only to measurement error p < 0.05. Any observed individual change must exceed the RCI for it to be judged statistically significant (Jacobson & Truax, 1991), where clinically significant change also required a shift across a clinical cutoff boundary. Clinically significant boundary lines (e.g., minimum score for clinical and/or remission status) may also be added to modified Brinley plots. Psychometric data, SEM, SEDiff, and RCI values for the current study’s measures can be found in Table 1.
Prestudy scores in the current analysis were those collected at the baseline assessment (immediately prior to study randomization), while poststudy scores were either from the final study visit or the last postbaseline observation carried forward (LOCF). In order to match the analyses conducted in the original outcome papers, participants from the depression and BP-NOS/CYC trials were graphed separately. Additionally, YMRS scores were only considered for the BP-NOS/CYC group, as significant change in manic symptoms would not be expected in the depression group. Finally, although not included in the original analyses, CGAS scores are presented using the idiographic approach for participants in both trials. SigmaPlot version 13.0 was used to create all modified Brinley plots.
3 |. RESULTS
Results from the original treatment trials are first summarized, and results from analyses utilizing modified Brinley plots are presented in the following paragraphs.
3.1 |. Nomothetic approach
As previously reported by Fristad et al. (2016), 69 of 72 participants from the depression trial had sufficient follow-up data to be included in LME analyses. These analyses indicated that while average CDRS-R scores decreased significantly over time for all treatment groups, no statistically significant group differences could be detected (Table 2). Compared to placebo alone, a small-medium effect (ds = 0.42) was detected for the Ω3 +AM group (Cohen, 1992), and a small effect was detected for Ω3 + IF-PEP (ds = 0.29). Moderator analyses indicated that, on average, children whose mothers had current or past depression and children who were experiencing lower levels of psychosocial stress had significant responses (p = 0.02–0.04) to the active treatment.
TABLE 2.
Summary of nomothetic results from depression trial
| Outcome variable | Parameter | Estimate | p-value | d s |
|---|---|---|---|---|
| CDRS-R | Treatment group (reference: PBO + AM) × Time | |||
| Combined × Time | −0.25 | 0.344 | 0.29 | |
| PEP + PBO × Time | 0.04 | 0.880 | <0.10 | |
| Ω3 + AM × Time | −0.38 | 0.175 | 0.42 | |
| Presence of maternal depression | ||||
| Treatment Group × Time × Maternal depression | ||||
| Combined × Time × Maternal depression | −0.41 | 0.444 | <0.10 | |
| PEP Monotherapy × Time × Maternal depression | −1.17 | 0.020 | 0.84 | |
| Ω3 Monotherapy × Time × Maternal depression | −0.60 | 0.273 | <0.10 | |
| Psychosocial stressors | ||||
| Treatment Group × Time × Stressors | ||||
| Combined × Time × Stressors | 0.48 | 0.035 | 1.07 | |
| PEP Monotherapy × Time × Stressors | 0.41 | 0.028 | 0.73 | |
| Ω3 Monotherapy × Time × Stressors | 0.52 | 0.040 | 1.38 |
Note. CDRS-R: Children’s Depression Rating Scale-Revised; PBO: placebo; AM: active monitoring; IF-PEP: Individual-Family Psychoeducational Psychotherapy; Ω3: omega-3.
In the BP-NOS/CYC trial, all 23 randomized participants had sufficient follow-up data to be included in LME analyses (Fristad et al., 2015). As in the depression trial, mean CDRS-R scores declined significantly for all treatment groups, but no statistically significant group differences could be detected (Table 3). A large effect size (ds = 0.81), however, was detected for the Ω3 + IF-PEP group compared to the placebo alone. With regard to manic symptoms, mean YMRS scores declined in all groups, but differences between groups were not statistically significant (Table 3). When compared to placebo alone, the Ω3 monotherapy group demonstrated a large effect size, however (ds = 0.86). (See Fristad et al., 2015; Fristad et al., 2016 for further information about therapist fidelity, PEP attendance, and Ω3/PBO pill adherence in both trials).
TABLE 3.
Summary of nomothetic results from BP-NOS/CYC trial
| Outcome variable | Parameter | Estimate | p-value | d s |
|---|---|---|---|---|
| CDRS-R | Treatment Group (reference: PBO + AM) × Time | |||
| Combined × Time | −0.51 | 0.197 | 0.81 | |
| Ω3 + AM × Time | 0.19 | 0.639 | <0.10 | |
| PEP + PBO × Time | −0.12 | 0.758 | <0.10 | |
| YMRS | Treatment Group (reference: PBO + AM) × Time | |||
| Combined × Time | 0.12 | 0.768 | <0.10 | |
| Ω3 + AM × Time | −0.45 | 0.310 | 0.86 | |
| PEP + PBO × Time | 0.03 | 0.942 | <0.10 | |
Note. BP-NOS/CYC: Bipolar Disorder Not Otherwise Specified/Cyclothymic Disorder; CDRS-R: Children’s Depression Rating Scale-Revised; PBO: placebo; AM: active monitoring; Ω3: omega-3; IF-PEP: Individual-Family Psychoeducational Psychotherapy; YMRS: Young Mania Rating Scale.
Overall, the nomothetic analyses suggest that participants in the Ω3 monotherapy and combined therapy groups demonstrated the greatest overall reductions in symptoms, and that individual factors such as stress exposure and history of maternal depression influenced treatment response.
3.2 |. Idiographic approach
Modified Brinley plots for each treatment group, graphing pre- and post-treatment CDRS-R scores for participants in the depression trial, are shown in Figure 4. Notably, the plots demonstrate a similar pattern of change as was reported in the nomothetic analyses, showing that the majority of participants improved their CDRS-R scores. Closer examination of the plot reveals that 10/18 (56%) participants in the placebo group, 10/18 (56%) in the IF-PEP + PBO group, 11/16 (69%) in the Ω3 + AM group, and 12/17 (71%) in the combined treatment group demonstrated reliable change (as indicated by RCI ≥ 9). Furthermore, 6/18 (33%) of the placebo group, 4/18 (22%) in the IF-PEP + PBO group, 3/16 (19%) in the Ω3 + AM group, and 5/17 (29%) of the combined treatment group also crossed the boundary from clinical depression to remission status, indicating clinically significant change. Notably, although a few participants had higher CDRS-R scores at endpoint than baseline (suggesting an increase in depression), no participants in the depression trial demonstrated reliable deterioration (i.e., a worsening of scores greater than that likely due to measurement error alone).
FIGURE 4.
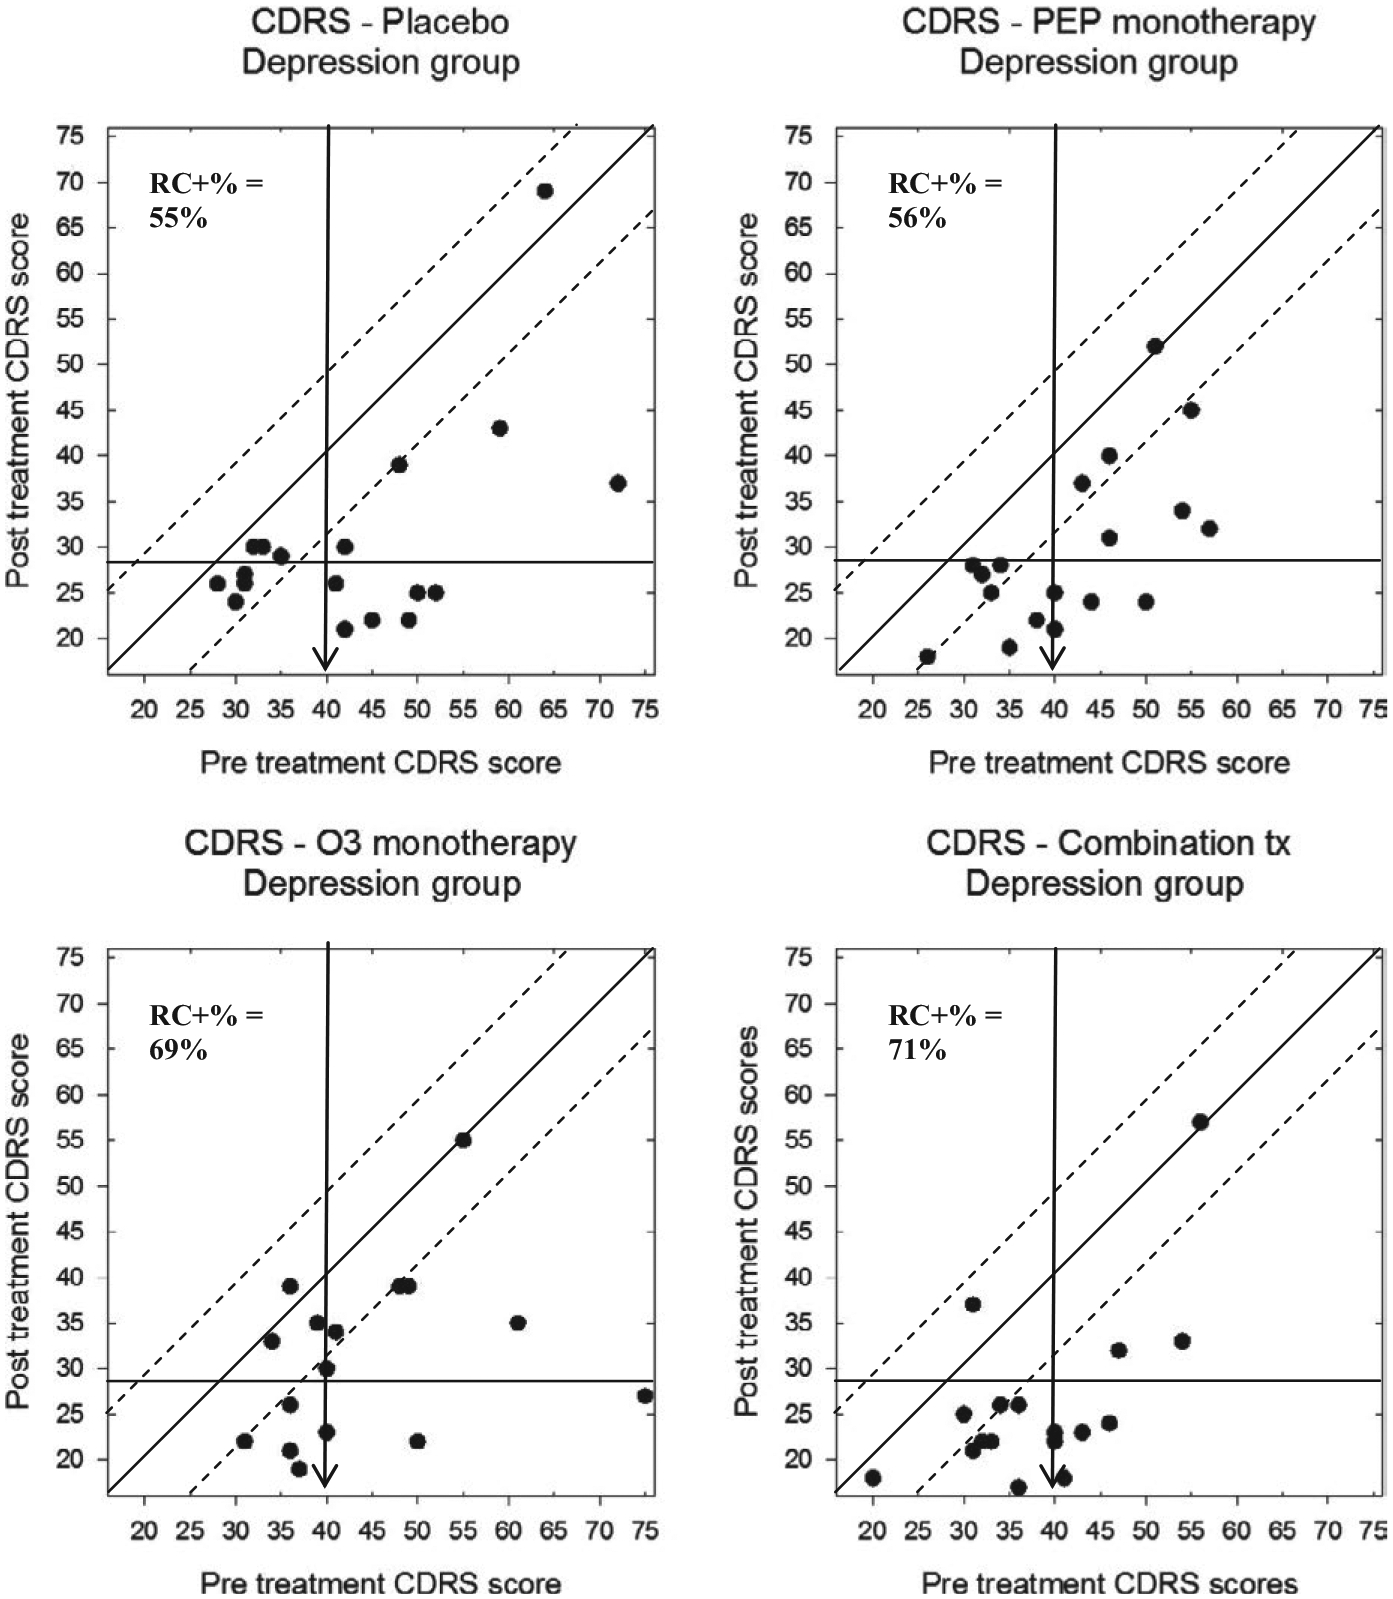
Modified Brinley plots depicting clinical change in CDRS-R scores across treatment conditions in the depression trial
To investigate moderator analyses, a second set of plots shows CDRS-R scores for participants in the depression trial, separately for both treatment group and presence versus absence of maternal depression (Figure 5) or high versus low stress (Figure 6). Participants in the depression trial whose biological mother also had a history of depression demonstrated less reliable change than those without a depressed mother, with the exception of the PEP monotherapy treatment group. Relatedly, depression trial participants with low levels of stress responded better to any of the active treatments, but not as robustly to the PBO condition.
FIGURE 5.
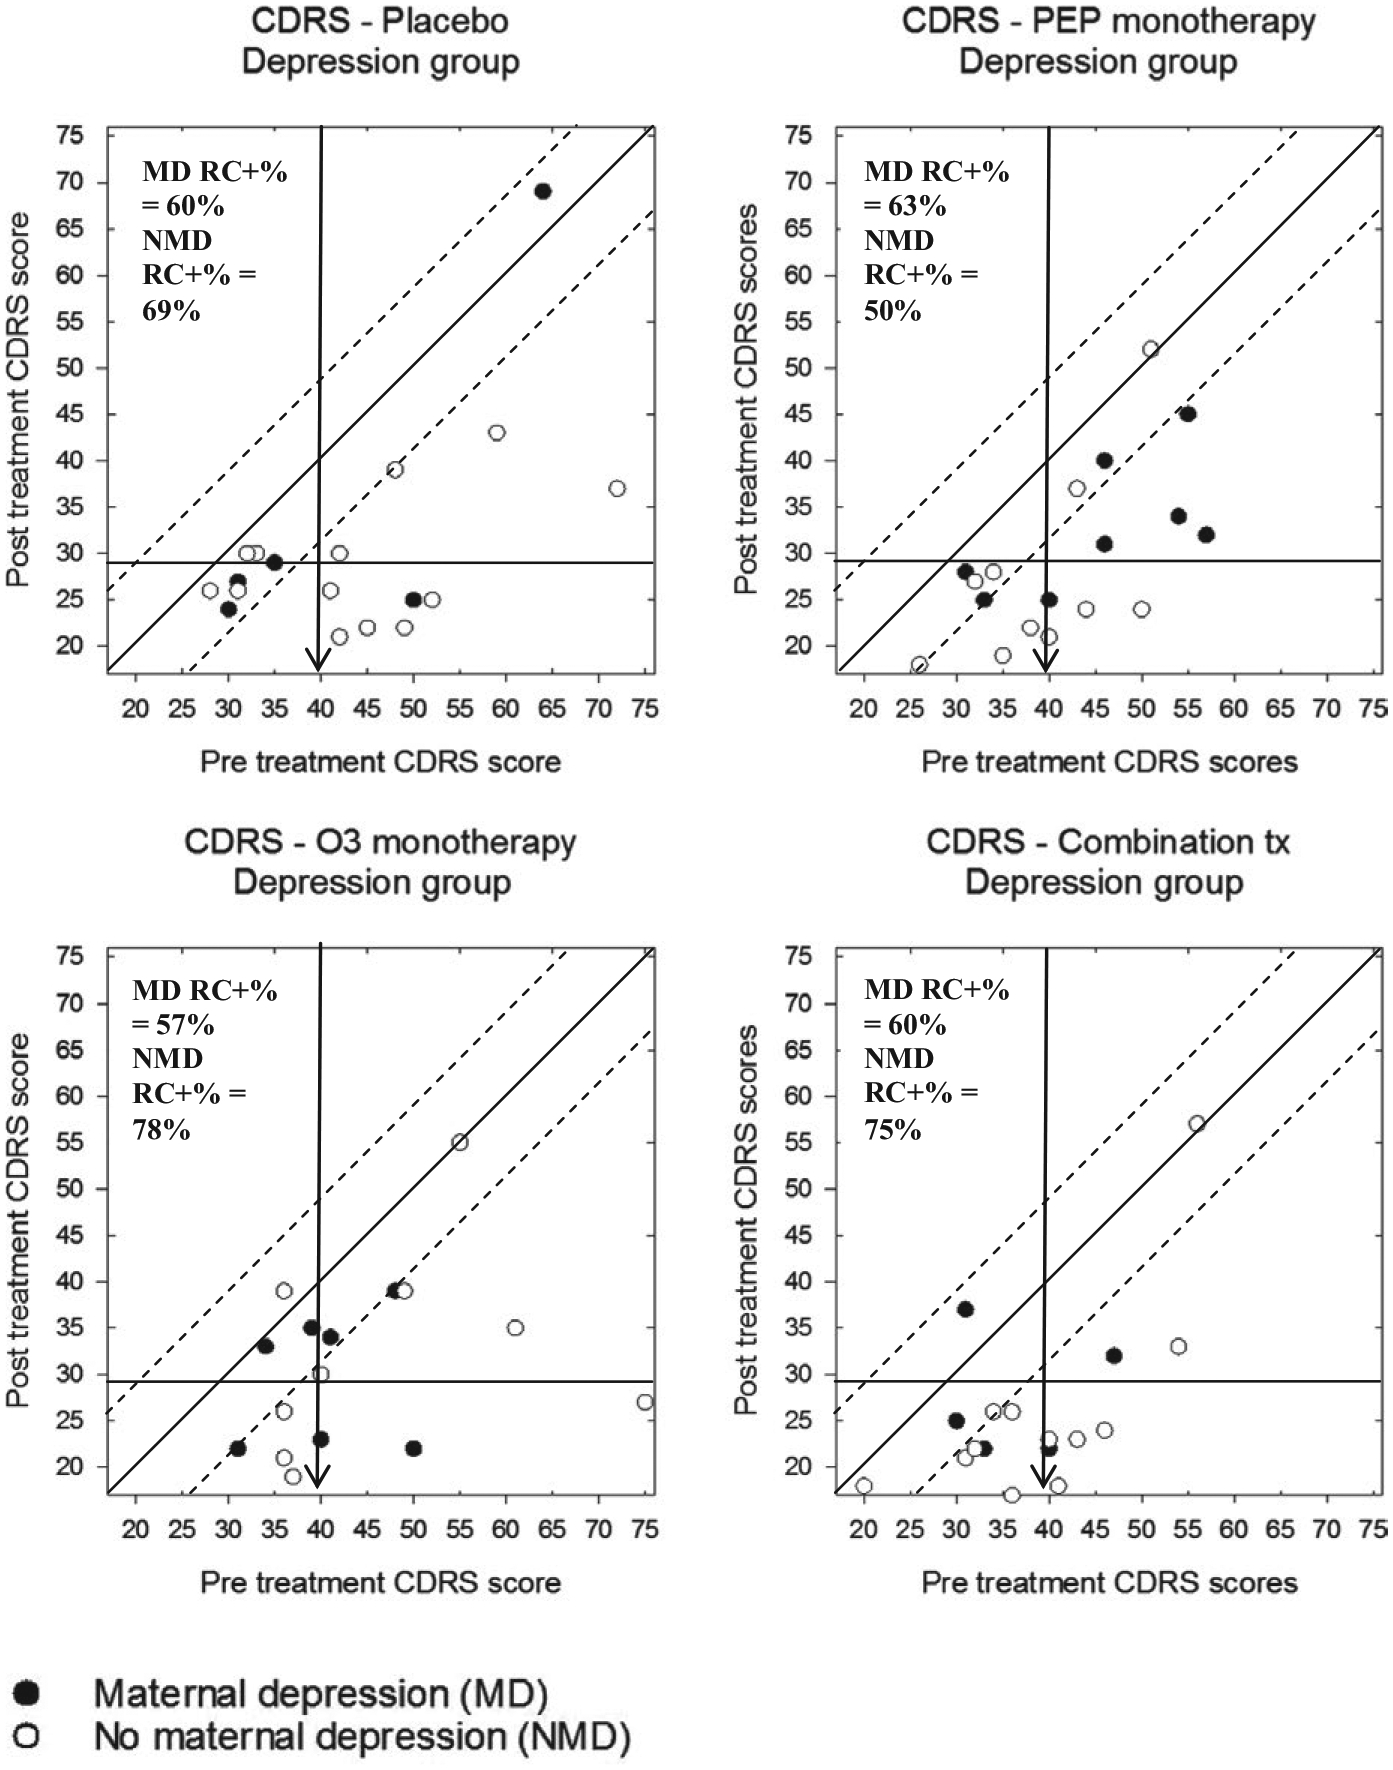
Modified Brinley plots depicting clinical change in CDRS-R scores across treatment conditions in the depression trial, separated by presence of maternal depression
FIGURE 6.
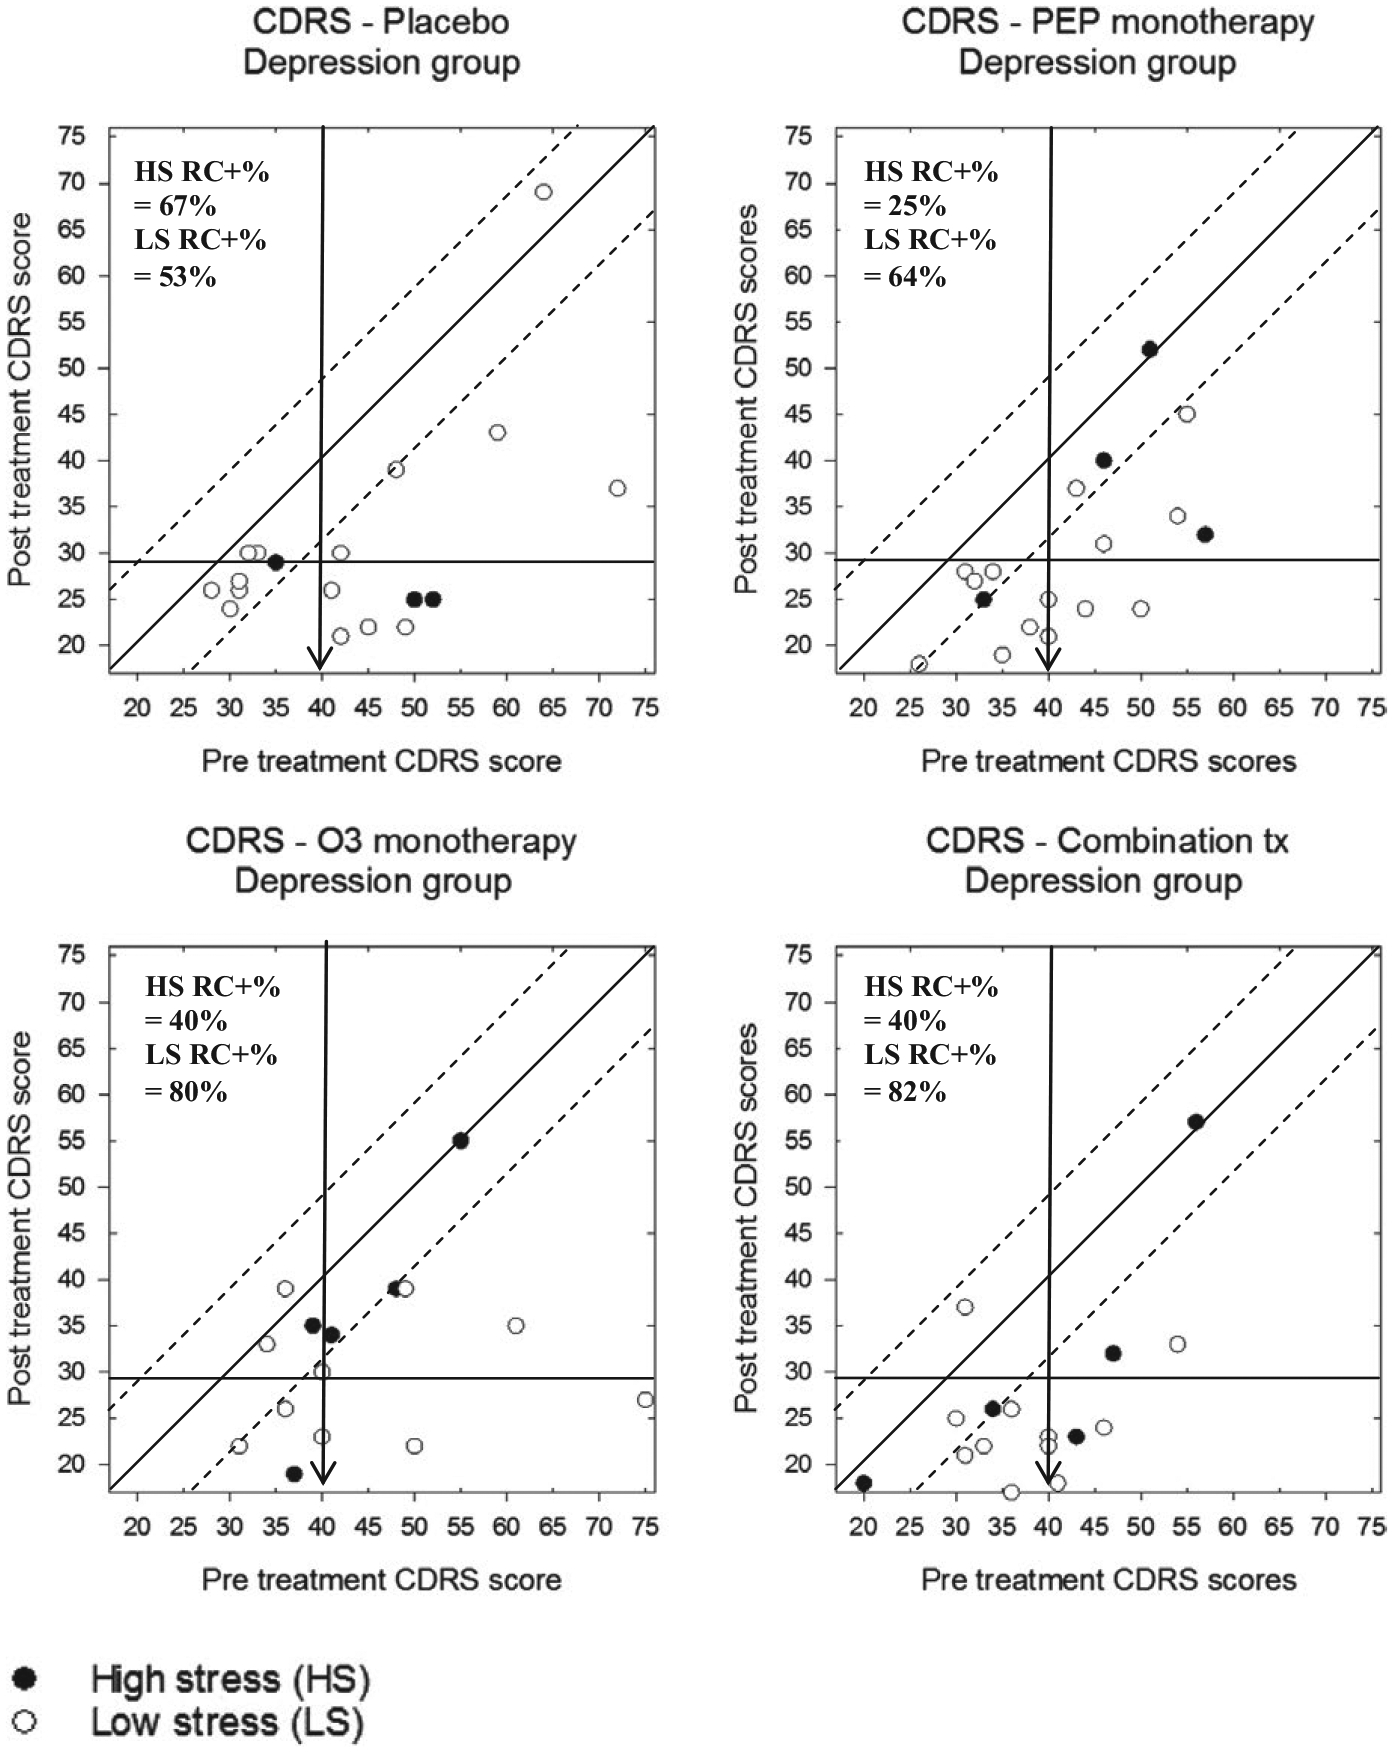
Modified Brinley plots depicting clinical change in CDRS-R scores across treatment conditions in the depression trial, separated by high or low stress exposure
Participants in the BP-NOS/CYC trial also showed reliable change in CDRS-R scores, but examining the plots also shows that the range of scores was restricted in the bipolar group, as would be expected (Figure 7). Accordingly, the percentage of participants evidencing reliable change in each treatment group was somewhat lower in the BP-NOS/CYC trial than in the depression trial: 2/6 (33%) in the placebo group 3/5, 3/7 (43%) in the IF-PEP + PBO group, 2/5 (40%) in the Ω3 + AM group, and 3/5 (60%) participants in the combined treatment group. Only participants from the combination treatment group demonstrated clinically significant change, however (2/5 participants, 40%). Furthermore, one each of bipolar participants in the IF-PEP group and the placebo group demonstrated reliable deterioration with regard to their depression scores, whereas no participants evidenced deterioration in the Ω3 and the combined treatment groups.
FIGURE 7.
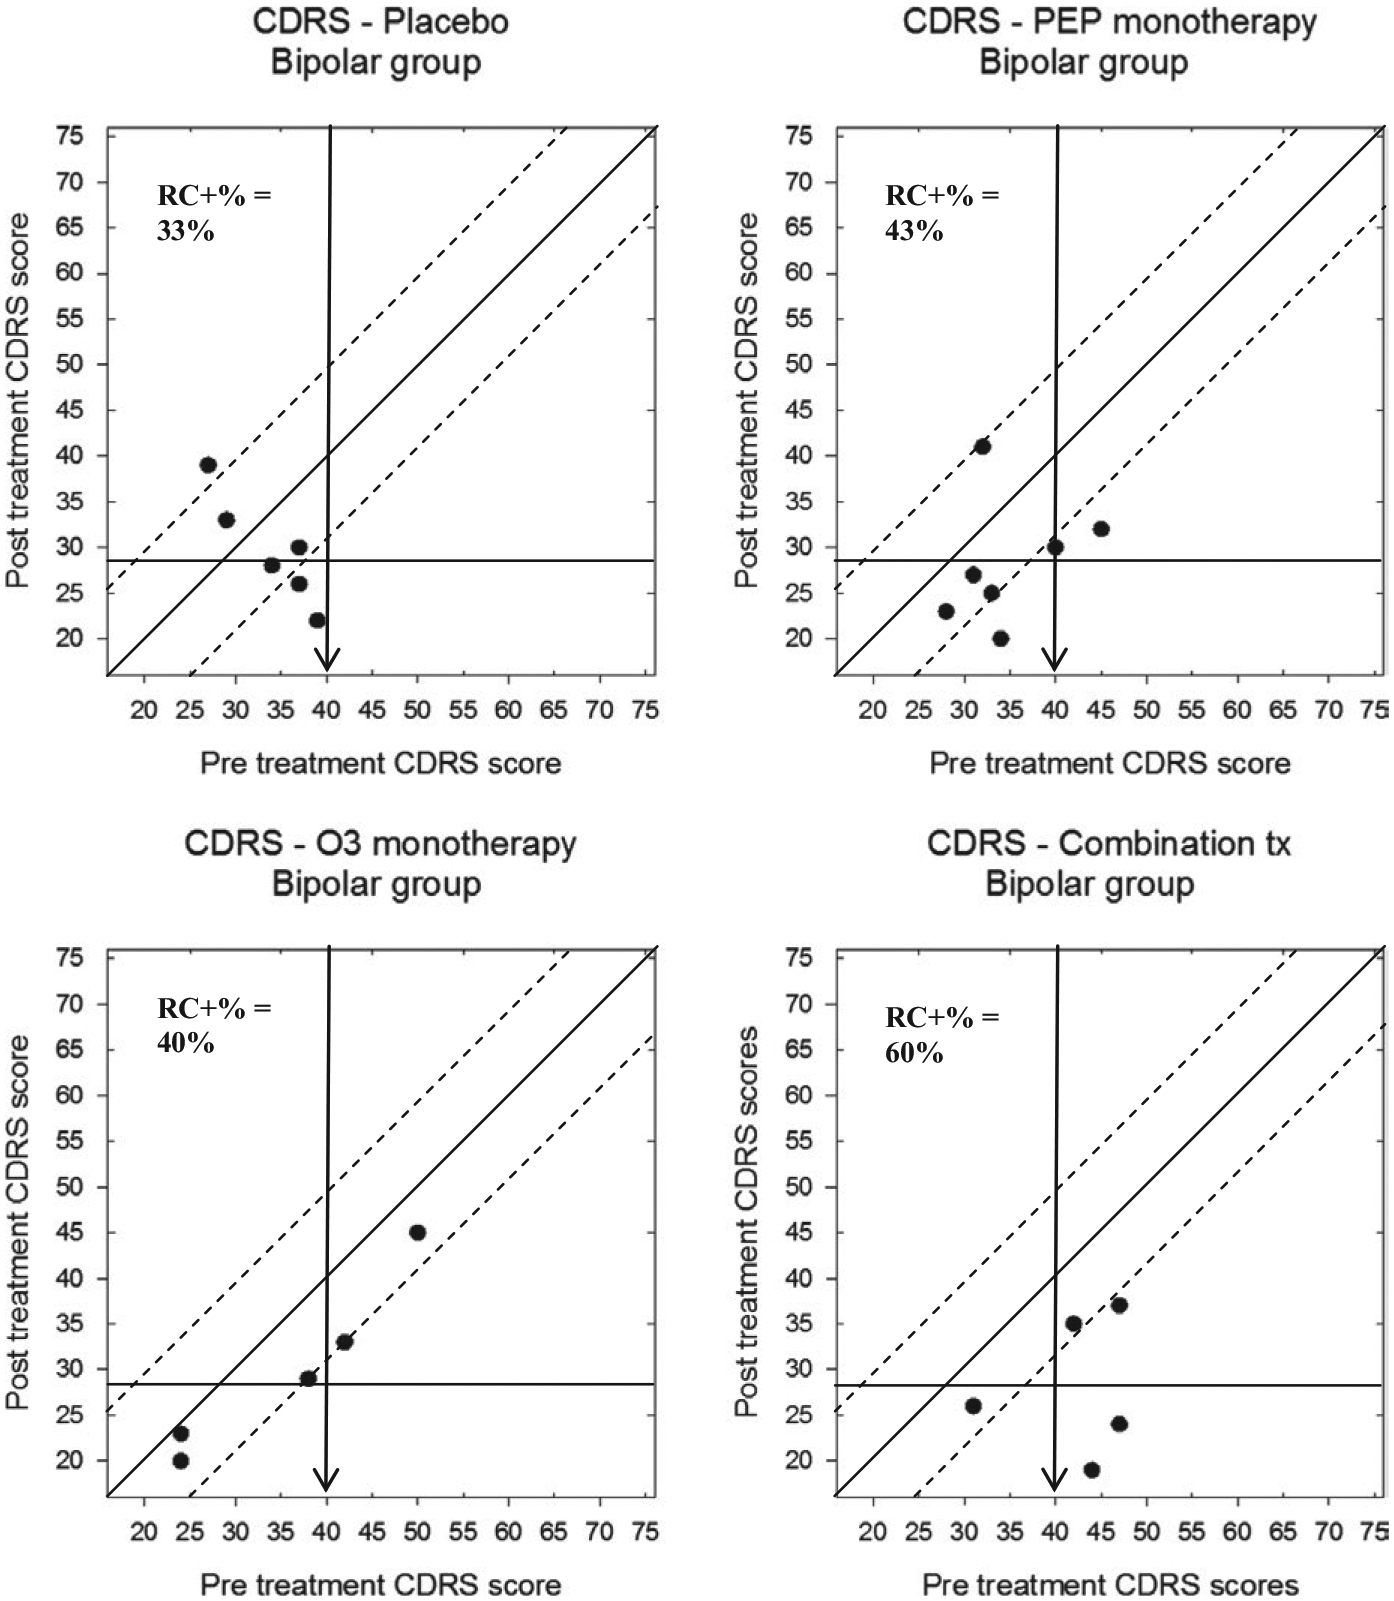
Modified Brinley plots depicting clinical change in CDRS-R scores across treatment conditions in the BP-NOS/CYC trial
Modified Brinley plots displaying the BP-NOS/CYC trial participants’ pre- and post-treatment YMRS scores are shown in Figure 8. Here, although nearly all participants’ scores declined throughout the trial, there were varying levels of reliable change across groups. Specifically, 0/6 (0%) of the placebo group participants demonstrated significant improvement, compared to 1/7 (14%) of the IF-PEP + PBO group, 3/5 (60%) of the Ω3 + AM group, and 1/5 (20%) of the combination group. Only one participant (20%) in the Ω3 + AM group demonstrated clinically significant change.
FIGURE 8.
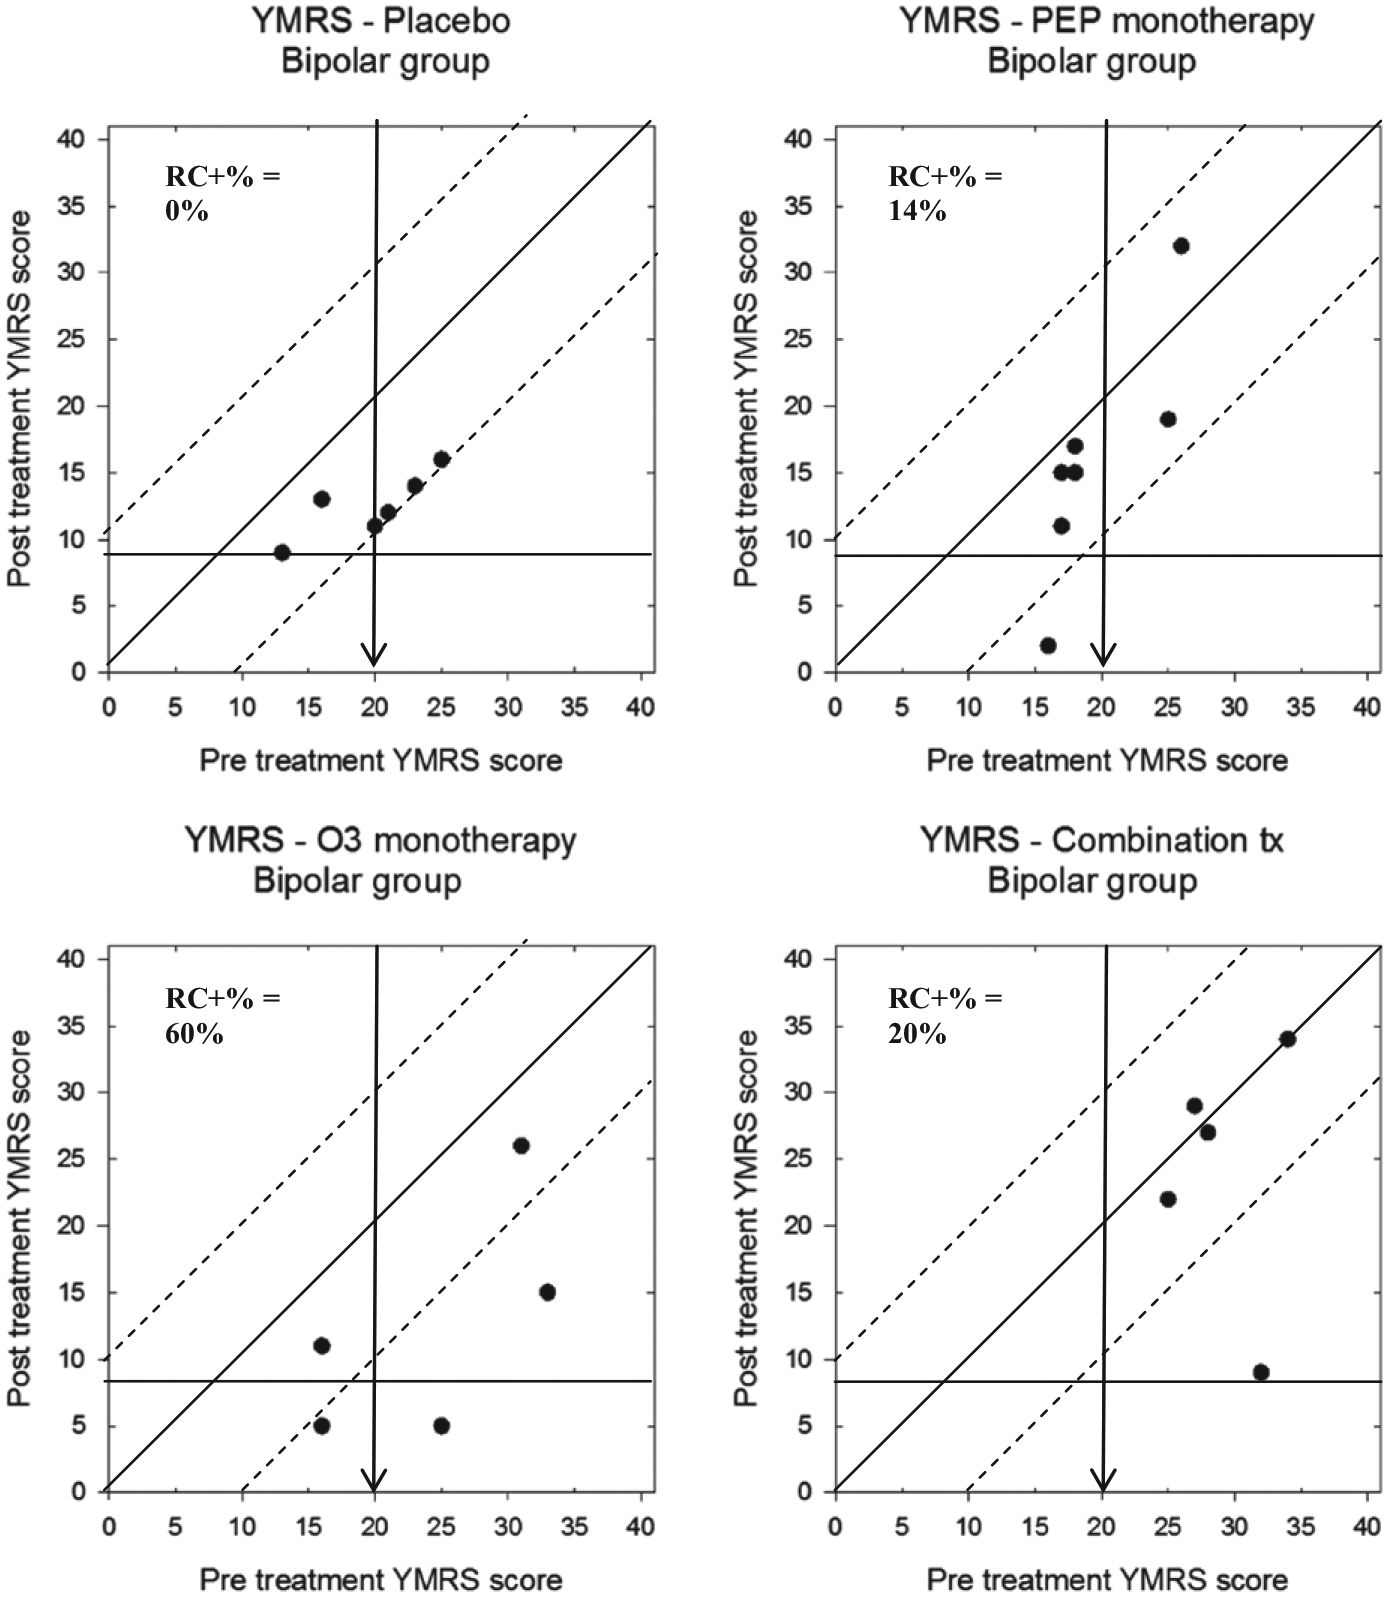
Modified Brinley plots depicting clinical change in YMRS scores across treatment conditions in the BP-NOS/CYC trial
Finally, CGAS scores for participants in the depression and BP-NOS/CYC trials can be found in Figures 9 and 10, respectively. Participants in the depression trial demonstrated some significant change: 5/18 (28%) of participants in the placebo group, 9/18 (50%) of the IF-PEP +PBO group, 6/16 (38%) of the Ω3 + AM group, and 10/17 (59%) of participants in the combination group. Importantly, no participants in any treatment group deteriorated more than the RCI boundary. Furthermore, with respect to clinically significant change, 3/18 (17%) of the placebo group, 6/18 (33%) in the IF-PEP + PBO group, 5/16 (31%) in the Ω3 + AM group, and 8/17 (47%) of the combined treatment group also exceeded the cutoff for normative functioning (CGAS > 70) after treatment. Participants in the BP-NOS/CYC trial, however, showed less overall change in global functioning. Specifically, although 2/6 (33%) of the placebo group and 2/5 (40%) of the combination group demonstrated reliable change on the CGAS, none of the participants in the PEP + PBO or Ω3 + AM groups showed reliable change. Similarly, no participants in the BP-NOS/CYC trial demonstrated clinically significant improvements in global functioning. Indeed, 2/7 (29%) of participants in the PEP + PBO group actually demonstrated a clinically significant decline in global functioning.
FIGURE 9.
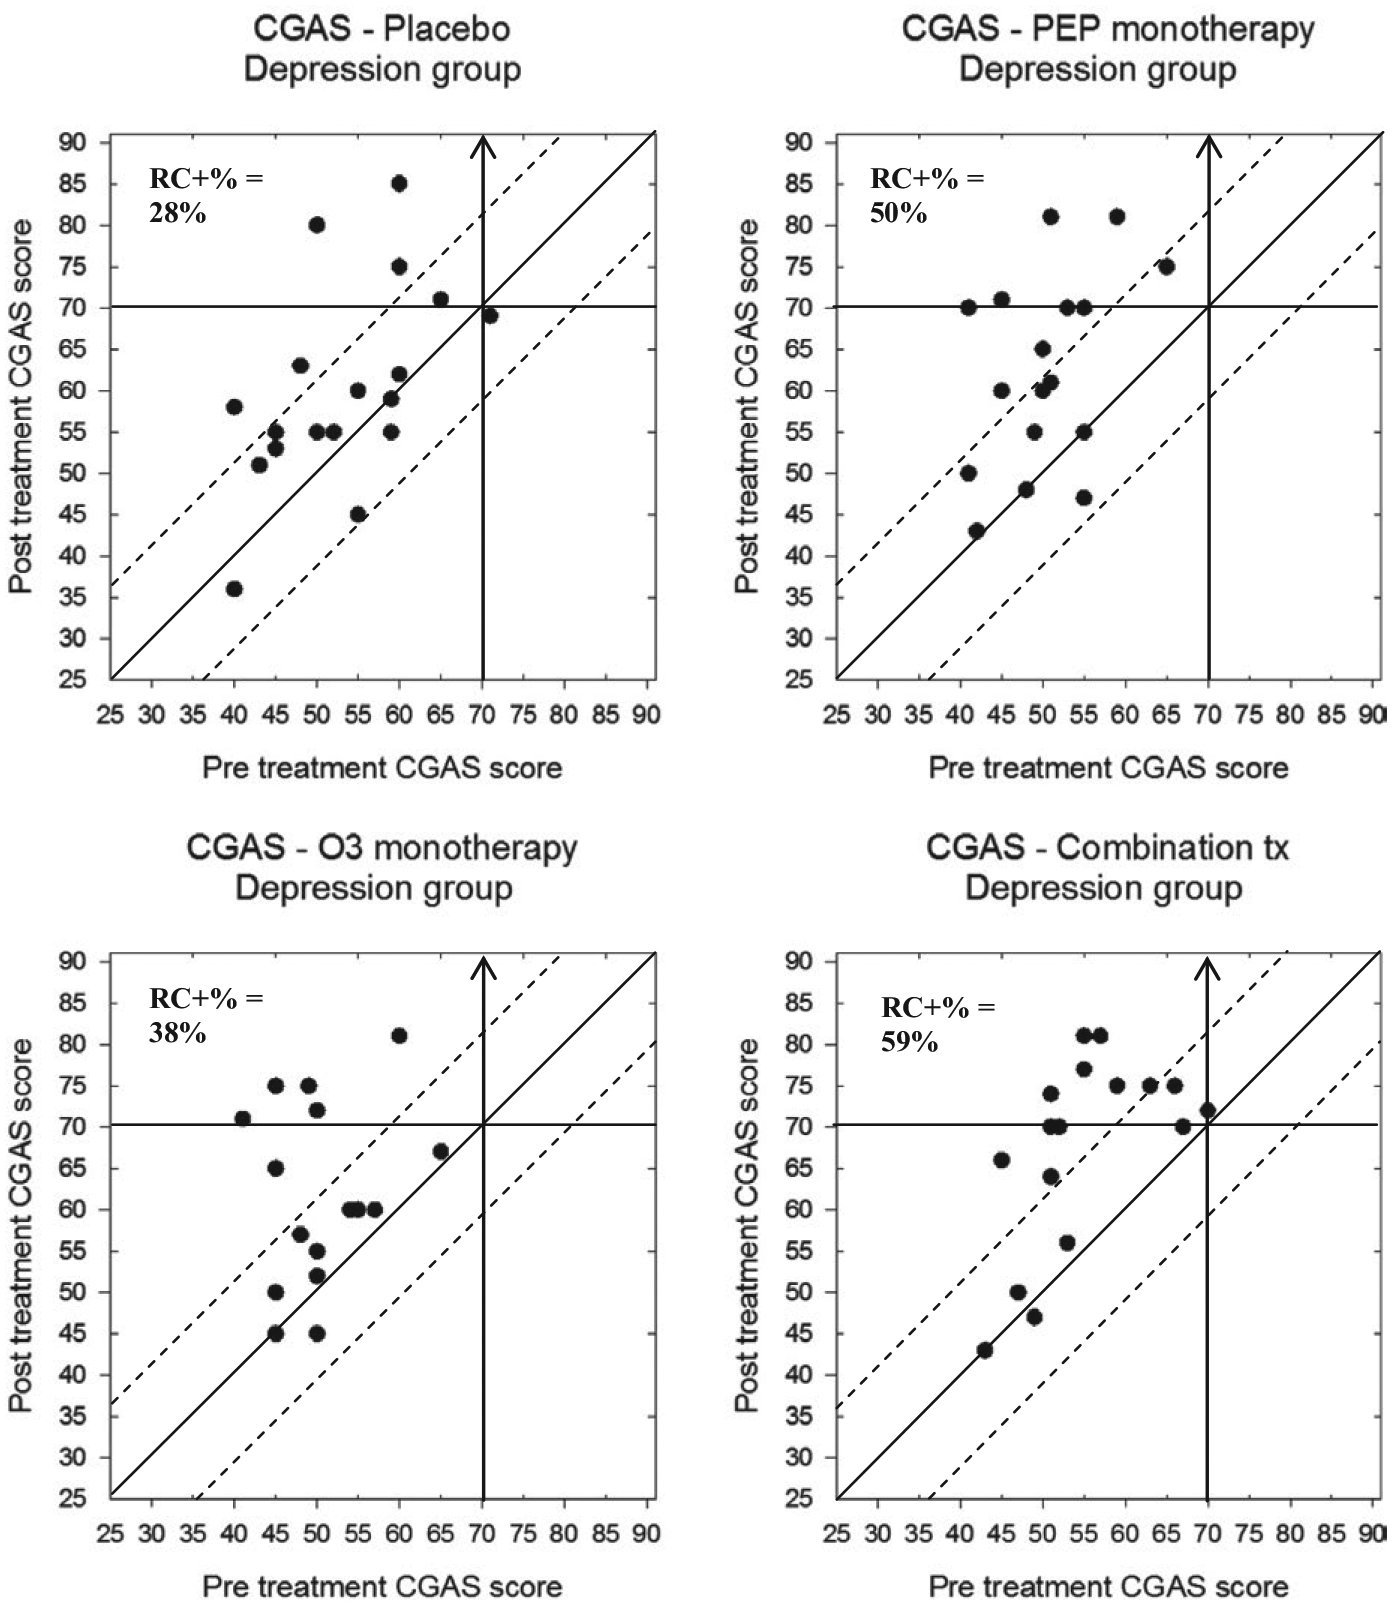
Modified Brinley plots depicting clinical change in CGAS scores across treatment conditions in the depression trial
FIGURE 10.
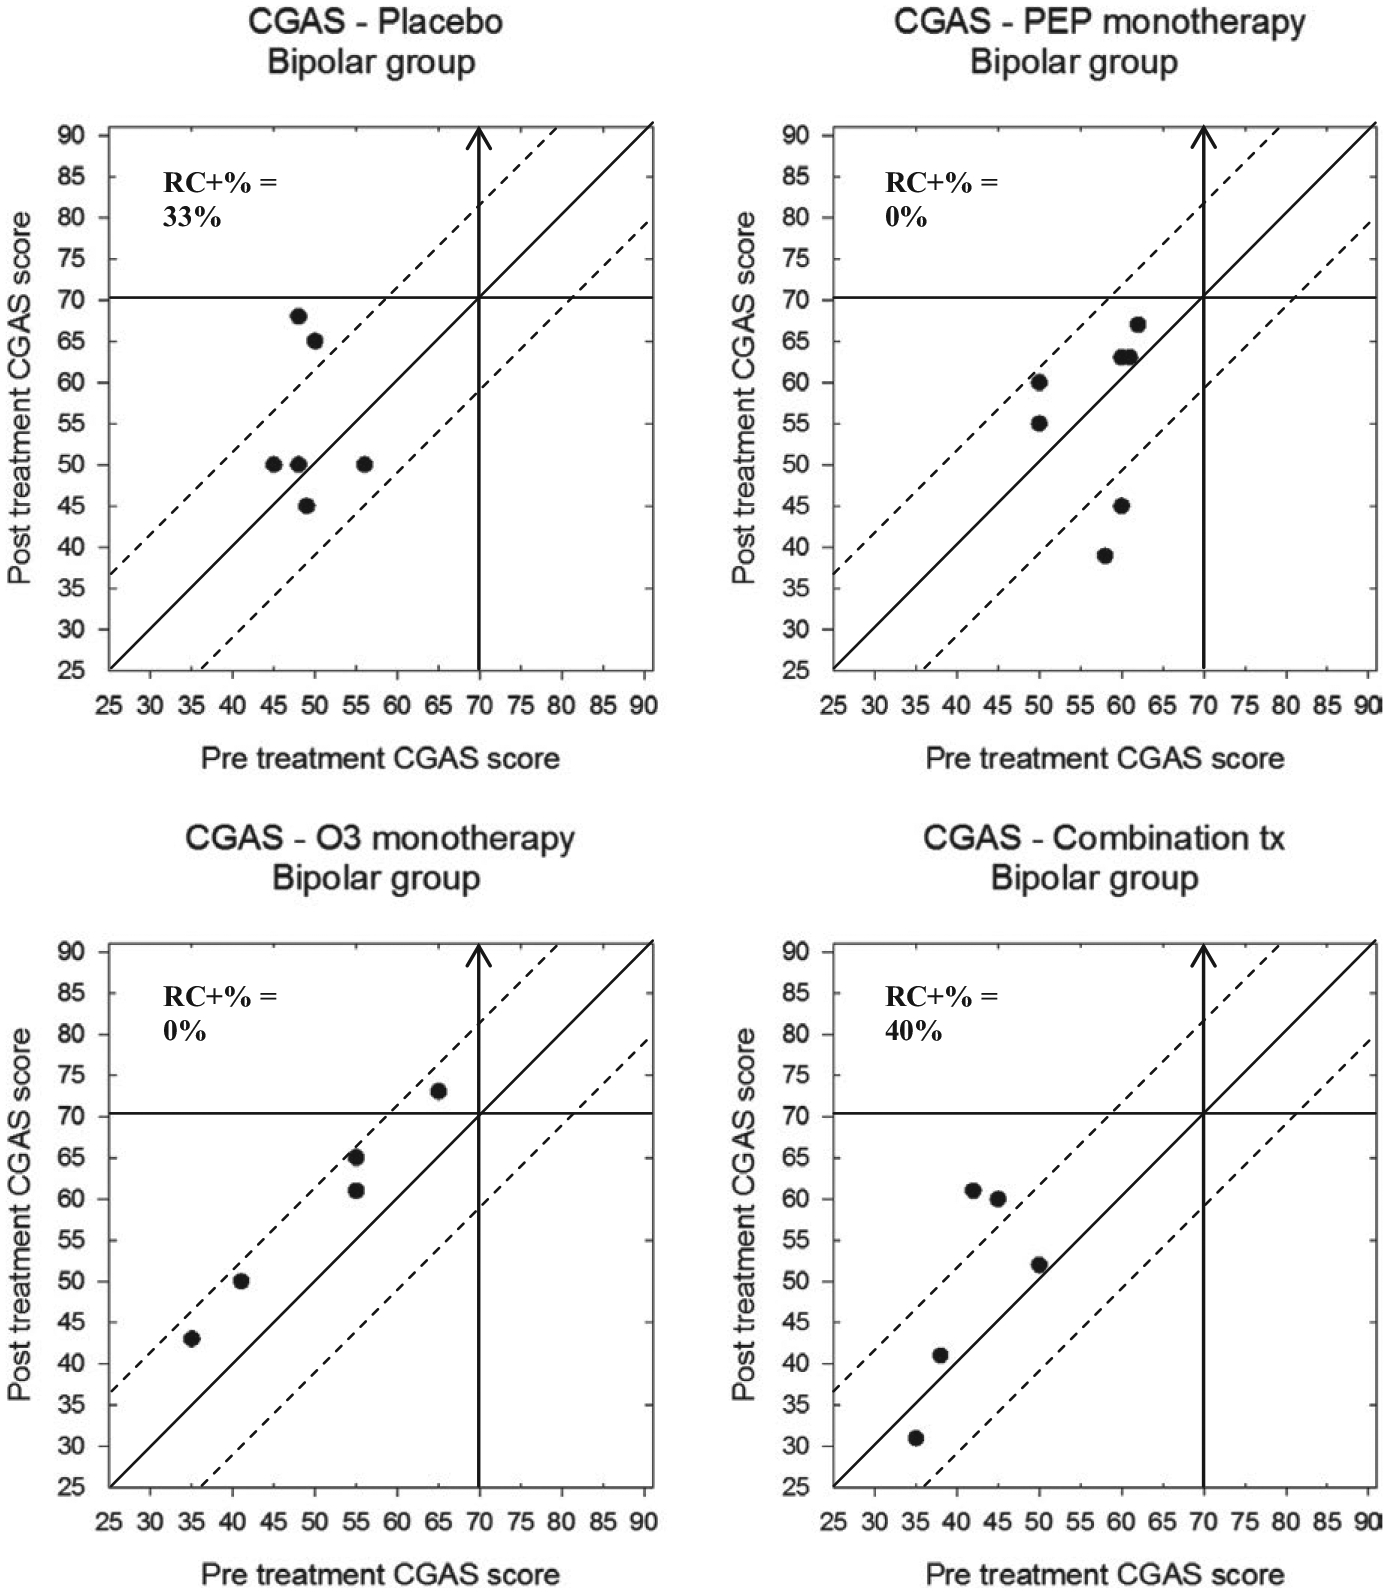
Modified Brinley plots depicting clinical change in CGAS scores across treatment conditions in the BP-NOS/CYC trial
In sum, the idiographic analyses show that while most participants’ symptoms improved, this improvement exceeded the threshold for reliable change (RCI) more often in the active treatment groups than in the placebo group. Furthermore, idiographic analyses revealed that a few participants demonstrated clinically significant deterioration, with meaningful increases in symptoms and declines in global functioning.
4 |. DISCUSSION
The current study compared a traditional, nomothetic approach to an idiographic approach as a method to assess change in a clinical trial for youth with mood disorders. Although results from the nomothetic approach suggested that there were no significant group differences with regard to symptom change, the idiographic approach painted a more nuanced picture. Specifically, calculating RCI and graphically depicting pre- and post-treatment scores showed that participation in the combined treatment group resulted in a higher frequency of reliable change on depression scores, for youth with both depressive and subsyndromal bipolar disorders. Furthermore, comparing the rates of both statistically and clinically significant change across two clinical groups showed that a greater proportion of depressed youth had lower depression scores as a result of the experimental treatments compared to bipolar youth. The original nomothetic analyses, in contrast, reported the same effects for both sets of youth. Therefore, the idiographic approach suggests that depressive symptoms in the depressed group may be more amenable to change from Ω3 and IF-PEP treatments than those in the bipolar group. Relatedly, though mania scores on the YMRS declined for nearly all participants in the BP-NOS/CYC trial, the percentages of reliable changes in response to treatment were rather low, except for the Ω3 monotherapy group. Global functioning as measured by the CGAS improved more for participants in the depression trial than the BP-NOS/CYC trial, but the combination treatment appeared to make the greatest impact on participants in both trials relative to the other treatment conditions. Finally, examining the Brinley plots suggests that the current treatments were more effective for children with milder symptom presentations.
Modified Brinley plots did not typically contradict the original findings from the nomothetic approach (with the exception of the findings around maternal depression; see below), but rather added to our understanding of the results. First, graphically depicting pre- and post-treatment scores demonstrated that while many participants improved over the course of the trials, a substantial number did not demonstrate clinically significant change. This is an important distinction, considering that all assessments have some degree of measurement error (Jacobson, Follette, & Revenstorf, 1984), and slight improvement should not be automatically attributed to an intervention. Second, although they were in the minority, a few participants demonstrated increases in symptom severity and declines in global functioning; the existence of this deterioration in symptoms was obscured in the original means-based, nomothetic approach. Third, modified Brinley plots clearly depicted not only reliable change, but also the proportion of individuals who moved from “ill” to “remitted” during the trials based on their symptom scores, thereby demonstrating clinically significant change (Jacobson & Truax, 1991). Finally, using an idiographic approach to compare results from the two trials demonstrated that youth with depressive and subsyndromal bipolar disorders responded differently to the same treatments. Notably, only participants from the BP-NOS/CYC trial demonstrated significant increases in symptom severity and declines in functioning during the trial.
The idiographic approach contradicted the nomothetic approach only when considering moderators. Specifically, the original nomothetic analyses suggested that a history of maternal depression was associated with significant symptom improvement in the depression trial, whereas the modified Brinley plots indicated that participants with a depressed mother showed less improvement than those without a depressed mother. Although somewhat puzzling, this discrepancy may highlight one of the shortcomings of the nomothetic approach—although results from the original moderator analyses were statistically significant, these differences may not have translated into clinically significant improvement. Detection of the latter is possible, however, only when individual change is considered (Jacobson & Truax, 1991). Due to the small cell sizes and limited number of participants who had a mother with depression, however, these results must be interpreted with caution with respect to any claims of generality.
4.1 |. Clinical applications
Although the preceding analysis demonstrated the value of modified Brinley plots in research settings, they may have even more utility in clinical settings. Figure 11, for example, demonstrates how modified Brinley plots can be used to depict session-by-session changes in treatment outcome, as well as to compare multiple patients within the same graph. Patient A started treatment below the clinical cutoff on the CDRS, then became more symptomatic in week 1 of treatment, improved reliably at week 2, returned to baseline at week 3, and then was more symptomatic at weeks 4 and 5. Patient B, in contrast, did not see any reliable or clinically significant change in his symptom scores during the 5 weeks of treatment. Finally, patients C and D both showed reliable and clinically significant improvement in their depression symptoms by the 5th week of treatment. Although numerous outcome measures are available to clinicians, modified Brinley plots have the advantage of being both free and flexible to utilize with multiple measures. Furthermore, tracking patient outcomes using these plots would meet the ACA’s mandate of providing brief screening for mental health services as part of a comprehensive insurance plan. Finally, such plots could be utilized in large group practice settings, in order to track overall performance of a clinician or group practice where clinicians use a standard outcome tracking measure (Blampied, 2017).
FIGURE 11.
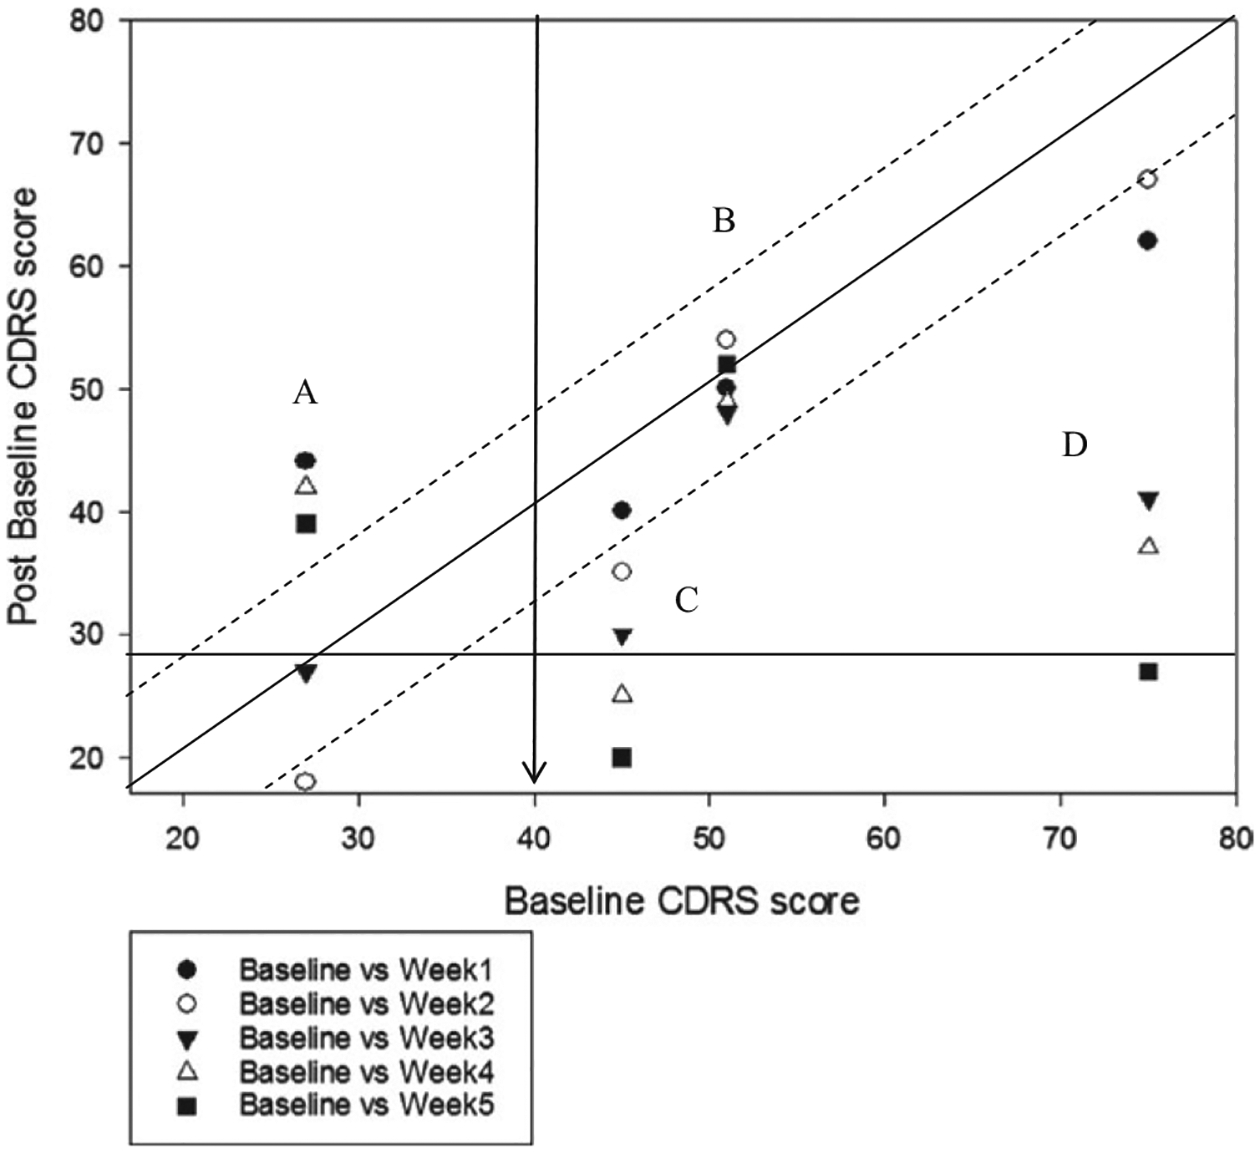
Modified Brinley plot depicting session-by-session change in CDRS scores for four individual participants
The current study had a number of important strengths, including demonstrating the use of modified Brinley plots in both research and clinical settings and utilizing modified Brinley plots to compare data from multiple conditions in one graph. There were, however, some important weaknesses. The current study utilized widely used symptom outcome measures for which psychometric data are readily available; these data may not be available for less frequently used measures. Furthermore, and particularly germane to the area of child and adolescent treatment, psychometric data used in the construction of modified Brinley plots should be based on a sample of similar- if not same-aged participants, which may be difficult to obtain for less frequently utilized measures. Additionally, although modified Brinley plots depict individuals’ data, it is not possible to clearly identify which data point applies to which individual; therefore, group display of these data may be less helpful when seeking to make changes in an individual’s treatment based on these plots. Notably, this is less of a limitation when considering the session-by-session tracking of outcome measures, as every participant’s score on the x-axis is fixed (pretreatment score) which creates a separate “line” of data for each individual. Finally, though all youth met study criteria with regard to symptom scores, many youth demonstrated significant improvement from the screening assessment alone (see Young et al., 2016); since the current analyses utilized baseline rather than screening data as the pretreatment scores, our ability to depict clinically significant change in the modified Brinley plots may have been limited by a floor effect.
As our analysis demonstrates, in large-scale clinical trials, modified Brinley plots can be used in conjunction with traditional nomothetic analyses to help investigators develop a more nuanced interpretation of the effectiveness and clinical utility of a given treatment. Modified Brinley plots may be even more valuable to clinicians in practice, however, as they can be used to visualize the clinical significance of any given client’s change score without needing a large, standardized sample with which to compare them. Additionally, over time clinicians could collate data from many clients in order to ascertain rates of success and effectiveness in using certain treatments in their practice. Finally, data from modified Brinley plots may also alert clinicians to significant deterioration, which may signal a need to modify the current treatment approach. We can, therefore, conclude that we have provided one answer to the question, “Can we enrich these [nomothetic] methodologies with a complementary focus on the individual?” (Barlow & Nock, 2009, p. 20). Our answer is yes, by using modified Brinley plots (Blampied, 2017).
Funding information
This research was supported in part by NIH R034 MH090148-03 and R034 MH85875 (Co-PIs: M. Fristad and L.E. Arnold)
CONFLICT OF INTEREST
Dr. Arnold has received research funding from Forest, Lilly, Noven, Shire, Supernus, Roche, and YoungLiving (as well as NIH and Autism Speaks), has consulted with Pfizer, Tris Pharma, and Waypoint, and been on advisory boards for Arbor, Ironshore, Otsuka, Pfizer, Roche, Seaside Therapeutics, Shire. Dr. Fristad receives research funding from Janssen and royalties from Guilford Press, American Psychiatric Press, and Child & Family Psychological Services.
REFERENCES
- Allport GW (1942). The use of personal documents in psychological science. New York, NY: Social Science Research Council. [Google Scholar]
- Barlow DH, & Nock MK (2009). Why can’t we be more idiographic in our research? Perspectives on Psychological Science, 4(1), 19–21. 10.1111/j.1745-6924.2009.01088.x. [DOI] [PubMed] [Google Scholar]
- Baron RM, & Kenny DA (1986). The moderator–mediator variable distinction in social psychological research: Conceptual, strategic, and statistical considerations. Journal of Personality and Social Psychology, 51(6), 1173–1182. 10.1037/0022-3514.51.6.1173. [DOI] [PubMed] [Google Scholar]
- Bergin AE, & Strupp HH (1972). Changing frontiers in the science of psychotherapy. New York, NY: Aldine. [Google Scholar]
- Bird HR, Canino G, Rubio-Stipec M, & Ribera JC (1987). Further measures of the psychometric properties of the Children’s Global Assessment Scale. Archives of General Psychiatry, 44(9), 821–824. [DOI] [PubMed] [Google Scholar]
- Blampied NM (2017). Analyzing therapeutic change using modified Brinley plots: History, construction, and interpretation. Behavior Therapy, 48(1), 115–127. 10.1016/j.beth.2016.09.002. [DOI] [PubMed] [Google Scholar]
- Bopp KL, & Verhaeghen P (2005). Aging and verbal memory span: A meta-analysis. The Journals of Gerontology Series B: Psychological Sciences and Social Sciences, 60(5), 223–233. 10.1093/geronb/60.5.P223. [DOI] [PubMed] [Google Scholar]
- Brinley JF (1965). Cognitive sets, speed and accuracy of performance in the elderly. In Welford AT, & Birren JE (Eds.), Behavior, aging and the nervous system (pp. 114–149). Springfield, IL: Thomas. [Google Scholar]
- Busch AM, Wagener TL, Gregor KL, Ring KT, & Borrelli B (2011). Utilizing reliable and clinically significant change criteria to assess for the development of depression during smoking cessation treatment: The importance of tracking idiographic change. Addictive Behaviors, 36(12), 1228–1232. 10.1016/j.addbeh.2011.07.031. [DOI] [PMC free article] [PubMed] [Google Scholar]
- Cerin E (2004). Predictors of competitive anxiety direction in male Tae Kwon Do practitioners: A multilevel mixed idiographic/nomothetic interactional approach. Psychology of Sport and Exercise, 5(4), 497–516. 10.1016/S1469-0292(03)00041-4. [DOI] [Google Scholar]
- Cohen J (1992). A power primer. Psychological Bulletin, 112(1), 155–159. 10.1037/0033-2909.112.1.155 [DOI] [PubMed] [Google Scholar]
- Cohen LL, Feinstein A, Masuda A, & Vowles KE (2013). Single-case research design in pediatric psychology: Considerations regarding data analysis. Journal of Pediatric Psychology, 39(2), 124–137. 10.1093/jpepsy/jst065. [DOI] [PubMed] [Google Scholar]
- Dyrborg J, Larsen FW, Nielsen S, Byman J, Nielsen BB, & Gautrè-Delay F (2000). The Children’s Global Assessment Scale (CGAS) and Global Assessment of Psychosocial Disability (GAPD) in clinical practice: Substance and reliability as judged by intraclass correlations. European Child & Adolescent Psychiatry, 9(3), 195–201. 10.1007/s007870070043. [DOI] [PubMed] [Google Scholar]
- Emslie GJ, Kennard BD, Mayes TL, Nightingale-Teresi J, Carmody T, Hughes CW, … & Rintelmann JW (2008). Fluoxetine versus placebo in preventing relapse of major depression in children and adolescents. American Journal of Psychiatry, 165(4), 459–467. [DOI] [PMC free article] [PubMed] [Google Scholar]
- Endicott J, Spitzer RL, Fleiss JL, & Cohen J (1976). The Global Assessment Scale: A procedure for measuring overall severity of psychiatric disturbance. Archives of General Psychiatry, 33(6), 766–771. 10.1001/archpsyc.1976.01770060086012. [DOI] [PubMed] [Google Scholar]
- Evans C, Margison F, & Barkham M (1998). The contribution of reliable and clinically significant change methods to evidence-based mental health. Evidence-Based Mental Health, 1(3), 70–72. 10.1136/ebmh.1.3.70. [DOI] [Google Scholar]
- Fayad SM, Guzick AG, Reid AM, Mason DM, Bertone A, Foote KD, … Ward HE (2016). Six-nine year follow-up of deep brain stimulation for obsessive-compulsive disorder. PLoS ONE, 11(12), e0167875. 10.1371/journal.pone.0167875. [DOI] [PMC free article] [PubMed] [Google Scholar]
- Feingold A (2009). Effect sizes for growth-modeling analysis for controlled clinical trials in the same metric as for classical analysis. Psychological Methods, 14(1), 43–53. 10.1037/a0014699. [DOI] [PMC free article] [PubMed] [Google Scholar]
- Fristad MA, Goldberg-Arnold JS, & Leffler JM (2011). Psychotherapy for children with bipolar and depressive disorders. New York: Guilford Press. [Google Scholar]
- Fristad MA, Vesco AT, Young AS, Healy KZ, Nader ES, Gardner W, … Arnold LE (2016). Pilot randomized controlled trial of omega-3 and individual–family psychoeducational psychotherapy for children and adolescents with depression. Journal of Clinical Child & Adolescent Psychology, 1–14, 10.1080/15374416.2016.1233500. [DOI] [PMC free article] [PubMed] [Google Scholar]
- Fristad MA, Young AS, Vesco AT, Nader ES, Healy KZ, Gardner W, … Arnold LE (2015). A randomized controlled trial of individual family psychoeducational psychotherapy and omega-3 fatty acids in youth with subsyndromal bipolar disorder. Journal of Child and Adolescent Psychopharmacology, 25(10), 764–774. 10.1089/cap.2015.0132. [DOI] [PMC free article] [PubMed] [Google Scholar]
- Gracious BL, Youngstrom EA, Findling RL, & Calabrese JR (2002). Discriminative validity of a parent version of the Young Mania Rating Scale. Journal of the American Academy of Child & Adolescent Psychiatry, 41(11), 1350–1359. [DOI] [PubMed] [Google Scholar]
- Gracious BL, Holmes WD, Ruppar N, Burke KC, & Hurt J (1994). Mania Rating Scale reliability in children and adolescents. Presented at the First Annual International Conference on Bipolar Disorders, Pittsburgh, PA. [Google Scholar]
- Grice JW (2015). From means and variances to persons and patterns. Frontiers in Psychology, 6, 1–12. 10.3389/fpsyg.2015.01007. [DOI] [PMC free article] [PubMed] [Google Scholar]
- Jacobson NS, Follette WC, & Revenstorf D (1984). Psychotherapy outcome research: Methods for reporting variability and evaluating clinical significance. Behavior Therapy, 15, 336–352. 10.1016/S0005-7894(84)80002-7. [DOI] [Google Scholar]
- Jacobson NS, & Truax P (1991). Clinical significance: A statistical approach to defining meaningful change in psychotherapy research. Methodological Issues & Strategies in Clinical Research, 59(1), 631–648. 10.1037/10109-042. [DOI] [PubMed] [Google Scholar]
- Kahn JH, & Schneider WJ (2013). It’s the destination and it’s the journey: Using multilevel modeling to assess patterns of change in psychotherapy. Journal of Clinical Psychology, 69(6), 543–570. 10.1002/jclp.21964. [DOI] [PubMed] [Google Scholar]
- Kaptchuk TJ (2001). The double-blind, randomized, placebo-controlled trial: Gold standard or golden calf? Journal of Clinical Epidemiology, 54(6), 541–549. 10.1016/S0895-4356(00)00347-4. [DOI] [PubMed] [Google Scholar]
- Kaufman J, Birmaher B, Brent D, Rao U, Flynn C, Moreci P, … Ryan N (1997). Schedule for Affective Disorders and Schizophrenia for School-Age Children-Present and Lifetime Version (K-SADS-PL): Initial reliability and validity data. Journal of the American Academy of Child & Adolescent Psychiatry, 36(7), 980–988. 10.1097/00004583-199707000-00021. [DOI] [PubMed] [Google Scholar]
- Kravitz RL, Duan N, & Braslow J (2004). Evidence-based medicine, heterogeneity of treatment effects, and the trouble with averages. The Millbank Quarterly, 82(4), 661–687. 10.1111/j.0887-378X.2004.00327.x. [DOI] [PMC free article] [PubMed] [Google Scholar]
- Lakens D (2013). Calculating and reporting effect sizes to facilitate cumulative science: A practical primer for t-tests and ANOVAs. Frontiers in Psychology, 4, 1–12. 10.3389/fpsyg.2013.00863. [DOI] [PMC free article] [PubMed] [Google Scholar]
- Lamiell JT (1998). “Nomothetic” and “idiographic”: Contrasting Windelband’s understanding with contemporary usage. Theory & Psychology, 8(1), 23–38. 10.1177/0959354398081002. [DOI] [Google Scholar]
- Mayes TL, Bernstein IH, Haley CL, Kennard BD, & Emslie GJ (2010). Psychometric properties of the Children’s Depression Rating Scale-Revised in adolescents. Journal of Child and Adolescent Psychopharmacology, 20(6), 513–516. [DOI] [PMC free article] [PubMed] [Google Scholar]
- Micceri T (1989). The unicorn, the normal curve, and other improbable creatures. Psychological Bulletin, 105(1), 156. 10.1037/0033-2909.105.1.156. [DOI] [Google Scholar]
- Ogles BM, Lambert MJ, & Fields SA (2002). Essentials of outcome assessment. Hoboken, NJ, USA: John Wiley & Sons Inc. [Google Scholar]
- Ogles BM, Lambert MJ, & Sawyer JD (1995). Clinical significance of the National Institute of Mental Health Treatment of Depression Collaborative Research Program data. Journal of Consulting and Clinical Psychology, 63(2), 321–326. 10.1037//0022-006X.63.2.321. [DOI] [PubMed] [Google Scholar]
- Peiffer AM, Maldjian JA, & Laurienti PJ (2008). Resurrecting Brinley plots for a novel use: Meta-analyses of functional brain imaging data in older adults. International Journal of Biomedical Imaging, 2008, 1–7. 10.1155/2008/167078. [DOI] [PMC free article] [PubMed] [Google Scholar]
- Poznanski EO, Grossman JA, Buchsbaum Y, Banegas M, Freeman L, & Gibbons R (1984). Preliminary studies of the reliability and validity of the Children’s Depression Rating Scale. Journal of the American Academy of Child Psychiatry, 23(2), 191–197. 10.1097/00004583-198403000-00011. [DOI] [PubMed] [Google Scholar]
- Rucci AJ, & Tweney RD (1980). Analysis of variance and the “second discipline” of scientific psychology: A historical account. Psychological Bulletin, 87(1), 166–184. 10.1037/0033-2909.87.1.166. [DOI] [Google Scholar]
- Shaffer D, Gould MS, Brasic J, Ambrosini P, Fisher P, Bird H, & Aluwahlia S (1983). A Children’s Global Assessment Scale (CGAS). Archives of General Psychiatry, 40(11), 1228–1231. 10.1001/archpsyc.1983.01790100074010. [DOI] [PubMed] [Google Scholar]
- Sobell MB, Sobell LC, & Gavin DR (1995). Portraying alcohol treatment outcomes: Different yardsticks of success. Behavior Therapy, 26(4), 643–669. 10.1016/s0005-7894(05)80037-1. [DOI] [Google Scholar]
- Stunkard AJ, & Penick SB (1979). Behavior modification in the treatment of obesity: The problem of maintaining weight loss. Archives of General Psychiatry, 36(7), 801–806. 10.001/archpsyc.1979.01780070079009. [DOI] [PubMed] [Google Scholar]
- Sullivan GM, & Feinn R (2012). Using effect size—or why the P value is not enough. Journal of Graduate Medical Education, 4(3), 279–282. 10.4300/JGME-D-12-00156.1. [DOI] [PMC free article] [PubMed] [Google Scholar]
- Temprado J, Sleimen-Malkoun R, Lemaire P, Rey-Robert B, Retornaz F, & Berton E (2013). Aging of sensorimotor processes: A systematic study in Fitts’ task. Experimental Brain Research, 228(1), 105–116. 10.1007/s00221-013-3542-0. [DOI] [PubMed] [Google Scholar]
- Weissman MM, Wickramaratne P, Adams P, Wolk S, Verdeli H, & Olfson M (2000). Brief screening for family psychiatric history: The Family History Screen. Archives of General Psychiatry, 57(7), 675–682. 10.1001/archpsyc.57.7.675. [DOI] [PubMed] [Google Scholar]
- Weller EB, Fristad MA, Weller RA, & Rooney MT (1999). Children’s interview for psychiatric syndromes: ChIPS. Washington, DC: American Psychiatric Press Inc. [DOI] [PubMed] [Google Scholar]
- Weller EB, Weller RA, Fristad MA, & Rooney MT (1999). P-ChIPS: Children’s interview for psychiatric syndromes: Parent version. Washington, DC: American Psychiatric Press Inc. [Google Scholar]
- Wilkinson L, & Task Force on Statistical Inference (1999). Statistical methods in psychology journals: Guidelines and explanations. American Psychologist, 54, 594–604. 10.1037/0003-066X.54.8.594. [DOI] [Google Scholar]
- Wilson SA, Becker LA, & Tinker RH (1997). Fifteen-month follow-up of Eye Movement Desensitization and Reprocessing (EMDR) treatment for Posttraumatic Stress Disorder and psychological trauma. Journal of Consulting and Clinical Psychology, 65(6), 1047–1056. 10.1037/0022-006X.65.6.1047. [DOI] [PubMed] [Google Scholar]
- Wise EA (2004). Methods for analysing psychotherapy outcomes: A review of clinical significance, reliable change, and recommendations for future directions. Journal ofPersonality Assessment, 82, 50–59. 10.1207/s15327752jpa8201_10. [DOI] [PubMed] [Google Scholar]
- Yee AM, Algorta GP, Youngstrom EA, Findling RL, Birmaher B, & Fristad MA, & The LAMS Group (2014). Unfiltered administration of the YMRS and CDRS-R in a clinical sample of children. Journal of Clinical Child & Adolescent Psychology, 44(6), 992–1007. 10.1080/15374416.2014.915548. [DOI] [PMC free article] [PubMed] [Google Scholar]
- Young AS, Meers MR, Vesco AT, Seidenfeld AM, Arnold LE, & Fristad MA (2016). Predicting therapeutic effects of psychodiagnostic assessment among children and adolescents participating in randomized controlled trials. Journal of Clinical Child & Adolescent Psychology. Advance online publication. 10.1080/15374416.2016.1146992. [DOI] [PMC free article] [PubMed] [Google Scholar]
- Young RC, Biggs JT, Ziegler VE, & Meyer DA (1978). A rating scale for mania: Reliability, validity and sensitivity. The British Journal of Psychiatry, 133(5), 429–435. 10.1192/bjp.133.5.429. [DOI] [PubMed] [Google Scholar]
- Youngstrom EA, Danielson CK, Findling RL, Gracious BL, & Calabrese JR (2002). Factor structure of the Young Mania Rating Scale for use with youths ages 5 to 17 years. Journal of Clinical Child and Adolescent Psychology, 31(4), 567–572. 10.1207/153744202320802232. [DOI] [PubMed] [Google Scholar]


