

Abstract
This article describes the ongoing structure of radiation oncology in Japan in terms of equipment, personnel, patient load and geographic distribution to identify and overcome any existing limitations. From May 2016 to August 2018, the Japanese Society for Radiation Oncology conducted a questionnaire based on the Japanese national structure survey of radiation oncology in 2015. Data were analyzed based on the institutional stratification by the annual number of new patients treated with radiotherapy per institution. The estimated annual numbers of new and total (new plus repeat) patients treated with radiation were 225 000 and 271 000, respectively. Additionally, the estimated cancer incidence was 891 445 cases with approximately 25.2% of all newly diagnosed patients being treated with radiation. The types and numbers of treatment devices actually used included linear accelerator (linac; n = 936), Gamma Knife (n = 43), 60Co remote afterloading system (RALS; n = 21), and 192Ir RALS (n = 129). The linac system used dual-energy functions in 754 units, 3D conformal radiotherapy functions in 867, and intensity-modulated radiotherapy (IMRT) functions in 628. There were 899 Japan Radiological Society/Japanese Society for Radiation Oncology-certified radiation oncologists (RO), 1213.9 full-time equivalent (FTE) ROs, 2394.2 FTE radiotherapy technologists (RTT), 295.7 FTE medical physicists, 210.2 FTE radiotherapy quality managers, and 906.1 FTE nurses. The frequency of IMRT use significantly increased during this time. In conclusion, the Japanese structure of radiation oncology has clearly improved in terms of equipment and utility although there was a shortage of personnel in 2015.
Keywords: structure survey, radiotherapy institution, radiotherapy personnel, radiotherapy equipment
INTRODUCTION
In 1991, the Japanese Society for Radiation Oncology (JASTRO) conducted the first national survey of the structure of radiotherapy institutions in Japan based on their status in 1990, and the results were reported by Tsunemoto et al. [1]. The Japanese structure has gradually changed since a greater number of cancer patients are treated with radiation and public awareness of the importance of radiotherapy has grown. JASTRO has conducted national structure surveys every two years since 1991 [2–24]. The consecutive structural data gathered and published by JASTRO have been useful to gain an understanding of our current position and future direction in Japan. Despite some delays, the updated Japanese national structure survey data of radiation oncology in 2015 is now available.
Fig. 2.
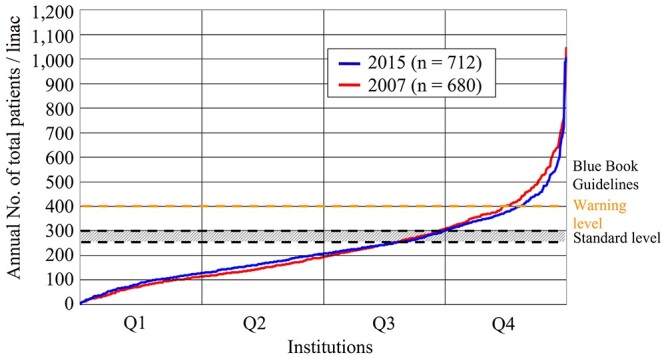
Distribution of annual total (new plus repeat) patient load per linac in radiotherapy institutions. Horizontal axis represents institutions arranged in order of increasing value of annual number of total patients per linac within the institution. Q1: 0–25%, Q2: 26–50%, Q3: 51–75%, Q4: 76–100%.
MATERIALS AND METHODS
From May 2016 to August 2018, a questionnaire regarding the 2015 national structure survey of radiation oncology was conducted that included the number of treatment systems by type, number of personnel by category, and number of patients by type, site and treatment modality. To measure variables over a longer time period, data for the year 2015 were also considered. In total, 737 of 846 active institutions attempted the survey; the response rate was 87.1%.
The current report analyzes these institutional structure data (equipment, personnel, patient load and geographic distribution) based on institutional stratification by the annual number of new patients treated with radiotherapy at each institution. Clinical working hours of each staff member performing radiotherapy were derived from full-time equivalent (FTE; 40 hours per week for radiation oncology work only) data. The Japanese Blue Book Guidelines (JBBG) [25, 26] were used for comparison with the results of this study. These guidelines pertain to the structure of radiation oncology in Japan based on Patterns of Care Study (PCS) [27, 28] data. The standard guidelines were set at 250–300 (warning level, 400) for annual patient load per external beam machine, at 200 (warning level, 300) for annual patient load per FTE radiation oncologist (RO), and at 120 (warning level, 200) for annual patient load per FTE radiotherapy technologist (RTT).
Fig. 3.
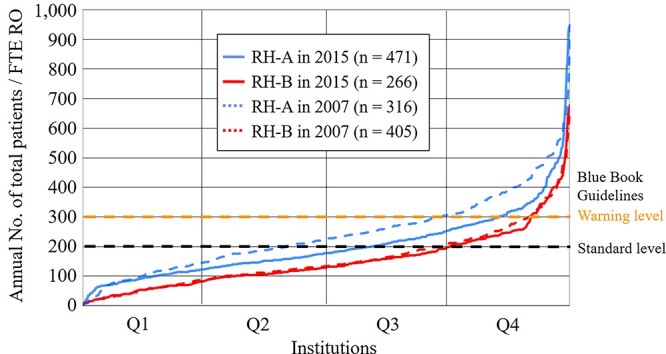
Distribution of annual total (new plus repeat) patient load per FTE RO according to institution categories shown Table 14; all radiotherapy hospitals. Horizontal axis represents institutions arranged in order of increasing value of annual number of total patients per FTE RO within the institution. Q1: 0–25%, Q2: 26–50%, Q3: 51–75%, Q4: 76–100%.
Table 1.
Category of radiotherapy institution
| Institution category | |
|---|---|
| U: | University hospital |
| G: | Cancer center (including national centers) |
| N: | National hospital organization (excluding cancer centers) |
| P: | Public hospital (excluding cancer centers) |
| O: | Red cross hospital, saiseikai hospital, company hospital, public corporation hospital, national health insurance hospital, social insurance hospital, mutual insurance hospital, industrial accident hospital, association hospital and Japan agricultural co-operatives hospital |
| H: | Medical corporation hospital, medical association hospital, private hospital and other hospital |
Furthermore, we analyzed data from the designated cancer care hospital accredited by the Ministry of Health, Labor and Welfare. As on 1 April 2019, Japan had 428 designated cancer care hospitals [29]. A total of 50 institutions did not return the survey; therefore, the structure data for these 378 designated cancer care hospitals were analyzed and compared with the data for all radiotherapy hospitals. The analysis was conducted in two groups: institutions with <1.0 FTE RO and those with ≥1.0 FTE RO.
RESULTS
In this report, all results have been presented in Tables 1–18 and Figs 1–6. We have briefly summarized the Japanese national structure survey of radiation oncology for 2015. The values obtained by dividing the real numbers of new patients (196 002) and total (new plus repeat) patients (235 892) by the response rate were 224990.1 and 270779.7, respectively. In addition, there may be radiotherapy institutions not perceived by JASTRO. Therefore, the estimated number of new patients was approximately 225 000 rounded up 224990.1 to the nearest 1000. In the same way, the estimated number of total patients was approximately 271 000 (Fig. 1).
Fig. 1.
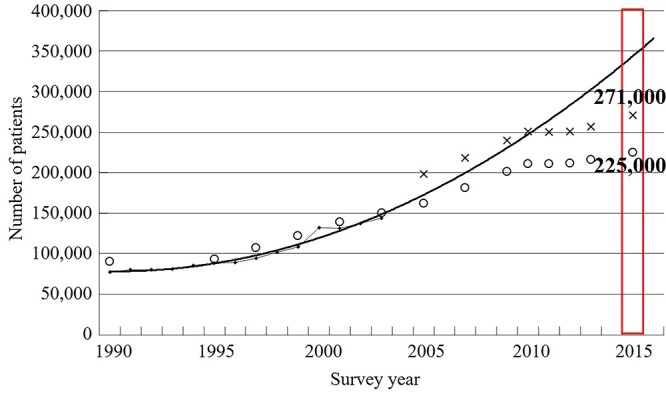
Estimate of increase in demand for radiotherapy in Japan, based on statistical correction of annual change in the number of new patients per year at Patterns of Care Study survey facilities [25]. x and o denote the estimated number of total (new plus repeat) and new patients by the results in structure surveys by the JASTRO.
DISCUSSION
It is necessary to carefully consider that the estimated numbers of new patients and total patients reported also vary widely according to the difference in the calculation methods. In this survey, we had a very high response rate of 87.1%, so the estimated number of new patients and total patients were approximately 225 000 and 271 000 by a simple calculation using the response rate. Teshima et al. were estimated future prediction for the number of new patients with radiotherapy as shown the solid line in Fig. 1 [28]. About the number of new patients, there has been a large divergence between future prediction (the solid line) and JASTRO survey results (the dots: o) since around 2009.
Table 2.
Number of radiotherapy institutions by scale classification and institution category
| Scale category (annual number of new patients) | Institution category | Total | Institution ratio [%] | |||||
|---|---|---|---|---|---|---|---|---|
| U | G | N | P | O | H | |||
| A (≤99) | 5 | 1 | 19 | 45 | 36 | 32 | 138 | 18.7 |
| B (100–199) | 12 | 2 | 19 | 88 | 59 | 62 | 242 | 32.8 |
| C (200–299) | 13 | 2 | 5 | 37 | 45 | 26 | 128 | 17.4 |
| D (300–399) | 20 | 1 | 8 | 21 | 23 | 22 | 95 | 12.9 |
| E (400–499) | 20 | 2 | 2 | 7 | 7 | 6 | 44 | 6.0 |
| F (≥500) | 45 | 17 | 1 | 10 | 4 | 13 | 90 | 12.2 |
| Total | 115 | 25 | 54 | 208 | 174 | 161 | 737 | |
| Institution ratio [%] | 15.6 | 3.4 | 7.3 | 28.2 | 23.6 | 21.8 | 100.0 | |
Fig. 4.
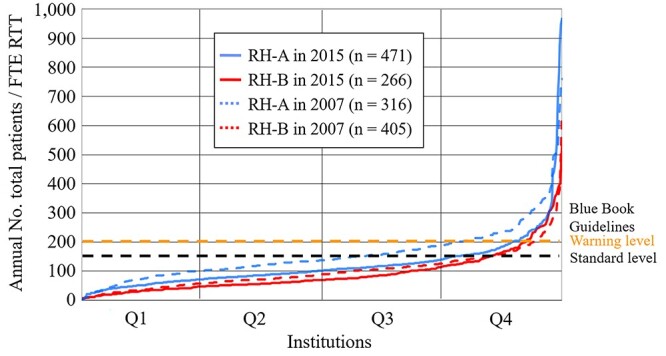
Distribution of annual total (new plus repeat) patient load per FTE RTT according to institution categories shown Table 14; all radiotherapy hospitals. Horizontal axis represents institutions arranged in order of increasing value of annual number of total patients per FTE RTT within the institution. Q1: 0–25%, Q2: 26–50%, Q3: 51–75%, Q4: 76–100%.
Fig. 5.
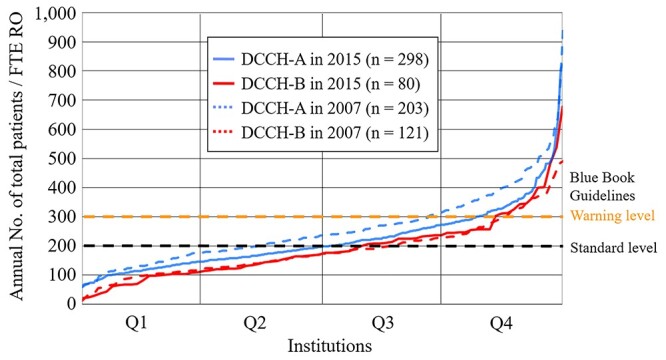
Distribution of annual total (new plus repeat) patient load per FTE RO according to institution categories shown Table 14; designated cancer care hospitals. Horizontal axis represents institutions arranged in order of increasing value of annual number of total patients per FTE RO within the institution. Q1: 0–25%, Q2: 26–50%, Q3: 51–75%, Q4: 76–100%.
Fig. 6.
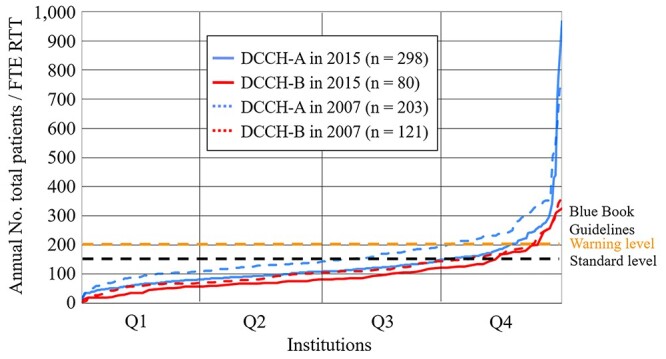
Distribution of annual total (new plus repeat) patient load per FTE RTT according to institution categories shown Table 14; designated cancer care hospitals. Horizontal axis represents institutions arranged in order of increasing value of annual number of total patients per FTE RTT within the institution. Q1: 0–25%, Q2: 26–50%, Q3: 51–75%, Q4: 76–100%.
Table 3.
Annual number of new patients by scale classification and institution category
| Scale category (number of institutions) | Institution category (number of institutions) | Total (737) | Average | |||||
|---|---|---|---|---|---|---|---|---|
| U (115) | G (25) | N (54) | P (208) | O (174) | H (161) | |||
| A (138) | 191 | 36 | 1033 | 2428 | 2431 | 2121 | 8240 | 59.7 |
| B (242) | 1814 | 315 | 2867 | 12 321 | 8732 | 9287 | 35 336 | 146.0 |
| C (128) | 3227 | 465 | 1189 | 8826 | 10 893 | 6324 | 30 924 | 241.6 |
| D (95) | 6792 | 386 | 2693 | 7337 | 7923 | 7598 | 32 729 | 344.5 |
| E (44) | 9143 | 891 | 826 | 3089 | 3098 | 2645 | 19 692 | 447.5 |
| F (90) | 32 849 | 17 522 | 800 | 6080 | 2937 | 8893 | 69 081 | 767.6 |
| Total (737) | 54 016 | 19 615 | 9408 | 40 081 | 36 014 | 36 868 | 1,96 002 | 265.9 |
| Average | 469.7 | 784.6 | 174.2 | 192.7 | 207.0 | 229.0 | 265.9 | |
| Median | 446 | 637 | 141 | 155 | 186.5 | 182 | 195 | |
Table 4.
Annual number of total (new plus repeat) patients by scale classification and institution category
| Scale category (number of institutions) | Institution category (number of institutions) | Total (737) | Average | |||||
|---|---|---|---|---|---|---|---|---|
| U (115) | G (25) | N (54) | P (208) | O (174) | H (161) | |||
| A (138) | 207 | 49 | 1207 | 2731 | 2887 | 2704 | 9785 | 70.9 |
| B (242) | 2076 | 347 | 3475 | 14 202 | 10 066 | 11 760 | 41 926 | 173.2 |
| C (128) | 3709 | 588 | 1353 | 10 923 | 13 107 | 8136 | 37 816 | 295.4 |
| D (95) | 8006 | 496 | 3079 | 8929 | 9489 | 9382 | 39 381 | 414.5 |
| E (44) | 11 400 | 1035 | 1120 | 3773 | 3951 | 3747 | 25 026 | 568.8 |
| F (90) | 38 638 | 21 092 | 828 | 6957 | 3391 | 11 052 | 81 958 | 910.6 |
| Total (737) | 64 036 | 23 607 | 11 062 | 47 515 | 42 891 | 46 781 | 2,35 892 | 320.1 |
| Average | 556.8 | 944.3 | 204.9 | 228.4 | 246.5 | 290.6 | 320.1 | |
| Median | 520 | 790 | 171 | 177.5 | 216.5 | 226 | 227 | |
Table 5.
Number of treatment devices and their functions by scale classification
| Treatment devices and their functions | Scale category (number of institutions) | Total (737) | |||||
|---|---|---|---|---|---|---|---|
| A (138) | B (242) | C (128) | D (95) | E (44) | F (90) | ||
| Linac | 139 | 234 | 142 | 131 | 78 | 212 | 936 |
| with dual energy function | 101 | 188 | 117 | 109 | 70 | 169 | 754 |
| with 3DCRT function (MLC width ≤ 1.0 cm) | 116 | 212 | 137 | 125 | 76 | 201 | 867 |
| with IMRT function | 51 | 126 | 101 | 103 | 66 | 181 | 628 |
| with cone beam CT or CT on rail | 55 | 123 | 98 | 92 | 53 | 144 | 565 |
| with treatment position verification system (x-ray perspective image) | 47 | 100 | 75 | 77 | 47 | 117 | 463 |
| with treatment position verification system (other than those above) | 36 | 71 | 56 | 49 | 41 | 74 | 327 |
| Annual no. patients/linac | 70.4 | 179.2 | 266.3 | 300.6 | 320.8 | 386.6 | 252.0 |
| CyberKnife* | 4 | 7 | 1 | 4 | 2 | 8 | 26 |
| Novalis* | 2 | 3 | 12 | 14 | 7 | 11 | 49 |
| Tomotherapy* | 1 | 14 | 7 | 8 | 1 | 12 | 43 |
| Mobetron* | 0 | 0 | 1 | 0 | 0 | 3 | 4 |
| Particle | 0 | 1 | 0 | 2 | 0 | 11 | 14 |
| Microtoron | 1 | 1 | 1 | 0 | 1 | 1 | 5 |
| Telecobalt (actual use) | 0 (0) | 0 (0) | 1 (0) | 0 (0) | 0 (0) | 0 (0) | 1 (0) |
| Gamma Knife* | 2 | 12 | 8 | 8 | 5 | 8 | 43 |
| Other accelerator | 0 | 0 | 0 | 0 | 0 | 3 | 3 |
| Other external irradiation device | 0 | 0 | 1 | 0 | 0 | 0 | 1 |
| New type 60Co RALS (actual use) | 0 (0) | 3 (3) | 5 (5) | 5 (5) | 3 (3) | 5 (5) | 21 (21) |
| Old type 60Co RALS (actual use) | 0 (0) | 0 (0) | 0 (0) | 0 (0) | 1 (0) | 0 (0) | 1 (0) |
| 192Ir RALS (actual use) | 1 (1) | 3 (3) | 12 (10) | 31 (30) | 20 (20) | 66 (65) | 133 (129) |
| 137Cs RALS (actual use) | 0 (0) | 0 (0) | 0 (0) | 0 (0) | 0 (0) | 0 (0) | 0 (0) |
linac = linear accelerator, 3DCRT = 3D conformal radiotherapy, MLC = multileaf collimator, IMRT = intensity-modulated radiotherapy, CT = computed tomography, Co = cobalt, RALS = remote-controlled after-loading system, Ir = iridium, Cs = Caesium.
Table 6.
Number of treatment planning equipment and accessories by scale classification
| Treatment planning equipment and accessories | Scale category (number of institutions) | Total (737) | |||||
|---|---|---|---|---|---|---|---|
| A (138) | B (242) | C (128) | D (95) | E (44) | F (90) | ||
| X-ray simulator (1 or more*) | 39 (38) | 54 (54) | 19 (19) | 37 (34) | 16 (16) | 59 (54) | 224 (215) |
| CT simulator (1 or more*) | 122 (120) | 232 (220) | 125 (120) | 101 (90) | 48 (43) | 115 (89) | 743 (682) |
| RTP computer (2 or more*) | 195 (30) | 369 (86) | 303 (78) | 328 (75) | 207 (39) | 632 (89) | 2034 (397) |
| X-ray CT (2 or more*) | 256 (87) | 590 (202) | 401 (116) | 353 (86) | 201 (43) | 453 (87) | 2254 (621) |
| for RT only | 57 | 137 | 105 | 82 | 49 | 109 | 539 |
| MRI (2 or more*) | 175 (42) | 375 (128) | 246 (92) | 219 (84) | 124 (41) | 283 (78) | 1422 (465) |
| for RT only | 3 | 4 | 3 | 2 | 1 | 6 | 19 |
| Computer use for RT recording* | 80 | 150 | 75 | 66 | 28 | 60 | 459 |
| Water phantom (2 or more*) | 156 (31) | 299 (67) | 191 (57) | 145 (43) | 74 (19) | 202 (60) | 1067 (277) |
| Film densitometer (2 or more*) | 54 (1) | 125 (2) | 92 (4) | 89 (9) | 44 (3) | 98 (17) | 502 (36) |
| Dosemeter (3 or more*) | 416 (71) | 893 (157) | 595 (102) | 503 (74) | 274 (34) | 755 (82) | 3436 (520) |
*The number of institutions.
CT = computed tomography, RTP = radiotherapy planning, MRI = magnetic resonance imaging, RT = radiotherapy.
Table 7.
Number of personnel and annual number of patients by scale classification
| Scale category (number of institutions) | Total (737) | ||||||
|---|---|---|---|---|---|---|---|
| A (138) | B (242) | C (128) | D (95) | E (44) | F (90) | ||
| Scale (annual no. of new patients) | ≤99 | 100–199 | 200–299 | 300–399 | 400–499 | ≥500 | |
| Institution ratio [%] | 18.7% | 32.8% | 17.4% | 12.9% | 6.0% | 12.2% | 100% |
| New patients | 8240 | 35 336 | 30 924 | 32 729 | 19 692 | 69 081 | 1,96 002 |
| New patients/institution | 59.7 | 146.0 | 241.6 | 344.5 | 447.5 | 767.6 | 265.9 |
| Total patients | 9785 | 41 926 | 37 816 | 39 381 | 25 026 | 81 958 | 2,35 892 |
| Total patients/institution | 70.9 | 173.2 | 295.4 | 414.5 | 568.8 | 910.6 | 320.1 |
| Beds | 41 929 | 95 285 | 60 735 | 53 671 | 29 398 | 64 826 | 3,45 844 |
| Institutions with RT beds (%) | 22 (15.9) | 39 (16.1) | 27 (21.1) | 35 (36.8) | 20 (45.5) | 54 (60) | 197 (26.7) |
| RT beds | 96.0 | 185.5 | 156.0 | 158.5 | 156.0 | 703.0 | 1455.0 |
| RT beds/total beds [%] | 0.2% | 0.2% | 0.3% | 0.3% | 0.5% | 1.1% | 0.4% |
| RT beds/institution | 0.7 | 0.8 | 1.2 | 1.7 | 3.5 | 7.8 | 2.0 |
| RT beds/institution with RT beds | 4.4 | 4.8 | 5.8 | 4.5 | 7.8 | 13.0 | 7.4 |
| JRS-certified institutions (%) | 2 (1.4) | 17 (7) | 39 (30.5) | 43 (45.3) | 32 (72.7) | 75 (83.3) | 208 (28.2) |
| JRS-cooperation institutions (%) | 45 (32.6) | 130 (53.7) | 62 (48.4) | 39 (41.1) | 10 (22.7) | 24 (26.7) | 310 (42.1) |
| JASTRO-certified institutions (%) | 4 (2.9) | 32 (13.2) | 40 (31.3) | 56 (58.9) | 30 (68.2) | 76 (84.4) | 238 (32.3) |
| JRS membership (full time) | 54 | 183 | 164 | 176 | 124 | 470 | 1171 |
| JASTRO membership (full time) | 50 | 173 | 163 | 172 | 114 | 468 | 1140 |
| JRS/JASTRO-certified ROs (full time) | 35 | 147 | 139 | 139 | 86 | 353 | 899 |
| Institutions with full time RO (%) | 52 (37.7) | 160 (66.1) | 113 (88.3) | 89 (93.7) | 44 (100) | 90 (100) | 548 (74.4) |
| ROs (full time) | 69 | 203 | 174 | 182 | 130 | 474 | 1232 |
| ROs (full time)/institution | 0.5 | 0.8 | 1.4 | 1.9 | 3.0 | 5.3 | 1.7 |
| FTE RO (full time) | 24.4 | 145.0 | 125.3 | 121.9 | 103.1 | 359.4 | 878.9 |
| FTE RO (full time)/institution | 0.34 | 0.68 | 1.18 | 1.69 | 2.31 | 4.46 | 1.39 |
| ROs (part time) | 153 | 260 | 115 | 90 | 36 | 144 | 798 |
| ROs (part time)/institution | 1.11 | 1.07 | 0.90 | 0.95 | 0.82 | 1.60 | 1.08 |
| FTE RO (part time) | 25.1 | 53.7 | 20.5 | 18.4 | 9.0 | 60.5 | 187.1 |
| FTE RO (part time)/institution | 0.2 | 0.2 | 0.2 | 0.2 | 0.2 | 0.7 | 0.3 |
| FTE RO (full plus part time) | 71.5 | 218.3 | 172.2 | 179.1 | 110.7 | 462.2 | 1213.9 |
| FTE RO (full plus part time)/institution | 0.52 | 0.90 | 1.34 | 1.89 | 2.52 | 5.14 | 1.65 |
| Radiologists (full time) | 163.0 | 445.4 | 402.8 | 425.0 | 328.0 | 828.0 | 2592.2 |
| Radiologists (part time) | 144.2 | 433.5 | 212.2 | 177.2 | 96.0 | 242.0 | 1305.1 |
| Radiologists (full time)/institution | 1.2 | 1.8 | 3.1 | 4.5 | 7.5 | 9.2 | 3.5 |
| RTTs (full time)* | 422 | 900 | 604 | 573 | 307 | 876 | 3682 |
| FTE RTT | 249.2 | 528.2 | 342.3 | 385.1 | 208.4 | 681.2 | 2394.2 |
| Medical physicists (full-time)* | 34 | 107 | 108 | 81 | 58 | 167 | 555 |
| FTE Medical physicist | 16.9 | 46.5 | 51.4 | 44.0 | 28.0 | 109.1 | 295.7 |
| RT quality manager (full-time)* | 50 | 167 | 112 | 106 | 64 | 113 | 612 |
| FTE RT quality manager | 13.6 | 58.6 | 40.6 | 41.2 | 19.6 | 36.7 | 210.2 |
| Dosimetrists (full-time)* | 13 | 33 | 30 | 26 | 17 | 60 | 179 |
| FTE Dosimetrist | 3.0 | 4.6 | 7.0 | 5.7 | 4.3 | 14.1 | 38.6 |
| Craftworkers (full-time)* | 29 | 65 | 68 | 56 | 33 | 84 | 335 |
| FTE Craftworker | 4.6 | 8.0 | 13.0 | 5.4 | 3.8 | 13.9 | 48.7 |
| Nurses (full time) | 118 | 371 | 270 | 224 | 131 | 333 | 1447 |
| FTE Nurse | 59.2 | 168.2 | 154.54 | 153.25 | 82.21 | 288.7 | 906.1 |
| Nursing assistants | 8 | 15.3 | 10.9 | 12.4 | 12.3 | 31.6 | 90.5 |
| Clerks | 21.9 | 79.2 | 89.6 | 105.6 | 51.2 | 149.3 | 496.8 |
*Overlap is included in the total number of each staff type (radiotherapy technologist, medical physicist, radiotherapy quality manager, dosimetrist and craftworker).
RT = radiotherapy, JRS = Japan Radiological Society, RO = radiation oncologist, JASTRO = Japanese Society for Radiation Oncology, FTE = full-time equivalent, RTT = radiotherapy technologist.
Table 8.
Population, number of patients, institutions and patient load according to prefecture
| Prefecture | Population (×103) [31] | Institutions | New patients | New patients/ institution | Total patients | Total patients/ institution |
|---|---|---|---|---|---|---|
| Hokkaido | 5382 | 29 | 8202 | 282.8 | 10 538 | 363.4 |
| Aomori | 1308 | 12 | 2404 | 200.3 | 2704 | 225.3 |
| Iwate | 1280 | 11 | 2298 | 208.9 | 2768 | 251.6 |
| Miyagi | 2334 | 14 | 4267 | 304.8 | 5290 | 377.9 |
| Akita | 1023 | 11 | 2061 | 187.4 | 2513 | 228.5 |
| Yamagata | 1124 | 7 | 1502 | 214.6 | 1682 | 240.3 |
| Fukushima | 1914 | 11 | 3051 | 277.4 | 3472 | 315.6 |
| Ibaraki | 2917 | 15 | 3498 | 233.2 | 4074 | 271.6 |
| Tochigi | 1974 | 9 | 2711 | 301.2 | 3334 | 370.4 |
| Gunma | 1973 | 12 | 3871 | 322.6 | 4333 | 361.1 |
| Saitama | 7267 | 23 | 7319 | 318.2 | 8668 | 376.9 |
| Chiba | 6223 | 27 | 8950 | 331.5 | 10 719 | 397.0 |
| Tokyo | 13 515 | 78 | 26 764 | 343.1 | 32 445 | 416.0 |
| Kanagawa | 9126 | 41 | 13 436 | 327.7 | 15 474 | 377.4 |
| Niigata | 2304 | 12 | 3064 | 255.3 | 3798 | 316.5 |
| Toyama | 1066 | 10 | 1779 | 177.9 | 2115 | 211.5 |
| Ishikawa | 1154 | 8 | 1746 | 218.3 | 2297 | 287.1 |
| Fukui | 787 | 6 | 1099 | 183.2 | 1327 | 221.2 |
| Yamanashi | 835 | 4 | 1186 | 296.5 | 1438 | 359.5 |
| Nagano | 2099 | 10 | 2755 | 275.5 | 3425 | 342.5 |
| Gifu | 2032 | 14 | 2860 | 204.3 | 4071 | 290.8 |
| Shizuoka | 3700 | 25 | 6334 | 253.4 | 8103 | 324.1 |
| Aichi | 7483 | 35 | 10 542 | 301.2 | 12 811 | 366.0 |
| Mie | 1816 | 10 | 1499 | 149.9 | 1816 | 181.6 |
| Shiga | 1413 | 12 | 2196 | 183.0 | 2662 | 221.8 |
| Kyoto | 2610 | 16 | 4230 | 264.4 | 5102 | 318.9 |
| Osaka | 8839 | 60 | 15 490 | 258.2 | 17 979 | 299.7 |
| Hyogo | 5535 | 35 | 9075 | 259.3 | 10 741 | 306.9 |
| Nara | 1364 | 7 | 2074 | 296.3 | 2567 | 366.7 |
| Wakayama | 964 | 6 | 1202 | 200.3 | 1522 | 253.7 |
| Tottori | 573 | 3 | 651 | 217.0 | 747 | 249.0 |
| Shimane | 694 | 5 | 1059 | 211.8 | 1153 | 230.6 |
| Okayama | 1922 | 11 | 2844 | 258.5 | 3414 | 310.4 |
| Hiroshima | 2844 | 21 | 4784 | 227.8 | 6129 | 291.9 |
| Yamaguchi | 1405 | 10 | 1640 | 164.0 | 1909 | 190.9 |
| Tokushima | 756 | 6 | 1265 | 210.8 | 1592 | 265.3 |
| Kagawa | 976 | 8 | 1405 | 175.6 | 1619 | 202.4 |
| Ehime | 1385 | 8 | 1980 | 247.5 | 2269 | 283.6 |
| Kochi | 728 | 5 | 978 | 195.6 | 1190 | 238.0 |
| Fukuoka | 5102 | 28 | 8786 | 313.8 | 10 585 | 378.0 |
| Saga | 833 | 6 | 1505 | 250.8 | 1659 | 276.5 |
| Nagasaki | 1377 | 9 | 2157 | 239.7 | 2646 | 294.0 |
| Kumamoto | 1786 | 12 | 2542 | 211.8 | 3188 | 265.7 |
| Oita | 1166 | 11 | 1736 | 157.8 | 2156 | 196.0 |
| Miyazaki | 1104 | 7 | 1606 | 229.4 | 1765 | 252.1 |
| Kagoshima | 1648 | 11 | 2235 | 203.2 | 2404 | 218.5 |
| Okinawa | 1434 | 6 | 1364 | 227.3 | 1679 | 279.8 |
| Total | 1,27 095 | 737 | 1,96 002 | 265.9 | 2,35 892 | 320.1 |
Table 9.
Number of total patients, radiation oncologists and patient load according to prefecture
| Prefecture | Total patients | JRS/JASTRO-certified RO | FTE RO | Total patients/FTE RO |
|---|---|---|---|---|
| Hokkaido | 10 538 | 40 | 52.8 | 199.6 |
| Aomori | 2704 | 10 | 12.7 | 212.9 |
| Iwate | 2768 | 10 | 13.6 | 203.5 |
| Miyagi | 5290 | 13 | 23.7 | 223.4 |
| Akita | 2513 | 3 | 8.4 | 301.0 |
| Yamagata | 1682 | 6 | 8.1 | 207.7 |
| Fukushima | 3472 | 17 | 25.4 | 137.0 |
| Ibaraki | 4074 | 12 | 23.3 | 175.2 |
| Tochigi | 3334 | 12 | 15.1 | 220.8 |
| Gunma | 4333 | 23 | 31.1 | 139.3 |
| Saitama | 8668 | 27 | 31.0 | 279.6 |
| Chiba | 10 719 | 46 | 55.5 | 193.1 |
| Tokyo | 32 445 | 100 | 151.0 | 214.9 |
| Kanagawa | 15 474 | 56 | 75.9 | 203.9 |
| Niigata | 3798 | 17 | 20.2 | 188.0 |
| Toyama | 2115 | 6 | 10.3 | 205.3 |
| Ishikawa | 2297 | 8 | 12.0 | 191.4 |
| Fukui | 1327 | 13 | 13.9 | 95.5 |
| Yamanashi | 1438 | 9 | 9.7 | 148.2 |
| Nagano | 3425 | 12 | 14.5 | 236.2 |
| Gifu | 4071 | 9 | 17.3 | 235.0 |
| Shizuoka | 8103 | 24 | 31.2 | 259.7 |
| Aichi | 12 811 | 50 | 69.3 | 185.0 |
| Mie | 1816 | 9 | 11.7 | 155.2 |
| Shiga | 2662 | 9 | 14.1 | 188.8 |
| Kyoto | 5102 | 26 | 35.8 | 142.5 |
| Osaka | 17 979 | 76 | 104.1 | 172.7 |
| Hyogo | 10 741 | 49 | 64.2 | 167.3 |
| Nara | 2567 | 14 | 16.1 | 159.4 |
| Wakayama | 1522 | 6 | 8.7 | 174.9 |
| Tottori | 747 | 5 | 4.2 | 177.9 |
| Shimane | 1153 | 6 | 10.2 | 113.0 |
| Okayama | 3414 | 16 | 21.0 | 163.0 |
| Hiroshima | 6129 | 24 | 28.5 | 215.1 |
| Yamaguchi | 1909 | 9 | 11.9 | 160.4 |
| Tokushima | 1592 | 7 | 6.6 | 241.2 |
| Kagawa | 1619 | 9 | 10.8 | 149.9 |
| Ehime | 2269 | 9 | 12.0 | 189.1 |
| Kochi | 1190 | 4 | 4.2 | 283.3 |
| Fukuoka | 10 585 | 36 | 46.9 | 225.7 |
| Saga | 1659 | 10 | 14.2 | 116.8 |
| Nagasaki | 2646 | 10 | 10.4 | 254.4 |
| Kumamoto | 3188 | 15 | 14.8 | 215.4 |
| Oita | 2156 | 5 | 8.0 | 269.5 |
| Miyazaki | 1765 | 4 | 5.3 | 333.0 |
| Kagoshima | 2404 | 11 | 12.0 | 200.3 |
| Okinawa | 1679 | 7 | 12.4 | 135.4 |
| Total | 2,35 892 | 899 | 1213.9 | 194.3 |
JRS = Japan Radiological Society, JASTRO = Japanese Society for Radiation Oncology, RO = radiation oncologist, FTE = full-time equivalent
Table 10.
Number of total patients, staff and patient load according to prefecture
| Prefecture | Total patients | FTE RTT | Total patients/FTE RTT | FTE MP | FTE RTQM |
|---|---|---|---|---|---|
| Hokkaido | 10 538 | 76.7 | 137.5 | 14.5 | 7.4 |
| Aomori | 2704 | 30.2 | 89.5 | 4.0 | 3.7 |
| Iwate | 2768 | 35.8 | 77.3 | 5.0 | 1.8 |
| Miyagi | 5290 | 50.6 | 104.5 | 7.5 | 3.1 |
| Akita | 2513 | 25.4 | 98.9 | 1.1 | 3.0 |
| Yamagata | 1682 | 22.3 | 75.4 | 1.1 | 1.1 |
| Fukushima | 3472 | 36.2 | 96.0 | 4.4 | 1.7 |
| Ibaraki | 4074 | 53.5 | 76.1 | 5.8 | 3.7 |
| Tochigi | 3334 | 33.3 | 100.1 | 2.7 | 2.7 |
| Gunma | 4333 | 54.5 | 79.5 | 7.5 | 3.0 |
| Saitama | 8668 | 73.4 | 118.1 | 7.4 | 6.0 |
| Chiba | 10 719 | 94.6 | 113.4 | 19.0 | 4.4 |
| Tokyo | 32 445 | 281.6 | 115.2 | 45.1 | 17.5 |
| Kanagawa | 15 474 | 148.5 | 104.2 | 16.6 | 9.2 |
| Niigata | 3798 | 45.3 | 83.8 | 5.2 | 2.9 |
| Toyama | 2115 | 23.3 | 91.0 | 4.3 | 3.3 |
| Ishikawa | 2297 | 20.5 | 112.0 | 2.0 | 2.3 |
| Fukui | 1327 | 24.7 | 53.8 | 3.1 | 2.0 |
| Yamanashi | 1438 | 9.7 | 148.2 | 0.4 | 2.6 |
| Nagano | 3425 | 34.9 | 98.1 | 4.3 | 2.5 |
| Gifu | 4071 | 41.1 | 99.2 | 2.3 | 4.7 |
| Shizuoka | 8103 | 92.3 | 87.8 | 11.5 | 8.4 |
| Aichi | 12 811 | 124.8 | 102.7 | 16.6 | 14.5 |
| Mie | 1816 | 22.9 | 79.5 | 2.8 | 3.9 |
| Shiga | 2662 | 34.3 | 77.6 | 3.9 | 5.4 |
| Kyoto | 5102 | 61.2 | 83.4 | 11.0 | 3.9 |
| Osaka | 17 979 | 191.1 | 94.1 | 28.2 | 18.4 |
| Hyogo | 10 741 | 117.8 | 91.2 | 13.7 | 5.2 |
| Nara | 2567 | 25.7 | 99.9 | 2.8 | 4.5 |
| Wakayama | 1522 | 20.9 | 72.8 | 0.0 | 2.4 |
| Tottori | 747 | 8.6 | 86.9 | 1.0 | 2.0 |
| Shimane | 1153 | 12.1 | 95.3 | 1.2 | 2.6 |
| Okayama | 3414 | 39.6 | 86.2 | 3.3 | 3.4 |
| Hiroshima | 6129 | 62.3 | 98.4 | 10.3 | 7.6 |
| Yamaguchi | 1909 | 22.8 | 83.7 | 0.7 | 2.3 |
| Tokushima | 1592 | 19.1 | 83.4 | 0.3 | 0.6 |
| Kagawa | 1619 | 22.0 | 73.6 | 1.7 | 0.9 |
| Ehime | 2269 | 24.1 | 94.3 | 2.6 | 4.0 |
| Kochi | 1190 | 9.6 | 124.0 | 2.1 | 1.5 |
| Fukuoka | 10 585 | 97.1 | 109.1 | 7.1 | 11.6 |
| Saga | 1659 | 22.4 | 74.1 | 0.6 | 2.3 |
| Nagasaki | 2646 | 22.0 | 120.3 | 3.2 | 3.5 |
| Kumamoto | 3188 | 32.2 | 99.0 | 3.1 | 5.2 |
| Oita | 2156 | 22.6 | 95.4 | 1.6 | 3.1 |
| Miyazaki | 1765 | 15.2 | 116.1 | 0.8 | 1.3 |
| Kagoshima | 2404 | 38.0 | 63.3 | 1.2 | 3.2 |
| Okinawa | 1679 | 18.0 | 93.4 | 1.8 | 0.4 |
| Total | 2,35 892 | 2394.2 | 98.5 | 295.7 | 210.2 |
FTE = full-time equivalent, RTT = radiotherapy technologist, MP = medical physicist, RTQM = radiotherapy quality manager.
Table 11.
Number of institutions and patients with special radiotherapy by scale classification
| Specific therapy | 2015 | 2013 | ||||||
|---|---|---|---|---|---|---|---|---|
| A (138) | B (242) | C (128) | D (95) | E (44) | F (90) | Total (737) | Total (717) | |
| Intracavitary radiotherapy | ||||||||
| Treatment institutions | 0 | 6 | 15 | 34 | 23 | 69 | 147 | 155 |
| Patients | 0 | 48 | 186 | 473 | 391 | 2019 | 3117 | 3128 |
| Interstitial radiotherapy | ||||||||
| Treatment institutions | 3 | 9 | 16 | 20 | 19 | 51 | 118 | 125 |
| Patients | 15 | 260 | 330 | 515 | 608 | 2152 | 3880 | 3958 |
| 125I seed implantation therapy for prostate | ||||||||
| Treatment institutions | 2 | 7 | 14 | 14 | 17 | 43 | 97 | 107 |
| Patients | 11 | 203 | 319 | 331 | 550 | 1608 | 3022 | 3292 |
| Radioactive iodine therapy for thyroid cancer | ||||||||
| Treatment institutions | 1 | 7 | 9 | 16 | 16 | 25 | 74 | 70 |
| Patients | 205 | 97 | 168 | 677 | 432 | 1184 | 2763 | 2332 |
| Total body radiotherapy | ||||||||
| Treatment institutions | 9 | 17 | 29 | 39 | 23 | 63 | 180 | 174 |
| Patients | 91 | 115 | 280 | 366 | 279 | 1156 | 2287 | 2327 |
| Intraoperative radiotherapy | ||||||||
| Treatment institutions | 0 | 1 | 0 | 1 | 3 | 8 | 13 | 16 |
| Patients | 0 | 1 | 0 | 2 | 5 | 41 | 49 | 83 |
| Stereotactic brain radiotherapy | ||||||||
| Treatment institutions | 16 | 57 | 48 | 58 | 26 | 61 | 266 | 251 |
| Patients | 269 | 2814 | 2556 | 3981 | 2180 | 3110 | 14 910 | 15 828 |
| Stereotactic body radiotherapy | ||||||||
| Treatment institutions | 14 | 62 | 71 | 72 | 31 | 79 | 329 | 284 |
| Patients | 240 | 663 | 1810 | 982 | 952 | 2457 | 7104 | 5023 |
| IMRT | ||||||||
| Treatment institutions | 12 | 41 | 47 | 61 | 36 | 80 | 277 | 219 |
| Patients | 216 | 2194 | 3563 | 3890 | 2619 | 9686 | 22 168 | 15 119 |
| Thermoradiotherapy | ||||||||
| Treatment institutions | 0 | 5 | 3 | 2 | 3 | 6 | 19 | 22 |
| Patients | 0 | 45 | 19 | 62 | 86 | 298 | 510 | 366 |
| 90Sr radiotherapy for pterygia | ||||||||
| Treatment institutions | 0 | 0 | 1 | 1 | 1 | 1 | 4 | 7 |
| Patients | 0 | 0 | 3 | 4 | 1 | 7 | 15 | 47 |
| Internal 89Sr radiotherapy | ||||||||
| Treatment institutions | 5 | 27 | 26 | 26 | 26 | 39 | 149 | 179 |
| Patients | 23 | 102 | 114 | 97 | 114 | 212 | 662 | 863 |
| Internal 90Y radiotherapy | ||||||||
| Treatment institutions | 0 | 3 | 4 | 2 | 5 | 10 | 24 | 30 |
| Patients | 0 | 8 | 6 | 3 | 22 | 28 | 67 | 118 |
I = iodine, IMRT = intensity-modulated radiotherapy, Sr = strontium, Y = yttrium.
Table 12.
Annual number of new patients by disease site*
| Primary site | n | % |
|---|---|---|
| Cerebrospinal | 6837 | 3.8 |
| Head and neck (including thyroid) | 15 932 | 8.8 |
| Esophagus | 9232 | 5.1 |
| Lung, trachea, and mediastinum | 34 540 | 19.1 |
| Lung | 31 655 | 17.5 |
| Breast | 42 100 | 23.3 |
| Liver, biliary tract, pancreas | 7727 | 4.3 |
| Gastric, small intestine, colorectal | 9492 | 5.2 |
| Gynecologic | 8531 | 4.7 |
| Urogenital | 29 688 | 16.4 |
| Prostate | 23 742 | 13.1 |
| Hematopoietic and lymphatic | 8184 | 4.5 |
| Skin, bone, and soft tissue | 3652 | 2.0 |
| Other (malignant) | 2257 | 1.2 |
| Benign disease | 2644 | 1.5 |
| Pediatric ≤15 years (included in totals above) | 736 | 0.4 |
| Pediatric 16–19 years (included in totals above) | 240 | 0.1 |
| Total | 180 816 | 100.0 |
*Total number of new patients in Table 3 differ from these data because no data on primary sites were reported by some institutions.
Table 13.
Annual number of total patients (new plus repeat) treated for any brain metastasis and bone metastasis by scale classification
| Metastasis | Scale category (number of institutions) | Total (737) | ||||||||||||
|---|---|---|---|---|---|---|---|---|---|---|---|---|---|---|
| A (138) | B (242) | C (128) | D (95) | E (44) | F (90) | |||||||||
| n | % | n | % | n | % | n | % | n | % | n | % | n | % | |
| Brain | 601 | 6.1 | 3897 | 9.3 | 3716 | 9.8 | 4563 | 11.6 | 2537 | 10.1 | 6223 | 7.6 | 21 537 | 9.1 |
| Bone | 1643 | 16.8 | 5705 | 13.6 | 4980 | 13.2 | 4933 | 12.5 | 2896 | 11.6 | 9346 | 11.4 | 29 503 | 12.5 |
Table 14.
Classification of institutions by number of FTE radiation oncologists in all radiotherapy institutions and designated cancer care hospitals
| Institution category | Description | Number of Institutions |
|---|---|---|
| RH-A | All radiotherapy hospitals (FTE RO ≥ 1.0) | 471 |
| RH-B | All radiotherapy hospitals (FTE RO < 1.0) | 266 |
| Total | 737 | |
| DCCH-A | Designated cancer care hospitals (FTE RO ≥ 1.0) | 298 |
| DCCH-B | Designated cancer care hospitals (FTE RO < 1.0) | 80 |
| Total | 378 |
FTE = full-time equivalent, RO = radiation oncologist
Table 15.
Annual numbers of patients receiving radiotherapy, numbers of linacs, numbers of staff, patient load per linac and patient load per personnel according to institution categories shown Table 14; all radiotherapy hospitals
| RH-A (471) | RH-B (266) | Total (737) | ||||
|---|---|---|---|---|---|---|
| Average per hospital | Total number | Average per hospital | Total number | Average per hospital | Total number | |
| Total patient | 415.3 | 1,95 584 | 151.5 | 40 308 | 320.1 | 2,35 892 |
| New patient | 344.1 | 1,62 064 | 127.6 | 33 938 | 265.9 | 1,96 002 |
| Linac | 1.5 | 686 | 0.9 | 250 | 1.3 | 936 |
| Annual No. of total patients/linac | 285.1 | 161.2 | 252.0 | |||
| Annual No. of new patients/linac | 236.2 | 135.8 | 209.4 | |||
| FTE RO | 2.4 | 1112.0 | 0.4 | 101.9 | 1.6 | 1213.9 |
| JRS/JASTRO-certified RO (full time) | 1.8 | 835 | 0.2 | 64 | 1.2 | 899 |
| Annual No. of total patients/FTE RO | 175.9 | 395.6 | 194.3 | |||
| Annual No. of new patients/FTE RO | 145.7 | 333.1 | 161.5 | |||
| FTE RT technologist | 4.0 | 1894.2 | 1.9 | 500.1 | 3.2 | 2394.2 |
| Annual No. of total patients/FTE RTT | 103.3 | 80.6 | 98.5 | |||
| Annual No. of new patients/FTE RTT | 85.6 | 67.9 | 81.9 | |||
| FTE RT technologist/linac | 2.8 | 2.0 | 2.6 | |||
| FTE medical physicist | 0.55 | 259.7 | 0.14 | 36.0 | 0.40 | 295.7 |
| Annual No. of total patients/FTE MP | 753.0 | 1119.4 | 797.6 | |||
| Annual No. of new patients/FTE MP | 624.0 | 942.5 | 662.8 | |||
| FTE RT quality manager | 0.37 | 173.8 | 0.14 | 36.4 | 0.29 | 210.2 |
| Annual No. of total patients/FTE RTQM | 1125.7 | 1107.4 | 1122.5 | |||
| Annual No. of new patients/FTE RTQM | 932.7 | 932.4 | 932.7 | |||
| FTE RT quality manager/linac | 0.25 | 0.15 | 0.22 | |||
linac = linear accelerator, FTE = full-time equivalent, RO = radiation oncologist, JRS = Japan Radiological Society, JASTRO = Japanese Society for Radiation Oncology, RTT = radiotherapy technologist, MP = medical physicist, RTQM = radiotherapy quality manager.
Table 16.
Annual numbers of patients receiving radiotherapy, numbers of linacs, numbers of staffs, patient load per linac and patient load per personnel according to institution categories shown Table 14; designated cancer care hospitals
| DCCH-A (298) | DCCH-B (80) | Total (378) | ||||
|---|---|---|---|---|---|---|
| Average per hospital | Total number | Average per hospital | Total number | Average per hospital | Total number | |
| Total patient | 499.7 | 1,48 904 | 191.1 | 15 284 | 434.4 | 1,64 188 |
| New patient | 415.1 | 1,23 710 | 164.6 | 13 164 | 362.1 | 1,36 874 |
| Linac | 1.7 | 495 | 1.0 | 81 | 1.5 | 576 |
| Annual No. of total patients/linac | 300.8 | 188.7 | 285.0 | |||
| Annual No. of new patients/linac | 249.9 | 162.5 | 237.6 | |||
| FTE RO | 2.7 | 793.4 | 0.5 | 40.6 | 2.2 | 834.0 |
| JRS/JASTRO-certified RO (full time) | 2.1 | 613 | 0.4 | 29 | 1.7 | 642 |
| Annual No. of total patients/FTE RO | 187.7 | 376.6 | 196.9 | |||
| Annual No. of new patients/FTE RO | 155.9 | 324.4 | 164.1 | |||
| FTE RT technologist | 4.6 | 1361.5 | 2.2 | 176.9 | 4.1 | 1538.3 |
| Annual No. of total patients/FTE RTT | 109.4 | 86.4 | 106.7 | |||
| Annual No. of new patients/FTE RTT | 90.9 | 74.4 | 89.0 | |||
| FTE RT technologist/linac | 2.8 | 2.2 | 2.7 | |||
| FTE medical physicist | 0.65 | 192.5 | 0.21 | 16.9 | 0.55 | 209.3 |
| Annual No. of total patients/FTE MP | 773.7 | 906.5 | 784.4 | |||
| Annual No. of new patients/FTE MP | 642.8 | 780.8 | 653.9 | |||
| FTE RT quality manager | 0.42 | 125.5 | 0.20 | 16.3 | 0.38 | 141.8 |
| Annual No. of total patients/FTE RTQM | 1186.5 | 937.7 | 1157.9 | |||
| Annual No. of new patients/FTE RTQM | 985.7 | 807.6 | 965.3 | |||
| FTE RT quality manager/linac | 0.25 | 0.20 | 0.25 | |||
linac = linear accelerator, FTE = full-time equivalent, RO = radiation oncologist, JRS = Japan Radiological Society, JASTRO = Japanese Society for Radiation Oncology, RTT = radiotherapy technologist, MP = medical physicist, RTQM = radiotherapy quality manager.
Table 17.
Number of items of equipment and their functions according to institution categories shown Table 14
| RH-A (n = 471) | RH-B (n = 266) | Total (n = 737) | ||||
|---|---|---|---|---|---|---|
| n | % | n | % | n | % | |
| Linac | 686 | 98.5 | 250 | 93.2 | 936 | 96.6 |
| with dual energy function | 557 | 86.2 | 197 | 74.1 | 754 | 81.8 |
| with 3DCRT function (MLC width ≤ 1.0 cm) | 648 | 94.5 | 219 | 82.0 | 867 | 90.0 |
| with IMRT function | 521 | 76.6 | 107 | 40.2 | 628 | 63.5 |
| with cone beam CT or CT on rail | 449 | 71.1 | 116 | 43.6 | 565 | 61.2 |
| with treatment position verification system (x-ray perspective image) | 368 | 59.2 | 95 | 35.7 | 463 | 50.7 |
| with treatment position verification system (other than those above) | 253 | 43.9 | 74 | 27.8 | 327 | 38.1 |
| CT simulator | 499 | 94.7 | 244 | 88.7 | 743 | 92.5 |
| DCCH-A (n = 298) | DCCH-B (n = 80) | Total (n = 378) | ||||
| n | % | n | % | n | % | |
| Linac | 495 | 100.0 | 81 | 100.0 | 576 | 100.0 |
| with dual energy function | 413 | 92.3 | 70 | 87.5 | 483 | 91.3 |
| with 3DCRT function (MLC width ≤ 1.0 cm) | 476 | 98.0 | 76 | 93.8 | 552 | 97.1 |
| with IMRT function | 388 | 82.6 | 42 | 52.5 | 430 | 76.2 |
| with cone beam CT or CT on rail | 336 | 78.2 | 41 | 51.3 | 377 | 72.5 |
| with treatment position verification system (x-ray perspective image) | 278 | 66.4 | 33 | 41.3 | 311 | 61.1 |
| with treatment position verification system (other than those above) | 190 | 49.0 | 25 | 31.3 | 215 | 45.2 |
| CT simulator | 327 | 96.6 | 78 | 95.0 | 405 | 96.3 |
linac = linear accelerator, 3DCRT = 3D conformal radiotherapy, MLC = multileaf collimator, IMRT = intensity-modulated radiotherapy, CT = computed tomography.
Table 18.
Number of radiotherapy institutions, treatment devices, patient load and personnel: trend 1990–2015
| Survey year | |||||||||||||||
|---|---|---|---|---|---|---|---|---|---|---|---|---|---|---|---|
| 1990 | 1993 | 1995 | 1997 | 1999 | 2001 | 2003 | 2005 | 2007 | 2009 | 2010 | 2011 | 2012 | 2013 | 2015 | |
| Institutions | 378 | 629 | 504 | 568 | 636 | 603 | 726 | 712 | 721 | 700 | 705 | 694 | 709 | 717 | 737 |
| Response rate | 48.5% | 88.3% | 73.9% | 78.6% | 86.3% | 85.3% | 100% | 96.9% | 94.2% | 90.9% | 90.4% | 88.2% | 90.0% | 89.8% | 87.1% |
| New patients | 62 829 | — | 71 696 | 84 379 | 1,07150 | 1,18 016 | 1,49 793 | 1,56 318 | 1,70 229 | 1,82 390 | 1,90 322 | 1,85 455 | 1,90 910 | 1,93 864 | 1,96 002 |
| Total patients | — | — | — | — | — | — | — | 1,91 173 | 2,05087 | 2,17 829 | 2,26 851 | 2,20 092 | 2,25 818 | 2,30 747 | 2,35 892 |
| Average of new patients | 166 | — | 142 | 149 | 168 | 196 | 206 | 220 | 236 | 261 | 270 | 267 | 269 | 270 | 266 |
| Treatment devices (actual use) | |||||||||||||||
| Linac | 311 | 508 | 407 | 475 | 626 | 626 | 744 | 765 | 807 | 816 | 829 | 836 | 864 | 880 | 936 |
| Telecobalt | 170 | 213 | 127 | 98 | 83 | 45 | 42 | 11 | 15 | 11 | 9 | 3 | 0 | 0 | 0 |
| 192Ir RALS | — | — | 29 | 50 | 73 | 93 | 117 | 119 | 123 | 130 | 131 | 125 | 130 | 128 | 129 |
| Full time ROs | 547 | 748 | 821 | 889 | 925 | 878 | 921 | 1003 | 1007 | 1085 | 1123 | 1102 | 1122 | 1174 | 1232 |
| FTE RO | — | — | — | — | — | — | — | 774 | 826 | 939 | 959 | 1019 | 1062 | 1131 | 1208 |
| Full time JRS/JASTRO-certified ROs | — | — | — | — | — | 308 | 369 | 426 | 477 | 529 | 564 | 756 | 792 | 831 | 899 |
| FTE RT technologist | 592 | 877 | 665 | 733 | 771 | 918 | 1555 | 1635 | 1634 | 1836 | 1841 | 2027 | 2124 | 2215 | 2394 |
| Treatment planning equipment | |||||||||||||||
| X-ray simulators | 295 | 430 | 394 | 452 | 512 | 464 | 532 | 502 | 445 | 361 | 348 | 320 | 305 | 291 | 221 |
| CT simulators | 30 | 75 | 55 | 96 | 164 | 247 | 329 | 407 | 497 | 575 | 633 | 654 | 677 | 688 | 743 |
| RTP computers | 238 | 468 | 374 | 453 | 682 | 680 | 874 | 940 | 1070 | 1271 | 1381 | 1484 | 1611 | 1735 | 2034 |
linac = linear accelerator, Ir = iridium, RO = radiation oncologist, FTE = full-time equivalent, JRS = Japan Radiological Society, JASTRO = Japanese Society for Radiation Oncology, RT = radiotherapy, CT = computed tomography, RTP = radiotherapy planning.
In 2015, based on Japanese cancer registries, the cancer incidence was measured at 891445 cases (measured value) [30] with approximately 25.2% (225 000 of 891 445) of all newly diagnosed patients being treated with radiation. However, it is also reported 903 914 cases as estimated value. In that case, 24.9% (225 000 of 903 914) of newly cancer patients have treated by radiotherapy.
Regarding the case scale of institution, approximately 48.4% of all radiotherapy institutions had ≥200 new radiotherapy patients per year, whereas 31.1% of the institutions had ≥300. Additionally, 36.1% of all radiotherapy institutions had <1.0 FTE ROs. Compared with the findings of a similar survey conducted data in 2007 [14–17] and 2013 [24], the percentage of institutions that have > = 1.0 FTE ROs had improved a little (2007: 43.8%, 2013: 61.1%, 2015: 63.9%), but was not yet sufficient.
When viewed from the perspective of geographic distributions, radiotherapy institutions cover each region in Japan, although there are considerable differences in the number of radiotherapy institutions in prefectures. Concerning the equipment, much of the equipment had been rapidly replaced with ones with excellent functions, although there are differences depending on the scale of the institution. The numbers of staff (ROs, RTTs, medical physicists, radiotherapy quality manager, and nurses) steadily increased. Annual total patient load per RO was 194.3, which was lower than 243.8 of 2007 survey. This patient load has fallen below 200.0 as the standard value of JBBG [25, 26] for the first time in this survey. However, it is conceivable that the burden on radiotherapists has not changed or may have increased, because the burden on each patient by the high-precision radiotherapy has increased. For example, since the 2007 survey, SBRT cases has increased about 4.3 times (2007: 1658, 2015: 7104) and intensity-modulated radiotherapy (IMRT) cases has increased about 29.4 times (2007: 755, 2015: 22168).
With regard to other staff, the numbers of medical physicists and radiotherapy quality managers are absolutely insufficient. Compared with the other types of staff mentioned above, a sufficient number of RTTs is ensured in Japan. Therefore, RTTs partially act as medical physicists and radiotherapy quality managers in most institutions.
The average of structure data of designated cancer care hospitals was better than the national average. Annual patient load per designated cancer care hospital was about 100 patients more than the national average, however annual patient load per FTE RO and annual patient load per FTE RTT were almost the same as the national average. These data suggest that the number of radiotherapy patients in all radiotherapy hospitals may be near to saturation. On the other hand, 21.1% of designated cancer care hospitals had <1.0 FTE RO. Compared with the findings of a similar survey conducted from 8 years ago [17], the above percentages had improved as 16.2%, but it was not yet sufficient. It is conceivable that the more the number of radiotherapy staffs (especially ROs, medical physicists and radiotherapy quality managers) increases, the more the number of patients who can undergo radiotherapy.
In conclusion, the Japanese structure of radiation oncology has clearly and steadily improved over the past 25 years in terms of installation and use of equipment and its functions, nevertheless there are still problems of the shortages of manpower and the structure gap by institution type. We expect that this updated national structure survey of radiation oncology for 2015 will aid the continuous improvement of all aspects of radiation oncology in Japan.
ACKNOWLEDGEMENTS
We wish to thank all ROs, radiation technologists, and other staffs throughout Japan who participated in this survey for their efforts in providing us with valuable information to make this study possible.
Initially submitted Month Day, 2021; accepted for publication Month Day, 2021.
Contributor Information
Hodaka Numasaki, Department of Medical Physics and Engineering, Osaka University Graduate School of Medicine, 1–7 Yamadaoka, Suita-shi, Osaka, 565-0871, Japan.
Yoshihiro Nakada, National Institutes for Quantum and Radiological Science and Technology, 4-9-1 Anagawa, Inage-ku, Chiba 263-8555, Japan.
Yasuo Okuda, National Institutes for Quantum and Radiological Science and Technology, 4-9-1 Anagawa, Inage-ku, Chiba 263-8555, Japan.
Hisateru Ohba, National Institutes for Quantum and Radiological Science and Technology, 4-9-1 Anagawa, Inage-ku, Chiba 263-8555, Japan.
Teruki Teshima, Osaka Heavy Ion Therapy Center, 3-1-10 Otemae, Chuo-ku, Osaka-shi, Osaka, 540-0008, Japan.
Kazuhiko Ogawa, Department of Radiation Oncology, Osaka University Graduate School of Medicine, 2-2 Yamadaoka, Suita-shi, Osaka, 565-0871, Japan.
CONFLICT OF INTEREST
The authors declare they have no conflicts of interest.
FUNDING
This study was supported by the JASTRO and Grants-in-Aid for Scientific Research (c) from the Japan Society for the Promotion of Science [JSPS KAKENHI Grant No. JP21K07728].
References
- 1. Tsunemoto H. Present status of Japanese radiation oncology: national survey of structure in 1990 (in Japanese). J Jpn Soc Ther Radiol Oncol (Special Report) 1992;1–30. [Google Scholar]
- 2. Sato S, Nakamura Y, Kawashima K et al. Present status of radiotherapy in Japan – a census in 1990 - finding on radiotherapy facilities (in Japanese with an English abstract). J Jpn Soc Ther Radiol Oncol 1994;6:83–9. [Google Scholar]
- 3. Morita K, Uchiyama Y. Present status of radiotherapy in Japan –the second census in 1993 (in Japanese with an English abstract). J Jpn Soc Ther Radiol Oncol 1995;7:251–61. [Google Scholar]
- 4. JASTRO Database Committee . Present status of radiotherapy in Japan - the regular census in 1995 (in Japanese with an English abstract). J Jpn Soc Ther Radiol Oncol 1997;9:231–53. [Google Scholar]
- 5. JASTRO Database Committee . Present status of radiotherapy in Japan - the regular census in 1997 (in Japanese with an English abstract). J Jpn Soc Ther Radiol Oncol 2001;13:175–82. [Google Scholar]
- 6. JASTRO Database Committee . Present status of radiotherapy in Japan - the regular structure survey in 1999 (in Japanese with an English abstract). J Jpn Soc Ther Radiol Oncol 2001;13:227–35. [Google Scholar]
- 7. JASTRO Database Committee . Present status of radiotherapy in Japan - the regular structure survey in 2001 (in Japanese with an English abstract). J Jpn Soc Ther Radiol Oncol 2003;15:51–9. [Google Scholar]
- 8. JASTRO Database Committee . Present status of radiotherapy in Japan - the regular structure survey in 2003 (in Japanese with an English abstract). J Jpn Soc Ther Radiol Oncol 2005;17:115–21. [Google Scholar]
- 9. Shibuya H, Tsujii H. The structural characteristics of radiation oncology in Japan in 2003. Int J Radiat Oncol Biol Phys 2005;62:1472–6. [DOI] [PubMed] [Google Scholar]
- 10. Teshima T, Numasaki H, Shibuya H et al. Japanese structure survey of radiation oncology in 2005 (first report) (in Japanese with an English abstract). J Jpn Soc Ther Radiol Oncol 2007;19:181–92. [Google Scholar]
- 11. Teshima T, Numasaki H, Shibuya H et al. Japanese structure survey of radiation oncology in 2005 (second report) (in Japanese with an English abstract). J Jpn Soc Ther Radiol Oncol 2007;19:193–205. [Google Scholar]
- 12. Teshima T, Numasaki H, Shibuya H et al. Japanese structure survey of radiation oncology in 2005 based on institutional stratification of patterns of care study. Int J Radiat Oncol Biol Phys 2008;72:144–52. [DOI] [PubMed] [Google Scholar]
- 13. Numasaki H, Teshima T, Shibuya H et al. National structure of radiation oncology in Japan with special reference to designated cancer care hospital. Int J Clin Oncol 2009;14:237–44. [DOI] [PubMed] [Google Scholar]
- 14. Teshima T, Numasaki H, Shibuya H et al. Japanese structure survey of radiation oncology in 2007 (first report) (in Japanese with an English abstract). J Jpn Soc Ther Radiol Oncol 2009;21:113–25. [Google Scholar]
- 15. Teshima T, Numasaki H, Shibuya H et al. Japanese structure survey of radiation oncology in 2007 (second report) (in Japanese with an English abstract). J Jpn Soc Ther Radiol Oncol 2009;21:126–38. [Google Scholar]
- 16. Teshima T, Numasaki H, Shibuya H et al. Japanese structure survey of radiation oncology in 2007 based on institutional stratification of patterns of care study. Int J Radiat Oncol Biol Phys 2010;72:144–52. [DOI] [PubMed] [Google Scholar]
- 17. Numasaki H, Teshima T, Shibuya H et al. Japanese structure survey of radiation oncology in 2007 with special reference to designated cancer care hospitals. Strahlenther Onkol 2011;187:167–74. [DOI] [PubMed] [Google Scholar]
- 18. Numasaki H, Shibuya H, Nishio M et al. National medical care system may impede fostering of true specialization of radiation oncologists: study based on structure survey in Japan. Int J Radiat Oncol Biol Phys 2012;82:e111–7. [DOI] [PubMed] [Google Scholar]
- 19. Teshima T, Numasaki H, Nishio M et al. Japanese structure survey of radiation oncology in 2009 based on institutional stratification of patterns of care study. J Radiat Res 2012;53:710–2. [DOI] [PMC free article] [PubMed] [Google Scholar]
- 20. Numasaki H, Nishio M, Ikeda H et al. Japanese structure survey of radiation oncology in 2009 with special reference to designated cancer care hospitals. Int J Clin Oncol 2013;18:775–83. [DOI] [PubMed] [Google Scholar]
- 21. Numasaki H, Teshima T, Nishimura T et al. Japanese structure survey of radiation oncology in 2010. J Radiat Res 2019;60:80–97. [DOI] [PMC free article] [PubMed] [Google Scholar]
- 22. Numasaki H, Teshima T, Nishimura T et al. Japanese structure survey of radiation oncology in 2011. J Radiat Res 2019;60:786–802. [DOI] [PMC free article] [PubMed] [Google Scholar]
- 23. Numasaki H, Teshima T, Ando Y et al. Japanese structure survey of radiation oncology in 2012. J Radiat Res 2020;61:146–60. [DOI] [PMC free article] [PubMed] [Google Scholar]
- 24. Numasaki H, Teshima T, Sasaki R et al. Japanese structure survey of radiation oncology in 2013. J Radiat Res 2020;61:799–816. [DOI] [PMC free article] [PubMed] [Google Scholar]
- 25. Japanese PCS Working Group . Radiation Oncology in Multidisciplinary Cancer Therapy -Basic Structure Requirement for Quality Assurance of Radiotherapy Based on Patterns of Care Study in Japan. Ministry of Health, Labor, and Welfare Cancer Research Grant Planned Research Study, 2005, 14–6. [Google Scholar]
- 26. Japanese PCS Working Group . Radiation Oncology in Multidisciplinary Cancer Therapy -Basic Structure Requirement for Quality Assurance of Radiotherapy Based on Patterns of Care Study in Japan. Ministry of Health, Labor, and Welfare Cancer Research Grant Planned Research Study, 2010, 18–4. [Google Scholar]
- 27. Tanisada K, Teshima T, Ohno Y et al. Patterns of care study quantitative evaluation of the quality of radiotherapy in Japan. Cancer 2002;95:164–71. [DOI] [PubMed] [Google Scholar]
- 28. Teshima T. Japanese PCS working group. Patterns of care study in Japan. Jpn J Clin Oncol 2005;35:497–506. [DOI] [PubMed] [Google Scholar]
- 29. Ministry of Health, Labor and Welfare . A List of Designated Cancer Hospitals. http://www.mhlw.go.jp/ (1 December 2018, date last accessed).
- 30. Cancer Information Service, National Cancer Center . Cancer Registry and Statistics. http://ganjoho.jp/reg_stat/statistics/dl/index.html (1 December 2018, date last accessed).
- 31. Statistics Bureau, Ministry of Internal Affairs and Communications . 2015 Population Census. http://www.stat.go.jp/data/jinsui/2012np/index.htm (1 December 2018, date last accessed).